Download to read offline

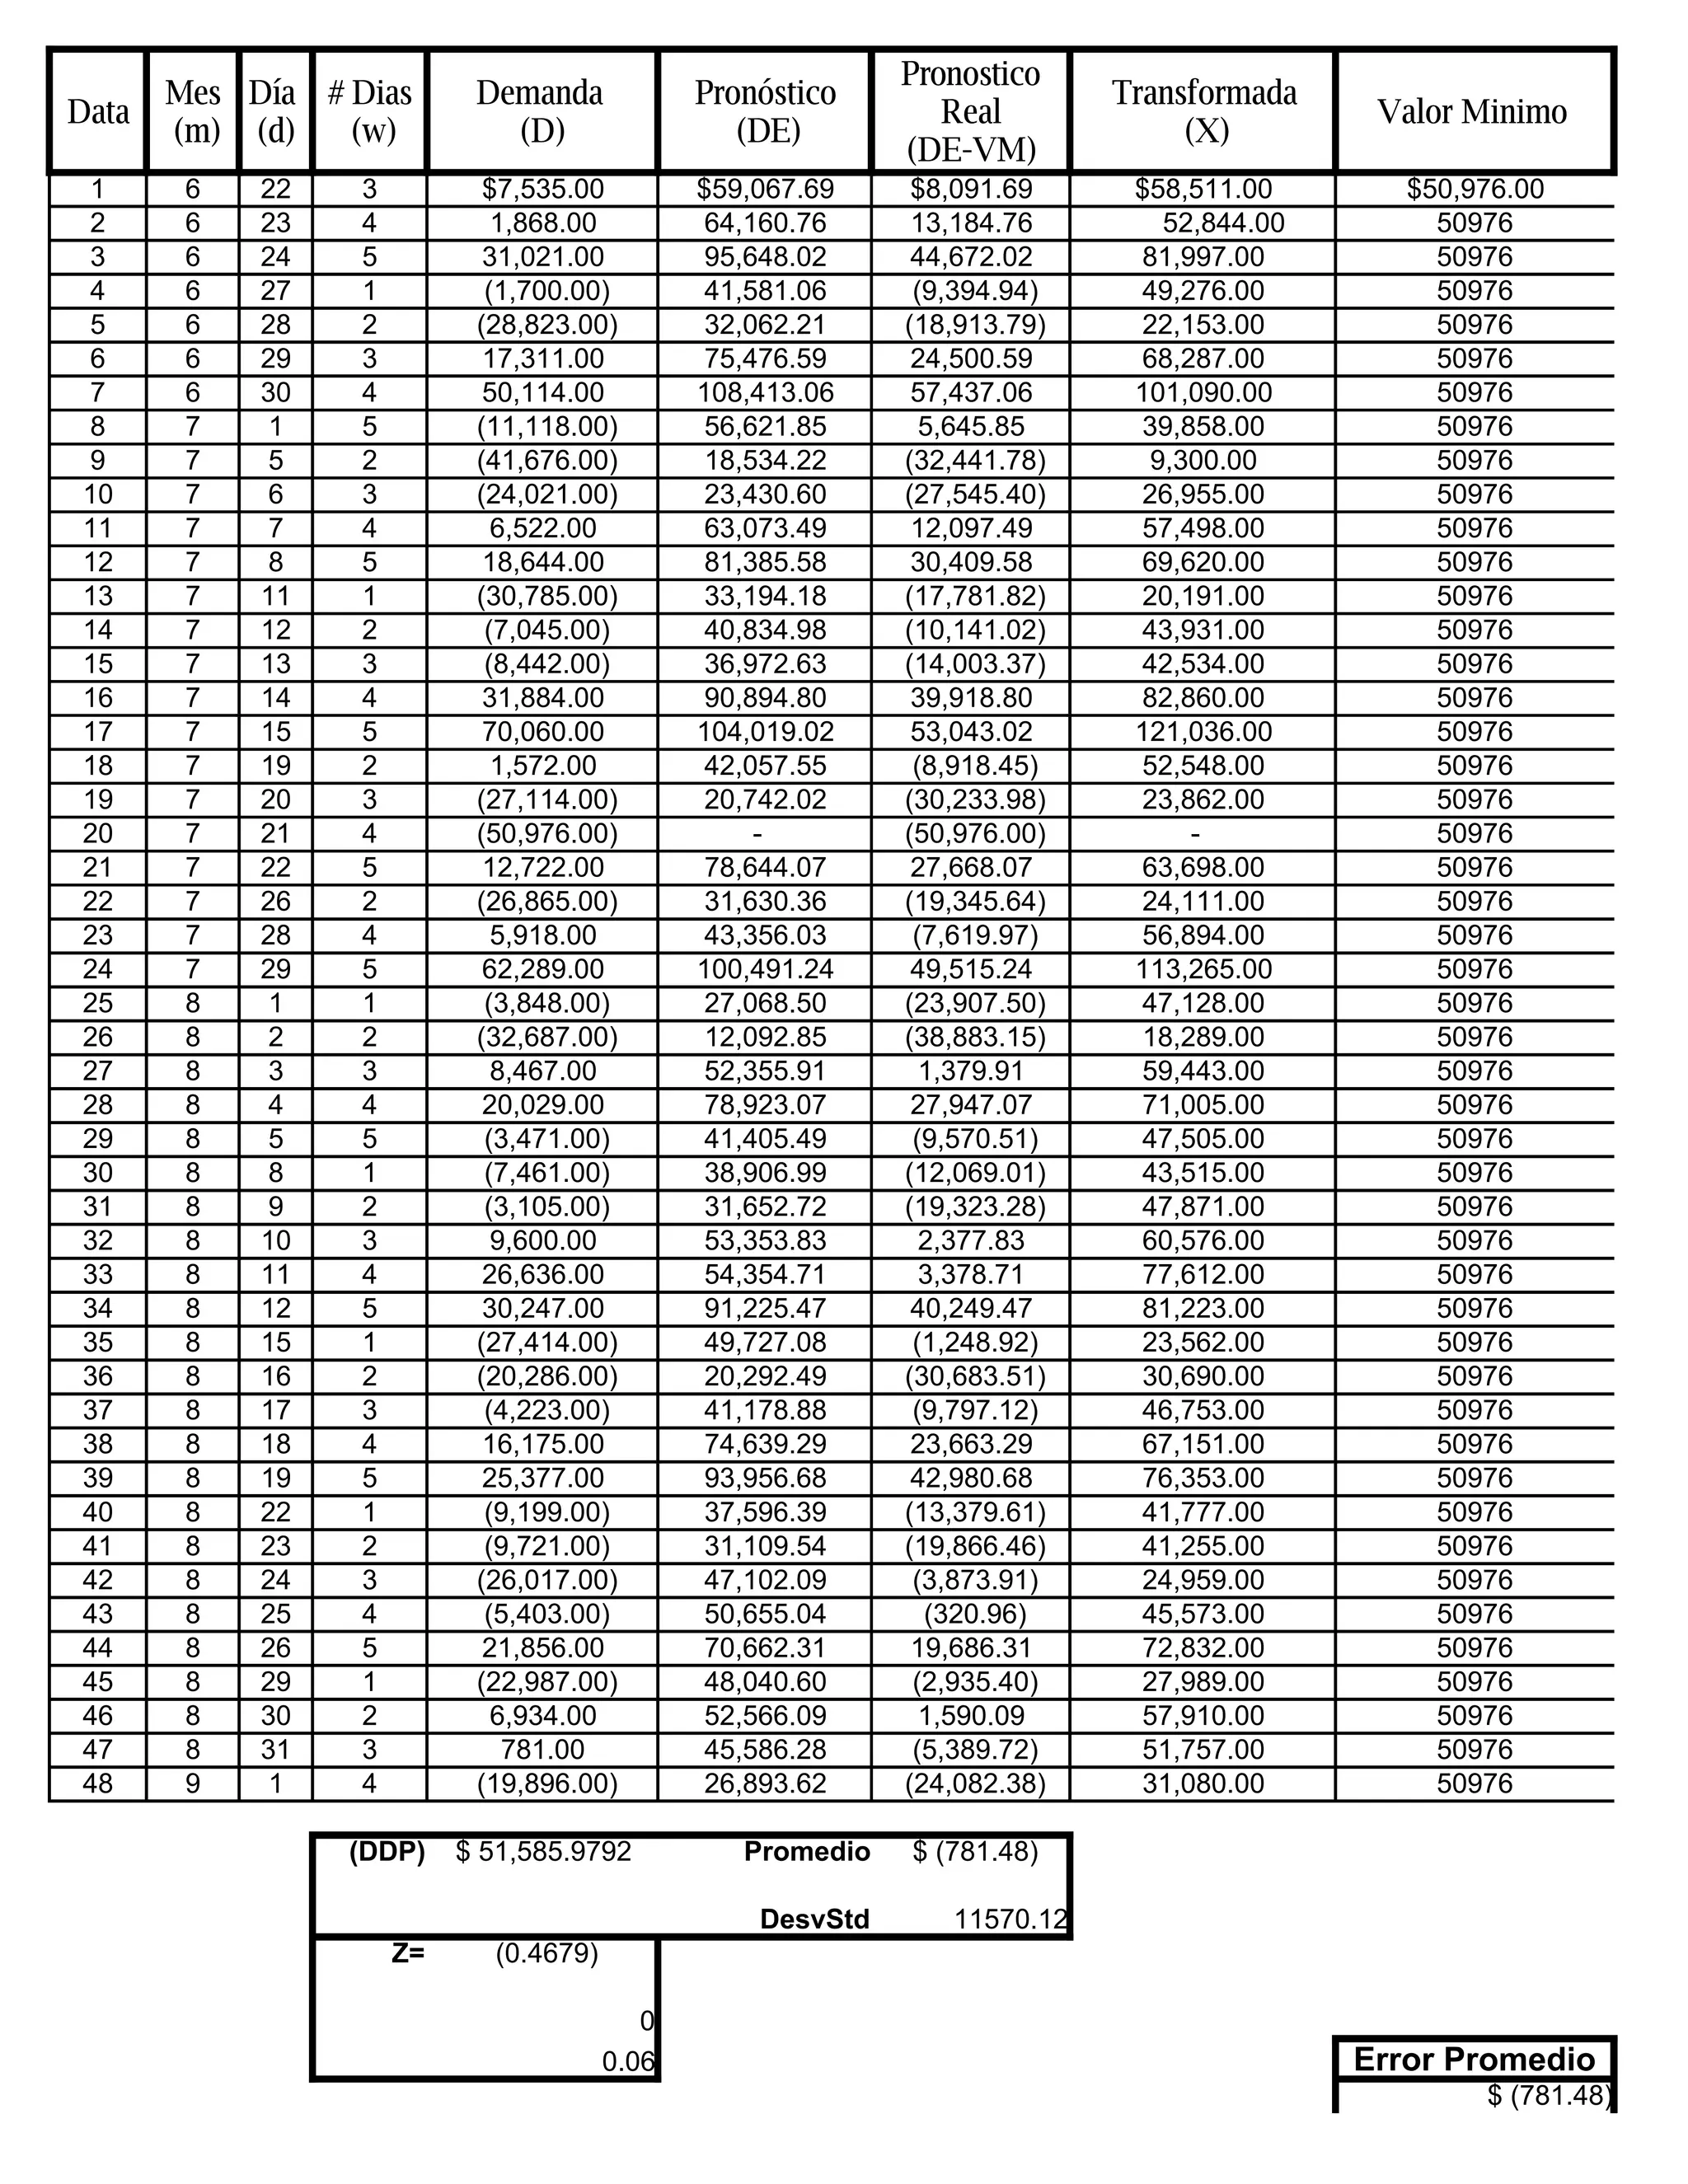
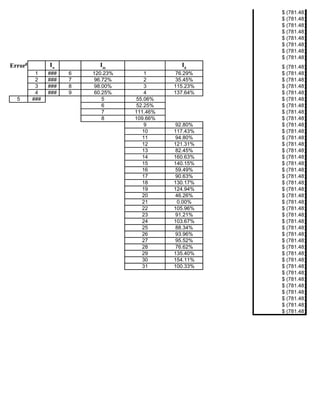
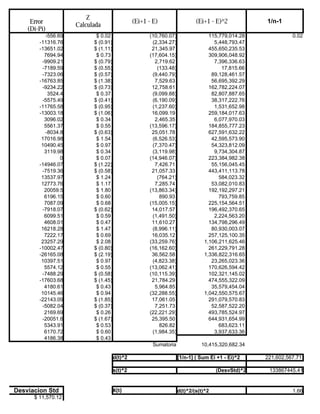
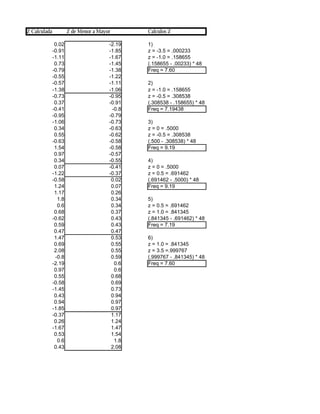
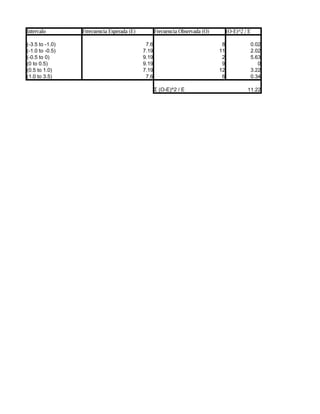

The document appears to be a table containing forecasting data over 48 periods including dates, demand values, forecast values, minimum values, and error calculations. It includes a summary stating the average error was $781.48 with a standard deviation of 11,570.12 and a z-score of 0.4679.


