SlideShare a Scribd company logo
Development of a Time temperature indicator to monitor the real
shelf life of perishable food products for consumer’s safety and
awareness
Outline of the problem:
Expectation of customers towards foods with improved sensory quality, increased
nutritional properties and extended shelf life has led to various improvements in packaging of the
processed food products. Nearly ¾ of all food related illness are the result of poor temperature
control. The temperature variations in a food product can lead to changes in product quality and
safety. Since temperature determines the storage parameter of a processed food product,
therefore monitoring and controlling of temperature is of great importance as it is directly related
to the safety and quality aspects of the food. Consumption of spoiled foods will apparently lead
to a lot of health consequences. Perishables deteriorate in relatively short period of time. For
every 10°C increase above the optimum temperature, the shelf-life of delicate fruit and
vegetables is halved. Optimum temperature range for the growth of pathogens is from 5°C to
57°C. This range is called as danger zone. So, in order for a food to be free from spoilage, it must
be maintained below 4°C. Prolonged exposure to extreme or elevated temperature can force
ripening of fruit, cause dangerous spoilage of foods such as seafood. In some condition, such as
heating pre-prepared food, it is essential to know that a critical temperature has been exceeded.
Besides the microbial growth and possible food borne illness, the high temperature (above 21°C)
accelerates physical changes and chemical reactions promoting deterioration on foods (Karel,
1984). Gregory (1996) reported that vitamins and aroma are affected under temperature above 50
°C and luminosity conditions during storage, transport and commercialization.
An intelligent package is one that can monitor the quality and safety condition of a food
product and provide early warning to the consumer or food manufacturer. Moreover, customer
security assurance is of primary importance. Normally the safety of a chilled ready to eat food is
answered by “Best by” date in the labeling. But that does not explain whether the food product
has been exposed to elevated temperature during storage or transportation. This can be monitored
using a Time Temperature Indicator (TTI).
Current Status:
The applicability of TTIs has been evaluated for various perishable foods including
chilled fish (Tinker et al., 1985; Taoukis et al., 1999), dairy products (Chen and Zall, 1987;
Grisius et al., 1987; Shellhammer and Singh, 1991), meat and poultry (Labuza and Fu, 1995),
frozen fruit and vegetables (Singh and Wells, 1987; Giannakourou and Taoukis, 2002), frozen
meats (Rodriguez and Zaritzki, 1983; Singh and Wells, 1985; Yoon et al., 1994), and to estimate
the remaining shelf life of food products (Fu, Petros, & Theodore, 1999; Rice, 1989; Sherlock,
Fu, & Taoukis, 1991; Taoukis and Labuza, 1989; Taoukis et al., 1999; Taoukis, 2001), A TTI
developed based on a fadable ink, which disappear in a defined time period (Galagan., Y, 2008).
An amylase type time temperature indicator was developed based on the reaction between starch
and amylase (Sun Yan, 2008)
Based on the mechanism, there are three different types of TTIs are commercially
available. (1) Polymerization - Fresh-Check®
by LifeLines Technology, Inc. is based on
polymerisation reaction of diacetylenic monomers. As polymerisation takes place, the colour of a
‘‘bulls-eye’’ patterned indicator changes gradually. (2) Enzymatic or chemical reaction -
Checkpoint®
developed by Vitsab, based on an enzymatic reaction causing pH-change in the
reaction mixture, is activated by breaking the seal between a solution containing lipolytic
enzyme and its lipid substrate. The reaction is visualised with a pH dye included in the system,
the colour of the dye is changed from green to yellow as the pH changes during the reaction. (3)
Diffusion - 3M MonitorMark®
USA, has launched a TTI which is diffusion based indicator label
and is on the color change of an oxidable chemical system controlled by temperature-dependent
permeation through a film. The process is activated by a blue-dyed fatty acid ester diffusing
along a wick. A viscoelastic material migrates into a diffusely light reflective porous matrix at a
temperature dependent rate. MonitorMark has two versions of TTI, one for monitoring
distribution, for industrial use and other, providing consumer information, the smart label
(Kuswandi et al., 2011). Timestrips® (Timestrip UK Limited, UK are smart labels for monitor
how long a product has been open or how long it has been in use. The label is automatically
activated when the consumer opens the packaging or it can be supplied as an external label that
consumers can manually activate when they first use a product (Selman, 1995; Kuswandi et al.,
2011). (eO)® TTI, is based on a time-temperature depended pH change caused by controlled
microbial growth selected strains of lactic acid bacteria that is expressed to colour change
through suitable pH indicators. Once they attached to the food, in case of temperature
fluctuation, or when the product reaches its use by date, the temperature-dependent growth of the
TTI microorganisms causes a pH drop in the tags leading to an irreversible color change of the
indicator which becomes red (Ellouze et al., 2008; Taoukis, 2008).
Although, lot of literature available on TTI based on various mechanisms, cost and
complexity of the device makes it difficult for practical application. This work focuses on
development of an economical, efficient and simple TTI, based on chemical reaction that can
have large application in the market.
Importance of the work:
The role of temperature on the spoilage rate in foods, as it is for any chemical reaction, is
well known. The temperature not only affects the rate of spoilage reactions, which involve both
bacterial and autolytic enzymes, but it also affects the rate at which bacteria multiply. For
example, generation time for Pseudomonas fragi, a common fish-spoilage bacterium, is about 12
hours at 32°F; it is only about 2 hours at 55°F (Duncan and Nickerson 1961). Storage
temperature can also influence which type of disease develops. For example in potatoes the fungi
that causes dry rot can grow rapidly at lower temperatures (15 -25°C) whereas the bacteria that
cause the soft smelly rot, only grows rapidly at warmer temperatures (> 25°C).Thus, Storage
temperature is very important to guarantee microbial quality and safety of perishable foods.
Temperature fluctuation during storage and distribution of food will lead to spoilage of food and
thus by reduction in shelf life and quality of the food product. Consumption of spoiled food
product leads to various health hazardous like Stomach cramps, Fever, Headache, Nausea,
Vomiting, Diarrhea and may also result in fatal end. So it is essential to understand and educate
customers about the time temperature history of the food product. This can be achieved by
attaching a TTI on the external surface of the food product, which will undergo colour change
with varying temperature to which the food is being subjected.
Objectives:
 To develop a Time temperature indicator (TTI) that changes colour with respect to the
change in temperature of food product, thus by understanding the temperature history of
the food product for food safety.
 To optimize TTI for few selected perishable food product.
 To monitor the real shelf life of a perishable food product using TTI.
Technical Program:
Designing of TTI:
TTI can be optimized into a label form that can be attached externally on the food
product to monitor the time temperature history of the product. Label can be designed in such a
way that it contains two compartments. These two compartments can be separated by a physical
barrier to avoid contact between activator and the gel matrix. Removing physically the barrier
between two compartments will results in activation of the TTI and helps to monitor the time
temperature history of the food product to which it is being attached.
TTI response:
To identify the TTI response, storage experiments to be conducted at the same isothermal
and non-isothermal conditions as those applied for the perishable food product. For six different
temperature profiles the continuous colour change of the reaction window of TTIs will be
measured instrumentally at regular time intervals using a colour measuring instrument until the
end point colour will be reached.
Change in colour of TTI:
The change in colour of TTI will be measured using a colour analyzer. The L*, a*, b*
chroma system, which uses the corresponding value of total color difference (∆E) as dynamic
parameters, will be used to analyze the dynamic change in the indicator’s color. According to the
indicator kinetics characterized by Taoukis and Labuza (1989), the total color difference value X
= ∆E of the indicator could be expressed in terms of a response function as follows:
F(X) = kt
Where, k stands for the rate constant of the reaction that is correlated with temperature, and t
stands for the storage time. By plotting a curve between the response function of total color
difference F(X) and time, a straight line could be obtained, and the k of different storage
temperatures could be calculated from the slope. Taking the logarithm on both sides of the
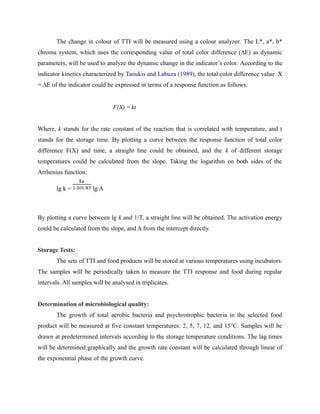
Arrhenius function:
lg k = lg A
By plotting a curve between lg k and 1/T, a straight line will be obtained. The activation energy
could be calculated from the slope, and A from the intercept directly.
Storage Tests:
The sets of TTI and food products will be stored at various temperatures using incubators.
The samples will be periodically taken to measure the TTI response and food during regular
intervals. All samples will be analysed in triplicates.
Determination of microbiological quality:
The growth of total aerobic bacteria and psychrotrophic bacteria in the selected food
product will be measured at five constant temperatures: 2, 5, 7, 12, and 15°C. Samples will be
drawn at predetermined intervals according to the storage temperature conditions. The lag times
will be determined graphically and the growth rate constant will be calculated through linear of
the exponential phase of the growth curve.
Samples of food product will be aseptically weighed, added to 1/4 strength Ringer's
solution, and will be homogenized in a stomacher for 60 seconds at room temperature. Decimal
serial dilutions in quarter strength Ringer's solution will be prepared and duplicate 1 ml or 0.1 ml
samples of appropriate dilutions will be poured or spread on the surface of the appropriate media
in petri dishes for enumeration of Total viable count (TVC). All plates will be examined visually
for typical colony types and morphological characteristics that were associated with each growth
medium.
Sensory Evaluation:
The typical sensory analysis for selected food product will be followed during the storage
experiments at different temperatures. The evaluation will be performed by a trained sensory
panel (8–10 people) using QDA on 15 point scale (Stone, H. & Sidel, 1993). The sensory
qualities will be judged under fluorescent light in a booth room with individual boxes, rating
from 1 (excellent fresh) to 10 (extremely deteriorated). The cut-off score was fixed at 7.5. The
sample will be considered as unacceptable when a mean score above five is reached.
Calibration curves of TTI response vs. quality changes:
TTI is an indicator to show the food quality changes during storage or distribution. So
there should be a fixed relationship between TTI response and food qualities, otherwise TTI
would not be a reliable indicator. The data points of TTI response could directly be correlated
with those of the food qualities by eliminating the storage time, a common independent variable,
from both relationships. The lines will be estimated by using the kinetic equations for TTI
response and food product quality.
Year-wise plan of work:
First year:
1. Development of time temperature indicator using various pH indicators.
2. Optimization of the pH dyes for the development of TTI
3. Optimizing parameters of TTI for specific perishable food products.
Second Year:
1. Designing of TTI into a label form
2. Application of the indicator with perishable food products and accessing their shelf
life.
Third Year:
1. Studies on relationship between the color change of TTI and quality characteristics of
the food product.
2. Presentation of the work in conferences.
3. PhD thesis preparation
References
 Chen, J.H. & Zall, R.R., (1987). Packaged milk, cream and cottage cheese can be
monitored for freshness using polymer indicator labels. Dairy Food Sanit. 7, 402–404.
 Duncan, D. W., Jr. & J. T. R. Nickerson. (1961). Effect or environmental and
physiological conditions on the exponential phase growlh or Pseudomonasfragi (ATCC
4973). In Proc. Low Temp. Microbiol. Symp., p. 253-262. Campbell Soup Co., Camden,
N.J.
 Ellouze, M., Pichaud, M., Bonaiti, C., Coroller, I., Couvert, O., Thuault, D. & Vaillant,
R., (2008) Modelling pH evolution and lactic acid production in the growth medium of a
lactic acid bacterium: application to set a biological TTI. International Journal of Food
Microbiology, Vol. 128, p. 101–107. ISSN 0168-1605.
 Fu, B., Petros, S., & Theodore, P. L. (1999). Predictive microbiology for monitoring
spoilage of dairy products with time–temperature integrators. Journal of Food Science,
56 (5), 1209–1215.
 Giannakourou, M.C. & Taoukis, P.S., (2002). Systematic application of time temperature
integrators as tools for control of frozen vegetable quality. J. Food Sci. 67, 2221–2228.
 Gregory, J.F., (1996). Vitamins. In: Fennema, O.R. (Ed.), Food Chemistry, 3rd ed. Marcel
Dekker, New York, pp. 531–616.
 Grisius, R.,Wells, J.H., Barrett, E.L. & Singh, R.P., (1987). Correlation of time
temperature indicator response with microbial growth in pasteurized milk. J. Food
Process. Preserv. 11, 309–324.
 Kuswandi, B., Wicaksono, Y., Jayus; Abdullah, A., Lee yook heng & Ahmad, M., (2011):
Smart packaging: sensors for monitoring of food quality and safety.
 Labuza, T.P. & Fu, B., (1995). Use of time temperature integrators, predictive
microbiology, and related technologies for assessing the extent and impact of temperature
abuse on meat and poultry products. J. Food Safety 15, 201–217.
 Management of Perishable Product Quality in the Cold Chain. In: Kerry, J. & Butler, P.
(ed.), (2008): Smart Packaging Technologies for Fast Moving Consumer Goods. John
Wiley&Sons, Ltd., 61–74. ISBN 978-0470028025.
 Rice, J. (1989). Keeping time–temperature tabs on refrigerated foods. Food Process,
50(8), 149–158.
 Rodriguez, N. & Zaritzki, N.E., (1983). Development of time temperature integrator
indicator for frozen beef. J. Food Sci. 48, 1526–1531.
 Selman, J. D., (1995): Time-temperature indicators. In Rooney, M. L. (ed.), 1995: Active
food packaging. 1st edition, London, UK: Blackie Academic & Professional, pp. 215–
237, ISBN 978-0751401912.
 Shellhammer, T.H. & Singh, R.P., (1991). Monitoring chemical and microbial changes of
cottage cheese using a full history time–temperature indicator. J. Food Sci. 56, 402–405,
410.
 Sherlock, M., Fu, B., & Taoukis, P. S. (1991). A system aticevaluation of time–
temperature indicators for use as consumer labels. Journal of Food Protection, 54(11),
885–889.
 Singh, R.P. & Wells, J.H., (1985). Use of time–temperature indicators to monitor quality
of frozen hamburger. Food Technol. 39, 42–50.
 Stone., H. & Sidel. (1993). Sensory evaluation practices. 2nd
ed. Academic press, Inc.
New York, NY.
 Sun Yan., Cai Huawei., Zheng Limin., Ren Fazheng., Zhang Luda., & Zhang Hengtao.,
(2008). Development and characterization of a new amylase type time–temperature
indicator, Food Control. 19:315–319
 Taoukis, P. S., (2008). Application of Time– Temperature Integrators for Monitoring and
Management of Perishable Product Quality in the Cold Chain. In: Kerry, J. and Butler, P.
(ed.), 2008: Smart Packaging Technologies for Fast Moving Consumer Goods. John
Wiley&Sons, Ltd., 61–74. ISBN 978-0470028025.
 Taoukis, P.S., (2001). Modeling the use of time–temperature indicators in distribution and
stock rotation. In: Tijkskens, L.M.M., Hertog, M.L.A.T.M., Nicolaï, B.M. (Eds.), Food
Process Modeling. CRC Press, Washington, DC, pp. 402–432.
 Taoukis, P.S., Koutsoumanis, K., & Nychas, G.J.E., (1999). Use of time–temperature
integrators and predictive modelling for shelf life control of chilled fish under dynamic
storage conditions. Int. J. Food Microbiol. 53, 21–31.
 Tinker, J.H., Slavin, J.W., Learson, R.J., & Empola, V.G., (1985). Evaluation of
automated time–temperature monitoring system in measuring the freshness of chilled
fish. IIF-IIR Commissions C2, D3 4, 286– 290.
 Y. Galagan, & Su W. F., (2008). Fadable ink for time–temperature control of food
freshness: Novel new time–temperature indicator. Food Research International. 41: 653–
657
 Yoon, S.H., Lee, C.H., Kim, D.Y., Kim, J.W., & Park, K.H., (1994). Time–temperature
indicator using phospholipid–phospholipase system and application to storage of frozen
pork. J. Food Sci. 59, 490–493.

More Related Content

Viewers also liked

Competitors landscape
Competitors landscapeCompetitors landscape
Competitors landscape
Paola Cretico
 
Formato hoja vida_juan_sebastian
Formato hoja vida_juan_sebastianFormato hoja vida_juan_sebastian
Formato hoja vida_juan_sebastian
Juan Sebastián Chaparro Correa
 
FahrradJäger
FahrradJägerFahrradJäger
FahrradJäger
Steffi Wulf
 
Blue Planet Technologies2010 V03 Short
Blue Planet Technologies2010 V03 ShortBlue Planet Technologies2010 V03 Short
Blue Planet Technologies2010 V03 Short
WESAustralia
 
Programa de Dirección en Big Data - IE Business School
Programa de Dirección en Big Data - IE Business School Programa de Dirección en Big Data - IE Business School
Programa de Dirección en Big Data - IE Business School
DEMETRIO BARRAGAN
 
Construccion de ciudadania -Camila 3º A
Construccion de ciudadania -Camila 3º AConstruccion de ciudadania -Camila 3º A
Construccion de ciudadania -Camila 3º A
leandraspinosa
 
6 secrets of persuasive writing
6 secrets of persuasive writing6 secrets of persuasive writing
6 secrets of persuasive writing
Pamela Thorne
 
Jaque Mate mes de octubre 2012
Jaque Mate mes de octubre 2012Jaque Mate mes de octubre 2012
Jaque Mate mes de octubre 2012
ComiteOlimpicoG
 
Best Practices for File Sharing
Best Practices for File SharingBest Practices for File Sharing
Best Practices for File Sharing
Osterman Research, Inc.
 
3 codigo ascii ≈ [×bern@chea m×™]
3 codigo ascii ≈ [×bern@chea m×™]3 codigo ascii ≈ [×bern@chea m×™]
3 codigo ascii ≈ [×bern@chea m×™]
Dante Julinho Bernachea Monago
 
Emerging City Report - Brasilia (2014)
Emerging City Report - Brasilia (2014)Emerging City Report - Brasilia (2014)
Emerging City Report - Brasilia (2014)
ResearchFox
 
Play station 4
Play station 4Play station 4
CV_Carlos_Prieto_Lopez_2016_ES_VF (2)
CV_Carlos_Prieto_Lopez_2016_ES_VF (2)CV_Carlos_Prieto_Lopez_2016_ES_VF (2)
CV_Carlos_Prieto_Lopez_2016_ES_VF (2)
Carlos Prieto
 
AltaMed - The Patient Centered Medical Home, PCMH
AltaMed - The Patient Centered Medical Home, PCMHAltaMed - The Patient Centered Medical Home, PCMH
AltaMed - The Patient Centered Medical Home, PCMH
Sea Mar Community Health Centers
 
Conflicts resulting from the Creation of new Districts in Uganda
Conflicts resulting from the Creation of new Districts in Uganda Conflicts resulting from the Creation of new Districts in Uganda
Conflicts resulting from the Creation of new Districts in Uganda
Ronny Kajaga
 
Bitcoin hardware wallets security
Bitcoin hardware wallets securityBitcoin hardware wallets security
Bitcoin hardware wallets security
Eric Larcheveque
 
Corpo flash 08 2016
Corpo flash 08 2016Corpo flash 08 2016
Corpo flash 08 2016
Jenny Palacios
 
Hinduismo 120321063319-phpapp01
Hinduismo 120321063319-phpapp01Hinduismo 120321063319-phpapp01
Hinduismo 120321063319-phpapp01
DCRDANYLA
 
Jungheinrich growingwith passion2016
Jungheinrich growingwith passion2016Jungheinrich growingwith passion2016
Jungheinrich growingwith passion2016
Company Spotlight
 

Viewers also liked (19)

Competitors landscape
Competitors landscapeCompetitors landscape
Competitors landscape
 
Formato hoja vida_juan_sebastian
Formato hoja vida_juan_sebastianFormato hoja vida_juan_sebastian
Formato hoja vida_juan_sebastian
 
FahrradJäger
FahrradJägerFahrradJäger
FahrradJäger
 
Blue Planet Technologies2010 V03 Short
Blue Planet Technologies2010 V03 ShortBlue Planet Technologies2010 V03 Short
Blue Planet Technologies2010 V03 Short
 
Programa de Dirección en Big Data - IE Business School
Programa de Dirección en Big Data - IE Business School Programa de Dirección en Big Data - IE Business School
Programa de Dirección en Big Data - IE Business School
 
Construccion de ciudadania -Camila 3º A
Construccion de ciudadania -Camila 3º AConstruccion de ciudadania -Camila 3º A
Construccion de ciudadania -Camila 3º A
 
6 secrets of persuasive writing
6 secrets of persuasive writing6 secrets of persuasive writing
6 secrets of persuasive writing
 
Jaque Mate mes de octubre 2012
Jaque Mate mes de octubre 2012Jaque Mate mes de octubre 2012
Jaque Mate mes de octubre 2012
 
Best Practices for File Sharing
Best Practices for File SharingBest Practices for File Sharing
Best Practices for File Sharing
 
3 codigo ascii ≈ [×bern@chea m×™]
3 codigo ascii ≈ [×bern@chea m×™]3 codigo ascii ≈ [×bern@chea m×™]
3 codigo ascii ≈ [×bern@chea m×™]
 
Emerging City Report - Brasilia (2014)
Emerging City Report - Brasilia (2014)Emerging City Report - Brasilia (2014)
Emerging City Report - Brasilia (2014)
 
Play station 4
Play station 4Play station 4
Play station 4
 
CV_Carlos_Prieto_Lopez_2016_ES_VF (2)
CV_Carlos_Prieto_Lopez_2016_ES_VF (2)CV_Carlos_Prieto_Lopez_2016_ES_VF (2)
CV_Carlos_Prieto_Lopez_2016_ES_VF (2)
 
AltaMed - The Patient Centered Medical Home, PCMH
AltaMed - The Patient Centered Medical Home, PCMHAltaMed - The Patient Centered Medical Home, PCMH
AltaMed - The Patient Centered Medical Home, PCMH
 
Conflicts resulting from the Creation of new Districts in Uganda
Conflicts resulting from the Creation of new Districts in Uganda Conflicts resulting from the Creation of new Districts in Uganda
Conflicts resulting from the Creation of new Districts in Uganda
 
Bitcoin hardware wallets security
Bitcoin hardware wallets securityBitcoin hardware wallets security
Bitcoin hardware wallets security
 
Corpo flash 08 2016
Corpo flash 08 2016Corpo flash 08 2016
Corpo flash 08 2016
 
Hinduismo 120321063319-phpapp01
Hinduismo 120321063319-phpapp01Hinduismo 120321063319-phpapp01
Hinduismo 120321063319-phpapp01
 
Jungheinrich growingwith passion2016
Jungheinrich growingwith passion2016Jungheinrich growingwith passion2016
Jungheinrich growingwith passion2016
 

Similar to Proposal TTI

SMART PACKAGING in dairy and food industry
SMART PACKAGING in dairy and food industrySMART PACKAGING in dairy and food industry
SMART PACKAGING in dairy and food industry
SHASHANKRKIRAN18DTEC
 
ICHQ5C
ICHQ5CICHQ5C
Chill
ChillChill
Chill
Skillenza
 
Institution of Prosecution against the Act of Transporting In a Vehicle a Bul...
Institution of Prosecution against the Act of Transporting In a Vehicle a Bul...Institution of Prosecution against the Act of Transporting In a Vehicle a Bul...
Institution of Prosecution against the Act of Transporting In a Vehicle a Bul...
Agriculture Journal IJOEAR
 
Heat Treatment of Foods
Heat Treatment of FoodsHeat Treatment of Foods
Heat Treatment of Foods
Italia Food Tec A.P.S.
 
General Examination
General ExaminationGeneral Examination
General Examination
Steven Brandon
 
Tratamiento termico en alimentos por calor 123
Tratamiento termico en alimentos por calor 123Tratamiento termico en alimentos por calor 123
Tratamiento termico en alimentos por calor 123
GUEVARABERNARDOARIAN
 
Stability studies
Stability studiesStability studies
Stability studies
shaik malangsha
 
Food Processing and preservation 3 - Sterilization.pdf
Food Processing and preservation 3 - Sterilization.pdfFood Processing and preservation 3 - Sterilization.pdf
Food Processing and preservation 3 - Sterilization.pdf
PeterJofilisi
 
Food Processing and preservation 3 - Sterilization.pdf
Food Processing and preservation 3 - Sterilization.pdfFood Processing and preservation 3 - Sterilization.pdf
Food Processing and preservation 3 - Sterilization.pdf
PeterJofilisi
 
Evaluation of the efficiency of sterilization methods. Sterility indicators
Evaluation of the efficiency of sterilization methods.Sterility indicatorsEvaluation of the efficiency of sterilization methods.Sterility indicators
Evaluation of the efficiency of sterilization methods. Sterility indicators
Ms. Pooja Bhandare
 
pnut-43-02-01_1..12 JMC one edit
pnut-43-02-01_1..12 JMC one editpnut-43-02-01_1..12 JMC one edit
pnut-43-02-01_1..12 JMC one edit
Jane Caldwell
 
Preservationcombined
PreservationcombinedPreservationcombined
Preservationcombined
Jesus Luna
 
Presentation on-stability-study of pharmaceutical product
Presentation on-stability-study of pharmaceutical productPresentation on-stability-study of pharmaceutical product
Presentation on-stability-study of pharmaceutical product
Md Mohsin
 
Effect of temperature, time, and material thickness on the dehydration proces...
Effect of temperature, time, and material thickness on the dehydration proces...Effect of temperature, time, and material thickness on the dehydration proces...
Effect of temperature, time, and material thickness on the dehydration proces...
fstdesk.com
 
A0490106
A0490106A0490106
JFS#2 final before print 10-9-15 jfds13139_Rev (1)
JFS#2 final before print 10-9-15 jfds13139_Rev (1)JFS#2 final before print 10-9-15 jfds13139_Rev (1)
JFS#2 final before print 10-9-15 jfds13139_Rev (1)
Jane Caldwell
 
Nii korley kortei (correlation)
Nii korley kortei (correlation)Nii korley kortei (correlation)
Nii korley kortei (correlation)
Nii Korley Kortei
 
Effect of early age thermal challenge on growth performance, haematological p...
Effect of early age thermal challenge on growth performance, haematological p...Effect of early age thermal challenge on growth performance, haematological p...
Effect of early age thermal challenge on growth performance, haematological p...
Innspub Net
 
Heat exchange_QA_Final
Heat exchange_QA_FinalHeat exchange_QA_Final

Similar to Proposal TTI (20)

SMART PACKAGING in dairy and food industry
SMART PACKAGING in dairy and food industrySMART PACKAGING in dairy and food industry
SMART PACKAGING in dairy and food industry
 
ICHQ5C
ICHQ5CICHQ5C
ICHQ5C
 
Chill
ChillChill
Chill
 
Institution of Prosecution against the Act of Transporting In a Vehicle a Bul...
Institution of Prosecution against the Act of Transporting In a Vehicle a Bul...Institution of Prosecution against the Act of Transporting In a Vehicle a Bul...
Institution of Prosecution against the Act of Transporting In a Vehicle a Bul...
 
Heat Treatment of Foods
Heat Treatment of FoodsHeat Treatment of Foods
Heat Treatment of Foods
 
General Examination
General ExaminationGeneral Examination
General Examination
 
Tratamiento termico en alimentos por calor 123
Tratamiento termico en alimentos por calor 123Tratamiento termico en alimentos por calor 123
Tratamiento termico en alimentos por calor 123
 
Stability studies
Stability studiesStability studies
Stability studies
 
Food Processing and preservation 3 - Sterilization.pdf
Food Processing and preservation 3 - Sterilization.pdfFood Processing and preservation 3 - Sterilization.pdf
Food Processing and preservation 3 - Sterilization.pdf
 
Food Processing and preservation 3 - Sterilization.pdf
Food Processing and preservation 3 - Sterilization.pdfFood Processing and preservation 3 - Sterilization.pdf
Food Processing and preservation 3 - Sterilization.pdf
 
Evaluation of the efficiency of sterilization methods. Sterility indicators
Evaluation of the efficiency of sterilization methods.Sterility indicatorsEvaluation of the efficiency of sterilization methods.Sterility indicators
Evaluation of the efficiency of sterilization methods. Sterility indicators
 
pnut-43-02-01_1..12 JMC one edit
pnut-43-02-01_1..12 JMC one editpnut-43-02-01_1..12 JMC one edit
pnut-43-02-01_1..12 JMC one edit
 
Preservationcombined
PreservationcombinedPreservationcombined
Preservationcombined
 
Presentation on-stability-study of pharmaceutical product
Presentation on-stability-study of pharmaceutical productPresentation on-stability-study of pharmaceutical product
Presentation on-stability-study of pharmaceutical product
 
Effect of temperature, time, and material thickness on the dehydration proces...
Effect of temperature, time, and material thickness on the dehydration proces...Effect of temperature, time, and material thickness on the dehydration proces...
Effect of temperature, time, and material thickness on the dehydration proces...
 
A0490106
A0490106A0490106
A0490106
 
JFS#2 final before print 10-9-15 jfds13139_Rev (1)
JFS#2 final before print 10-9-15 jfds13139_Rev (1)JFS#2 final before print 10-9-15 jfds13139_Rev (1)
JFS#2 final before print 10-9-15 jfds13139_Rev (1)
 
Nii korley kortei (correlation)
Nii korley kortei (correlation)Nii korley kortei (correlation)
Nii korley kortei (correlation)
 
Effect of early age thermal challenge on growth performance, haematological p...
Effect of early age thermal challenge on growth performance, haematological p...Effect of early age thermal challenge on growth performance, haematological p...
Effect of early age thermal challenge on growth performance, haematological p...
 
Heat exchange_QA_Final
Heat exchange_QA_FinalHeat exchange_QA_Final
Heat exchange_QA_Final
 

Proposal TTI

  • 1. Development of a Time temperature indicator to monitor the real shelf life of perishable food products for consumer’s safety and awareness Outline of the problem: Expectation of customers towards foods with improved sensory quality, increased nutritional properties and extended shelf life has led to various improvements in packaging of the processed food products. Nearly ¾ of all food related illness are the result of poor temperature control. The temperature variations in a food product can lead to changes in product quality and safety. Since temperature determines the storage parameter of a processed food product, therefore monitoring and controlling of temperature is of great importance as it is directly related to the safety and quality aspects of the food. Consumption of spoiled foods will apparently lead to a lot of health consequences. Perishables deteriorate in relatively short period of time. For every 10°C increase above the optimum temperature, the shelf-life of delicate fruit and vegetables is halved. Optimum temperature range for the growth of pathogens is from 5°C to 57°C. This range is called as danger zone. So, in order for a food to be free from spoilage, it must be maintained below 4°C. Prolonged exposure to extreme or elevated temperature can force ripening of fruit, cause dangerous spoilage of foods such as seafood. In some condition, such as heating pre-prepared food, it is essential to know that a critical temperature has been exceeded. Besides the microbial growth and possible food borne illness, the high temperature (above 21°C) accelerates physical changes and chemical reactions promoting deterioration on foods (Karel, 1984). Gregory (1996) reported that vitamins and aroma are affected under temperature above 50 °C and luminosity conditions during storage, transport and commercialization. An intelligent package is one that can monitor the quality and safety condition of a food product and provide early warning to the consumer or food manufacturer. Moreover, customer security assurance is of primary importance. Normally the safety of a chilled ready to eat food is answered by “Best by” date in the labeling. But that does not explain whether the food product has been exposed to elevated temperature during storage or transportation. This can be monitored using a Time Temperature Indicator (TTI).
  • 2. Current Status: The applicability of TTIs has been evaluated for various perishable foods including chilled fish (Tinker et al., 1985; Taoukis et al., 1999), dairy products (Chen and Zall, 1987; Grisius et al., 1987; Shellhammer and Singh, 1991), meat and poultry (Labuza and Fu, 1995), frozen fruit and vegetables (Singh and Wells, 1987; Giannakourou and Taoukis, 2002), frozen meats (Rodriguez and Zaritzki, 1983; Singh and Wells, 1985; Yoon et al., 1994), and to estimate the remaining shelf life of food products (Fu, Petros, & Theodore, 1999; Rice, 1989; Sherlock, Fu, & Taoukis, 1991; Taoukis and Labuza, 1989; Taoukis et al., 1999; Taoukis, 2001), A TTI developed based on a fadable ink, which disappear in a defined time period (Galagan., Y, 2008). An amylase type time temperature indicator was developed based on the reaction between starch and amylase (Sun Yan, 2008) Based on the mechanism, there are three different types of TTIs are commercially available. (1) Polymerization - Fresh-Check® by LifeLines Technology, Inc. is based on polymerisation reaction of diacetylenic monomers. As polymerisation takes place, the colour of a ‘‘bulls-eye’’ patterned indicator changes gradually. (2) Enzymatic or chemical reaction - Checkpoint® developed by Vitsab, based on an enzymatic reaction causing pH-change in the reaction mixture, is activated by breaking the seal between a solution containing lipolytic enzyme and its lipid substrate. The reaction is visualised with a pH dye included in the system, the colour of the dye is changed from green to yellow as the pH changes during the reaction. (3) Diffusion - 3M MonitorMark® USA, has launched a TTI which is diffusion based indicator label and is on the color change of an oxidable chemical system controlled by temperature-dependent permeation through a film. The process is activated by a blue-dyed fatty acid ester diffusing along a wick. A viscoelastic material migrates into a diffusely light reflective porous matrix at a temperature dependent rate. MonitorMark has two versions of TTI, one for monitoring distribution, for industrial use and other, providing consumer information, the smart label (Kuswandi et al., 2011). Timestrips® (Timestrip UK Limited, UK are smart labels for monitor how long a product has been open or how long it has been in use. The label is automatically activated when the consumer opens the packaging or it can be supplied as an external label that consumers can manually activate when they first use a product (Selman, 1995; Kuswandi et al., 2011). (eO)® TTI, is based on a time-temperature depended pH change caused by controlled microbial growth selected strains of lactic acid bacteria that is expressed to colour change
  • 3. through suitable pH indicators. Once they attached to the food, in case of temperature fluctuation, or when the product reaches its use by date, the temperature-dependent growth of the TTI microorganisms causes a pH drop in the tags leading to an irreversible color change of the indicator which becomes red (Ellouze et al., 2008; Taoukis, 2008). Although, lot of literature available on TTI based on various mechanisms, cost and complexity of the device makes it difficult for practical application. This work focuses on development of an economical, efficient and simple TTI, based on chemical reaction that can have large application in the market. Importance of the work: The role of temperature on the spoilage rate in foods, as it is for any chemical reaction, is well known. The temperature not only affects the rate of spoilage reactions, which involve both bacterial and autolytic enzymes, but it also affects the rate at which bacteria multiply. For example, generation time for Pseudomonas fragi, a common fish-spoilage bacterium, is about 12 hours at 32°F; it is only about 2 hours at 55°F (Duncan and Nickerson 1961). Storage temperature can also influence which type of disease develops. For example in potatoes the fungi that causes dry rot can grow rapidly at lower temperatures (15 -25°C) whereas the bacteria that cause the soft smelly rot, only grows rapidly at warmer temperatures (> 25°C).Thus, Storage temperature is very important to guarantee microbial quality and safety of perishable foods. Temperature fluctuation during storage and distribution of food will lead to spoilage of food and thus by reduction in shelf life and quality of the food product. Consumption of spoiled food product leads to various health hazardous like Stomach cramps, Fever, Headache, Nausea, Vomiting, Diarrhea and may also result in fatal end. So it is essential to understand and educate customers about the time temperature history of the food product. This can be achieved by attaching a TTI on the external surface of the food product, which will undergo colour change with varying temperature to which the food is being subjected.
  • 4. Objectives:  To develop a Time temperature indicator (TTI) that changes colour with respect to the change in temperature of food product, thus by understanding the temperature history of the food product for food safety.  To optimize TTI for few selected perishable food product.  To monitor the real shelf life of a perishable food product using TTI. Technical Program: Designing of TTI: TTI can be optimized into a label form that can be attached externally on the food product to monitor the time temperature history of the product. Label can be designed in such a way that it contains two compartments. These two compartments can be separated by a physical barrier to avoid contact between activator and the gel matrix. Removing physically the barrier between two compartments will results in activation of the TTI and helps to monitor the time temperature history of the food product to which it is being attached. TTI response: To identify the TTI response, storage experiments to be conducted at the same isothermal and non-isothermal conditions as those applied for the perishable food product. For six different temperature profiles the continuous colour change of the reaction window of TTIs will be measured instrumentally at regular time intervals using a colour measuring instrument until the end point colour will be reached. Change in colour of TTI:
  • 5. The change in colour of TTI will be measured using a colour analyzer. The L*, a*, b* chroma system, which uses the corresponding value of total color difference (∆E) as dynamic parameters, will be used to analyze the dynamic change in the indicator’s color. According to the indicator kinetics characterized by Taoukis and Labuza (1989), the total color difference value X = ∆E of the indicator could be expressed in terms of a response function as follows: F(X) = kt Where, k stands for the rate constant of the reaction that is correlated with temperature, and t stands for the storage time. By plotting a curve between the response function of total color difference F(X) and time, a straight line could be obtained, and the k of different storage temperatures could be calculated from the slope. Taking the logarithm on both sides of the Arrhenius function: lg k = lg A By plotting a curve between lg k and 1/T, a straight line will be obtained. The activation energy could be calculated from the slope, and A from the intercept directly. Storage Tests: The sets of TTI and food products will be stored at various temperatures using incubators. The samples will be periodically taken to measure the TTI response and food during regular intervals. All samples will be analysed in triplicates. Determination of microbiological quality: The growth of total aerobic bacteria and psychrotrophic bacteria in the selected food product will be measured at five constant temperatures: 2, 5, 7, 12, and 15°C. Samples will be drawn at predetermined intervals according to the storage temperature conditions. The lag times will be determined graphically and the growth rate constant will be calculated through linear of the exponential phase of the growth curve.
  • 6. Samples of food product will be aseptically weighed, added to 1/4 strength Ringer's solution, and will be homogenized in a stomacher for 60 seconds at room temperature. Decimal serial dilutions in quarter strength Ringer's solution will be prepared and duplicate 1 ml or 0.1 ml samples of appropriate dilutions will be poured or spread on the surface of the appropriate media in petri dishes for enumeration of Total viable count (TVC). All plates will be examined visually for typical colony types and morphological characteristics that were associated with each growth medium. Sensory Evaluation: The typical sensory analysis for selected food product will be followed during the storage experiments at different temperatures. The evaluation will be performed by a trained sensory panel (8–10 people) using QDA on 15 point scale (Stone, H. & Sidel, 1993). The sensory qualities will be judged under fluorescent light in a booth room with individual boxes, rating from 1 (excellent fresh) to 10 (extremely deteriorated). The cut-off score was fixed at 7.5. The sample will be considered as unacceptable when a mean score above five is reached. Calibration curves of TTI response vs. quality changes: TTI is an indicator to show the food quality changes during storage or distribution. So there should be a fixed relationship between TTI response and food qualities, otherwise TTI would not be a reliable indicator. The data points of TTI response could directly be correlated with those of the food qualities by eliminating the storage time, a common independent variable, from both relationships. The lines will be estimated by using the kinetic equations for TTI response and food product quality.
  • 7. Year-wise plan of work: First year: 1. Development of time temperature indicator using various pH indicators. 2. Optimization of the pH dyes for the development of TTI 3. Optimizing parameters of TTI for specific perishable food products. Second Year: 1. Designing of TTI into a label form 2. Application of the indicator with perishable food products and accessing their shelf life. Third Year: 1. Studies on relationship between the color change of TTI and quality characteristics of the food product. 2. Presentation of the work in conferences. 3. PhD thesis preparation
  • 8. References  Chen, J.H. & Zall, R.R., (1987). Packaged milk, cream and cottage cheese can be monitored for freshness using polymer indicator labels. Dairy Food Sanit. 7, 402–404.  Duncan, D. W., Jr. & J. T. R. Nickerson. (1961). Effect or environmental and physiological conditions on the exponential phase growlh or Pseudomonasfragi (ATCC 4973). In Proc. Low Temp. Microbiol. Symp., p. 253-262. Campbell Soup Co., Camden, N.J.  Ellouze, M., Pichaud, M., Bonaiti, C., Coroller, I., Couvert, O., Thuault, D. & Vaillant, R., (2008) Modelling pH evolution and lactic acid production in the growth medium of a lactic acid bacterium: application to set a biological TTI. International Journal of Food Microbiology, Vol. 128, p. 101–107. ISSN 0168-1605.  Fu, B., Petros, S., & Theodore, P. L. (1999). Predictive microbiology for monitoring spoilage of dairy products with time–temperature integrators. Journal of Food Science, 56 (5), 1209–1215.  Giannakourou, M.C. & Taoukis, P.S., (2002). Systematic application of time temperature integrators as tools for control of frozen vegetable quality. J. Food Sci. 67, 2221–2228.  Gregory, J.F., (1996). Vitamins. In: Fennema, O.R. (Ed.), Food Chemistry, 3rd ed. Marcel Dekker, New York, pp. 531–616.  Grisius, R.,Wells, J.H., Barrett, E.L. & Singh, R.P., (1987). Correlation of time temperature indicator response with microbial growth in pasteurized milk. J. Food Process. Preserv. 11, 309–324.  Kuswandi, B., Wicaksono, Y., Jayus; Abdullah, A., Lee yook heng & Ahmad, M., (2011): Smart packaging: sensors for monitoring of food quality and safety.  Labuza, T.P. & Fu, B., (1995). Use of time temperature integrators, predictive microbiology, and related technologies for assessing the extent and impact of temperature abuse on meat and poultry products. J. Food Safety 15, 201–217.  Management of Perishable Product Quality in the Cold Chain. In: Kerry, J. & Butler, P. (ed.), (2008): Smart Packaging Technologies for Fast Moving Consumer Goods. John Wiley&Sons, Ltd., 61–74. ISBN 978-0470028025.  Rice, J. (1989). Keeping time–temperature tabs on refrigerated foods. Food Process, 50(8), 149–158.
  • 9.  Rodriguez, N. & Zaritzki, N.E., (1983). Development of time temperature integrator indicator for frozen beef. J. Food Sci. 48, 1526–1531.  Selman, J. D., (1995): Time-temperature indicators. In Rooney, M. L. (ed.), 1995: Active food packaging. 1st edition, London, UK: Blackie Academic & Professional, pp. 215– 237, ISBN 978-0751401912.  Shellhammer, T.H. & Singh, R.P., (1991). Monitoring chemical and microbial changes of cottage cheese using a full history time–temperature indicator. J. Food Sci. 56, 402–405, 410.  Sherlock, M., Fu, B., & Taoukis, P. S. (1991). A system aticevaluation of time– temperature indicators for use as consumer labels. Journal of Food Protection, 54(11), 885–889.  Singh, R.P. & Wells, J.H., (1985). Use of time–temperature indicators to monitor quality of frozen hamburger. Food Technol. 39, 42–50.  Stone., H. & Sidel. (1993). Sensory evaluation practices. 2nd ed. Academic press, Inc. New York, NY.  Sun Yan., Cai Huawei., Zheng Limin., Ren Fazheng., Zhang Luda., & Zhang Hengtao., (2008). Development and characterization of a new amylase type time–temperature indicator, Food Control. 19:315–319  Taoukis, P. S., (2008). Application of Time– Temperature Integrators for Monitoring and Management of Perishable Product Quality in the Cold Chain. In: Kerry, J. and Butler, P. (ed.), 2008: Smart Packaging Technologies for Fast Moving Consumer Goods. John Wiley&Sons, Ltd., 61–74. ISBN 978-0470028025.  Taoukis, P.S., (2001). Modeling the use of time–temperature indicators in distribution and stock rotation. In: Tijkskens, L.M.M., Hertog, M.L.A.T.M., Nicolaï, B.M. (Eds.), Food Process Modeling. CRC Press, Washington, DC, pp. 402–432.  Taoukis, P.S., Koutsoumanis, K., & Nychas, G.J.E., (1999). Use of time–temperature integrators and predictive modelling for shelf life control of chilled fish under dynamic storage conditions. Int. J. Food Microbiol. 53, 21–31.  Tinker, J.H., Slavin, J.W., Learson, R.J., & Empola, V.G., (1985). Evaluation of automated time–temperature monitoring system in measuring the freshness of chilled fish. IIF-IIR Commissions C2, D3 4, 286– 290.  Y. Galagan, & Su W. F., (2008). Fadable ink for time–temperature control of food freshness: Novel new time–temperature indicator. Food Research International. 41: 653– 657
  • 10.  Yoon, S.H., Lee, C.H., Kim, D.Y., Kim, J.W., & Park, K.H., (1994). Time–temperature indicator using phospholipid–phospholipase system and application to storage of frozen pork. J. Food Sci. 59, 490–493.