This document summarizes the design and simulation of a vibration sensor based on optical fibers.
1) The sensor design uses a laser, polarizer, piezoelectric fiber stretcher, and analyzer to detect how vibrations change the polarization state of light traveling through an optical fiber.
2) A mathematical model shows the sensor output is non-linearly related to the excitation frequency due to higher-order terms.
3) The model indicates the amplitude of the 2fexc component provides the best opportunity to directly determine the amplitude of mechanical excitation.
![REPORT OF THE MULTIMEDIA PROJECT 2009, UMONS MA2, DECEMBER 2009 1
Vibration sensor based on optical fibre
Conception and simulation
Pierre Masure, Laurent-Yves Kalambayi
Abstract—This project concerns the development of a vibration the fiber at a given frequency. The purpose of our proposed
sensor based on the use of optical fibres, which will compensate solution will be to recover the excitation spectrum in the
for the limitations of sensors based on classical technologies. optical domain. In order to do this, we should try to have the
The approach considered concerns the realisation of a vibration
sensor based on the polarisation properties of optical fibres. The best similarity between the excitation and the optical domain
polarisation state of the observed light at the output of a fibre in an spectrum point of view: the recovery of the excitation
varies with the vibrations. In this context, it is proposed to design spectrum in frequency and in amplitude at the optical output
a simple sensor using out of the shelf equipment. The model has of the sytem should be obtained. The model of the Fiber
been implemented on Matlab. The practical testing of the model Stretcher used is the PZ2-PM-1.5-FC/APC-E operating at a
has also been included to this project. We can conclude that
the vibration sensor created provides the results we expected wavelength of 1550 nm with a fiber stretch of 3.8µm/V, the
theorically. We obtain similar results for the model implemented fiber length is 40 meters and the fiber wind is a 2-Layer wind.
on Matlab compared to the real device. These results prove that The fiber used in the stretcher is a polarisation maintaining
the sensor is operational. fiber which inhibits the polarisation mode coupling present in
Index Terms—optical, fibre, sensor, vibration. normal optical fibers.
I. I NTRODUCTION III. T HE SENSOR MODEL
T HIS project concerns the development of a vibration
sensor based on the use of optical fibres, which will
compensate for the limitations of sensors based on classical
To recover the excitation spectrum, we must create a system
which can provide us a way to recover this spectrum in the
optical domain.
technologies. Sensors based on optical fibres are insensitive
to electromagnetic perturbations, usable in harsh environ-
ment (flammable environment, high temperatures, corrosion
risks,...) and are appropriate for distributed measurements. The
approach considered concerns the realisation of a vibration
sensor based on the polarisation properties of optical fibres.
The polarisation state of the observed light at the output of a
fibre varies with the vibrations. In this context, it is proposed to
design a simple sensor using out of the shelf equipment. After
designing the system, the project will consist in simulating
his efficiency on Matlab. Beforehand, it will be necessary to
implement a fibre model taking into account the vibration
effects on the polarisation properties. An additionnal part,
which is the practical testing of the model, is included to this
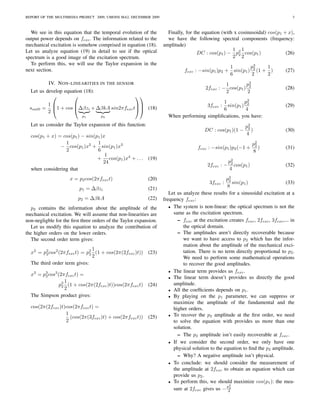
project. Fig. 1. Sensor model
II. T HE FIBER STRECTHER On Fig.1 we show the measurement tool we created to
The OPTIPHASE PZ2 High-efficiency Fiber Stretcher is a perform the given task, the vibration measurement. To perform
fiber wound piezo-electric element for use in a wide range the task, we need:
of optical interferometric measurement and sensing system • a laser
applications. Typical uses include open loop demodulation, • a polarizer
sensor simulation, white-light scanning interferometers and • the piezo-electric fiber stretcher
large angle modulation of interferometric phase. PZ2 Fiber • an analyzer
stretcher are available with SMF-28e+ or PM [PANDA] fiber • an oscilloscope+FFT
types. We will use the fiber stretcher as a device to simulate We suppose that a laser launches any polarisation state at
the vibration: the piezo-electric element which will stretch the input of the fiber. Therefore, we use a linear polarizer
in order to have a defined state of polarisation at the input of
M. Masure and Kalambayi are with the Department of Electrical Engineer-
ing, UMons, Belgium the piezo-electric fiber stretcher. The light travels through the
Manuscript received December 14, 2009; revised December 19, 2009. fiber winded up the piezo-electric element which stretches the](https://image.slidesharecdn.com/projetma2-12840789831543-phpapp02/85/Projet-Ma2-1-320.jpg)
![REPORT OF THE MULTIMEDIA PROJECT 2009, UMONS MA2, DECEMBER 2009 1
Vibration sensor based on optical fibre
Conception and simulation
Pierre Masure, Laurent-Yves Kalambayi
Abstract—This project concerns the development of a vibration the fiber at a given frequency. The purpose of our proposed
sensor based on the use of optical fibres, which will compensate solution will be to recover the excitation spectrum in the
for the limitations of sensors based on classical technologies. optical domain. In order to do this, we should try to have the
The approach considered concerns the realisation of a vibration
sensor based on the polarisation properties of optical fibres. The best similarity between the excitation and the optical domain
polarisation state of the observed light at the output of a fibre in an spectrum point of view: the recovery of the excitation
varies with the vibrations. In this context, it is proposed to design spectrum in frequency and in amplitude at the optical output
a simple sensor using out of the shelf equipment. The model has of the sytem should be obtained. The model of the Fiber
been implemented on Matlab. The practical testing of the model Stretcher used is the PZ2-PM-1.5-FC/APC-E operating at a
has also been included to this project. We can conclude that
the vibration sensor created provides the results we expected wavelength of 1550 nm with a fiber stretch of 3.8µm/V, the
theorically. We obtain similar results for the model implemented fiber length is 40 meters and the fiber wind is a 2-Layer wind.
on Matlab compared to the real device. These results prove that The fiber used in the stretcher is a polarisation maintaining
the sensor is operational. fiber which inhibits the polarisation mode coupling present in
Index Terms—optical, fibre, sensor, vibration. normal optical fibers.
I. I NTRODUCTION III. T HE SENSOR MODEL
T HIS project concerns the development of a vibration
sensor based on the use of optical fibres, which will
compensate for the limitations of sensors based on classical
To recover the excitation spectrum, we must create a system
which can provide us a way to recover this spectrum in the
optical domain.
technologies. Sensors based on optical fibres are insensitive
to electromagnetic perturbations, usable in harsh environ-
ment (flammable environment, high temperatures, corrosion
risks,...) and are appropriate for distributed measurements. The
approach considered concerns the realisation of a vibration
sensor based on the polarisation properties of optical fibres.
The polarisation state of the observed light at the output of a
fibre varies with the vibrations. In this context, it is proposed to
design a simple sensor using out of the shelf equipment. After
designing the system, the project will consist in simulating
his efficiency on Matlab. Beforehand, it will be necessary to
implement a fibre model taking into account the vibration
effects on the polarisation properties. An additionnal part,
which is the practical testing of the model, is included to this
project. Fig. 1. Sensor model
II. T HE FIBER STRECTHER On Fig.1 we show the measurement tool we created to
The OPTIPHASE PZ2 High-efficiency Fiber Stretcher is a perform the given task, the vibration measurement. To perform
fiber wound piezo-electric element for use in a wide range the task, we need:
of optical interferometric measurement and sensing system • a laser
applications. Typical uses include open loop demodulation, • a polarizer
sensor simulation, white-light scanning interferometers and • the piezo-electric fiber stretcher
large angle modulation of interferometric phase. PZ2 Fiber • an analyzer
stretcher are available with SMF-28e+ or PM [PANDA] fiber • an oscilloscope+FFT
types. We will use the fiber stretcher as a device to simulate We suppose that a laser launches any polarisation state at
the vibration: the piezo-electric element which will stretch the input of the fiber. Therefore, we use a linear polarizer
in order to have a defined state of polarisation at the input of
M. Masure and Kalambayi are with the Department of Electrical Engineer-
ing, UMons, Belgium the piezo-electric fiber stretcher. The light travels through the
Manuscript received December 14, 2009; revised December 19, 2009. fiber winded up the piezo-electric element which stretches the](https://image.slidesharecdn.com/projetma2-12840789831543-phpapp02/75/Projet-Ma2-1-2048.jpg)
![REPORT OF THE MULTIMEDIA PROJECT 2009, UMONS MA2, DECEMBER 2009 2
fiber with an elongation driven by the signal provided by the of the stretcher and q is the azimuth of the fastest linear
generator. The elongation has for effect to modifies the light polarization.
polarisation state. After the piezo-electric fiber stretcher, we z = zi + kxexc (5)
put a polariser which is used to analyze the light coming from
where z is the full length of the fiber in the fiber stretcher, zi
the stretcher. This particular polariser is denoted by the term
the initial length of the fiber (40m), kxexc the elongation of
’analyzer’.
the fiber due to the mechanical excitation, k the coefficient
The physical idea behind this construction is that the power
describing the linear stretch of the fiber with the voltage
of the light will have an initial value if there is no stretch.
(3.8µm/V), xexc the excitation signal of the piezo-electric
When we induce a stretch to the fiber, the light polarisation
element in Volt.
state of the light will be modifiedin time. As a consequence,
We make a simplification and suppose that q = 0 (x and y
the power transmitted by the analyzer will vary in time.
axes aligned with the eigenmodes of the PMF-fiber):
Physically, we feel that we could recover some spectrum
information in the optical domain. Let us put some math-
1 0 0 0
ematics behind this to prove that our system works. The 0 1 0 0
formalism used to analyze this system is the Stokes formalism. Ms = 0 0 cos(δ) cos(δ)
(6)
The Stokes formalism describes the polarisation state of the 0 0 −sin(δ) cos(δ)
light through a 4-dimensional real vector. Let us analyze our
vibration tool mathematically: sint = Ms s (7)
The polarisation state launched by the laser is random.
At the output of the fiber stretcher, we obtain:
We use a polariser to modify that random polarisation state
to obtain a well-defined polarisation state: T
sint = 1 0 cos(δ) −sin(δ) (8)
T
sin = 1 cos(2φ) sin(2φ) 0 (1) The analyzer can be described by an 4x4 Mueler matrix:
with φ corresponding to the polarisation angle with respect
to the x-Axis. Let us assume that φ=45 ˚ : 1 cos(2θ) sin(2θ) 0
1 cos(2θ) cos(2θ)2 sin(2θ)cos(2θ) 0
T Ma =
sin = 1 0 1 0 (2) 2 sin(2θ) sin(2θ)cos(2θ) sin(2θ)2 0
0 0 0 0
We describe the piezo-electric fiber stretcher with the fol- (9)
lowing 4x4 Mueller matrix: If we consider that θ=45 ˚ :
m11 m12 m13 m14 1 0 1 0
m21 m22 m23 m24 1 0 0 0 0
Ms = (3) Ma = (10)
m31 m32 m33 m34 2 1 0 1 0
m41 m42 m43 m44 0 0 0 0
sout = Ma sint (11)
m11 = 1, m12 = 0, m13 = 0
m14 = 0, m21 = 0, m31 = 0, m41 = 0 1 T
sout = 1 + cos(δ) 0 1 + cos(δ) 0 (12)
δ δ 2
m22 = cos2 + sin2 cos4q
2 2
δ 1 T
m23 = sin2 sin4q sout = 1 + cos(∆βz) 0 1 + cos(∆βz) 0 (13)
2 2
m24 = −sinδsin2q The global power at the output is given by the first element
δ of sout :
m32 = sin2 sin4q 1
2 sout0 = (1 + cos(∆βz)) (14)
δ δ 2
m33 = cos2 − sin2 cos4q
2 2 ∆β is constant with the stretch because we are working with
m34 = sinδcos2q a PMF-fiber. This has been proven in the reference [1][2].
m42 = sinδsin2q 1
sout0 = (1 + cos(∆β(zi + kxexc )) (15)
m43 = −sinδcos2q 2
m44 = cosδ Let us suppose that the excitation is sinusoidal:
xexc = Asin(2πfexc t) (16)
δ = ∆βz (4)
where ∆β is the fiber birefringence and δ is the phase 1
retardance between the two eigenmodes of the PMF-fiber sout0 = (1 + cos (∆β (zi + kAsin(2πfexc t)))) (17)
2](https://image.slidesharecdn.com/projetma2-12840789831543-phpapp02/85/Projet-Ma2-2-320.jpg)
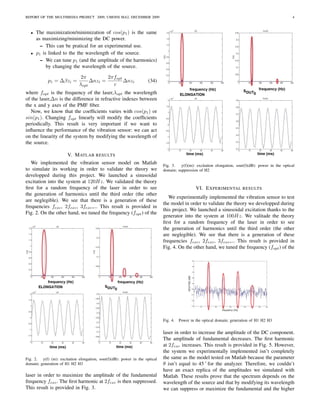
![REPORT OF THE MULTIMEDIA PROJECT 2009, UMONS MA2, DECEMBER 2009 5
orders.
Fig. 5. Power in the optical domain; maximization of H2
VII. P ERSPECTIVES
We don’t have the exact experimental replica of the model
implemented on Matlab. Therefore, we could modify our
model implemented on Matlab and generalize it with a variable
θ angle. When we will be able to have the exact replica of the
model implemented on Matlab on the experimental way, we
will have the possibility to compare the amplitudes obtained
experimentally with the simulated results.
VIII. C ONCLUSION
This project concerned the development of a vibration sen-
sor based on the use of optical fibres. The approach considered
concerned the realisation of a vibration sensor based on the
polarisation properties of optical fibres. The polarisation state
of the observed light at the output of a fibre varies with the
vibrations. After designing the system, the project consisted
in simulating his efficiency on Matlab. The practical testing
of the model has also been included to this project.
We can conclude that the vibration sensor created provides
the results we expected theorically. We obtain coherent results
between the model implemented and the real device. These
results prove that the sensor is operational.
ACKNOWLEDGMENT
The authors would like to thank the professor Marc Wuilpart
for his teaching method.
R EFERENCES
[1] C. Crunelle, M. wuilpart, P. Mgret,Sensitivity of Polarization Main-
taining Fibres to Temperature and Strain for Sensing Applications, pp.
205 to 208, in Proc. IEEE/LEOS Benelux Chapter 2006, Eindhoven, The
Netherlands,
[2] N. Ashby, D. A. Howe, J. Taylor, A. Hati, C. Nelson [National Institute
of Standards and Technology],Optical Fiber Vibration and Acceleration
Model, pp. 1 to 5.](https://image.slidesharecdn.com/projetma2-12840789831543-phpapp02/85/Projet-Ma2-5-320.jpg)


