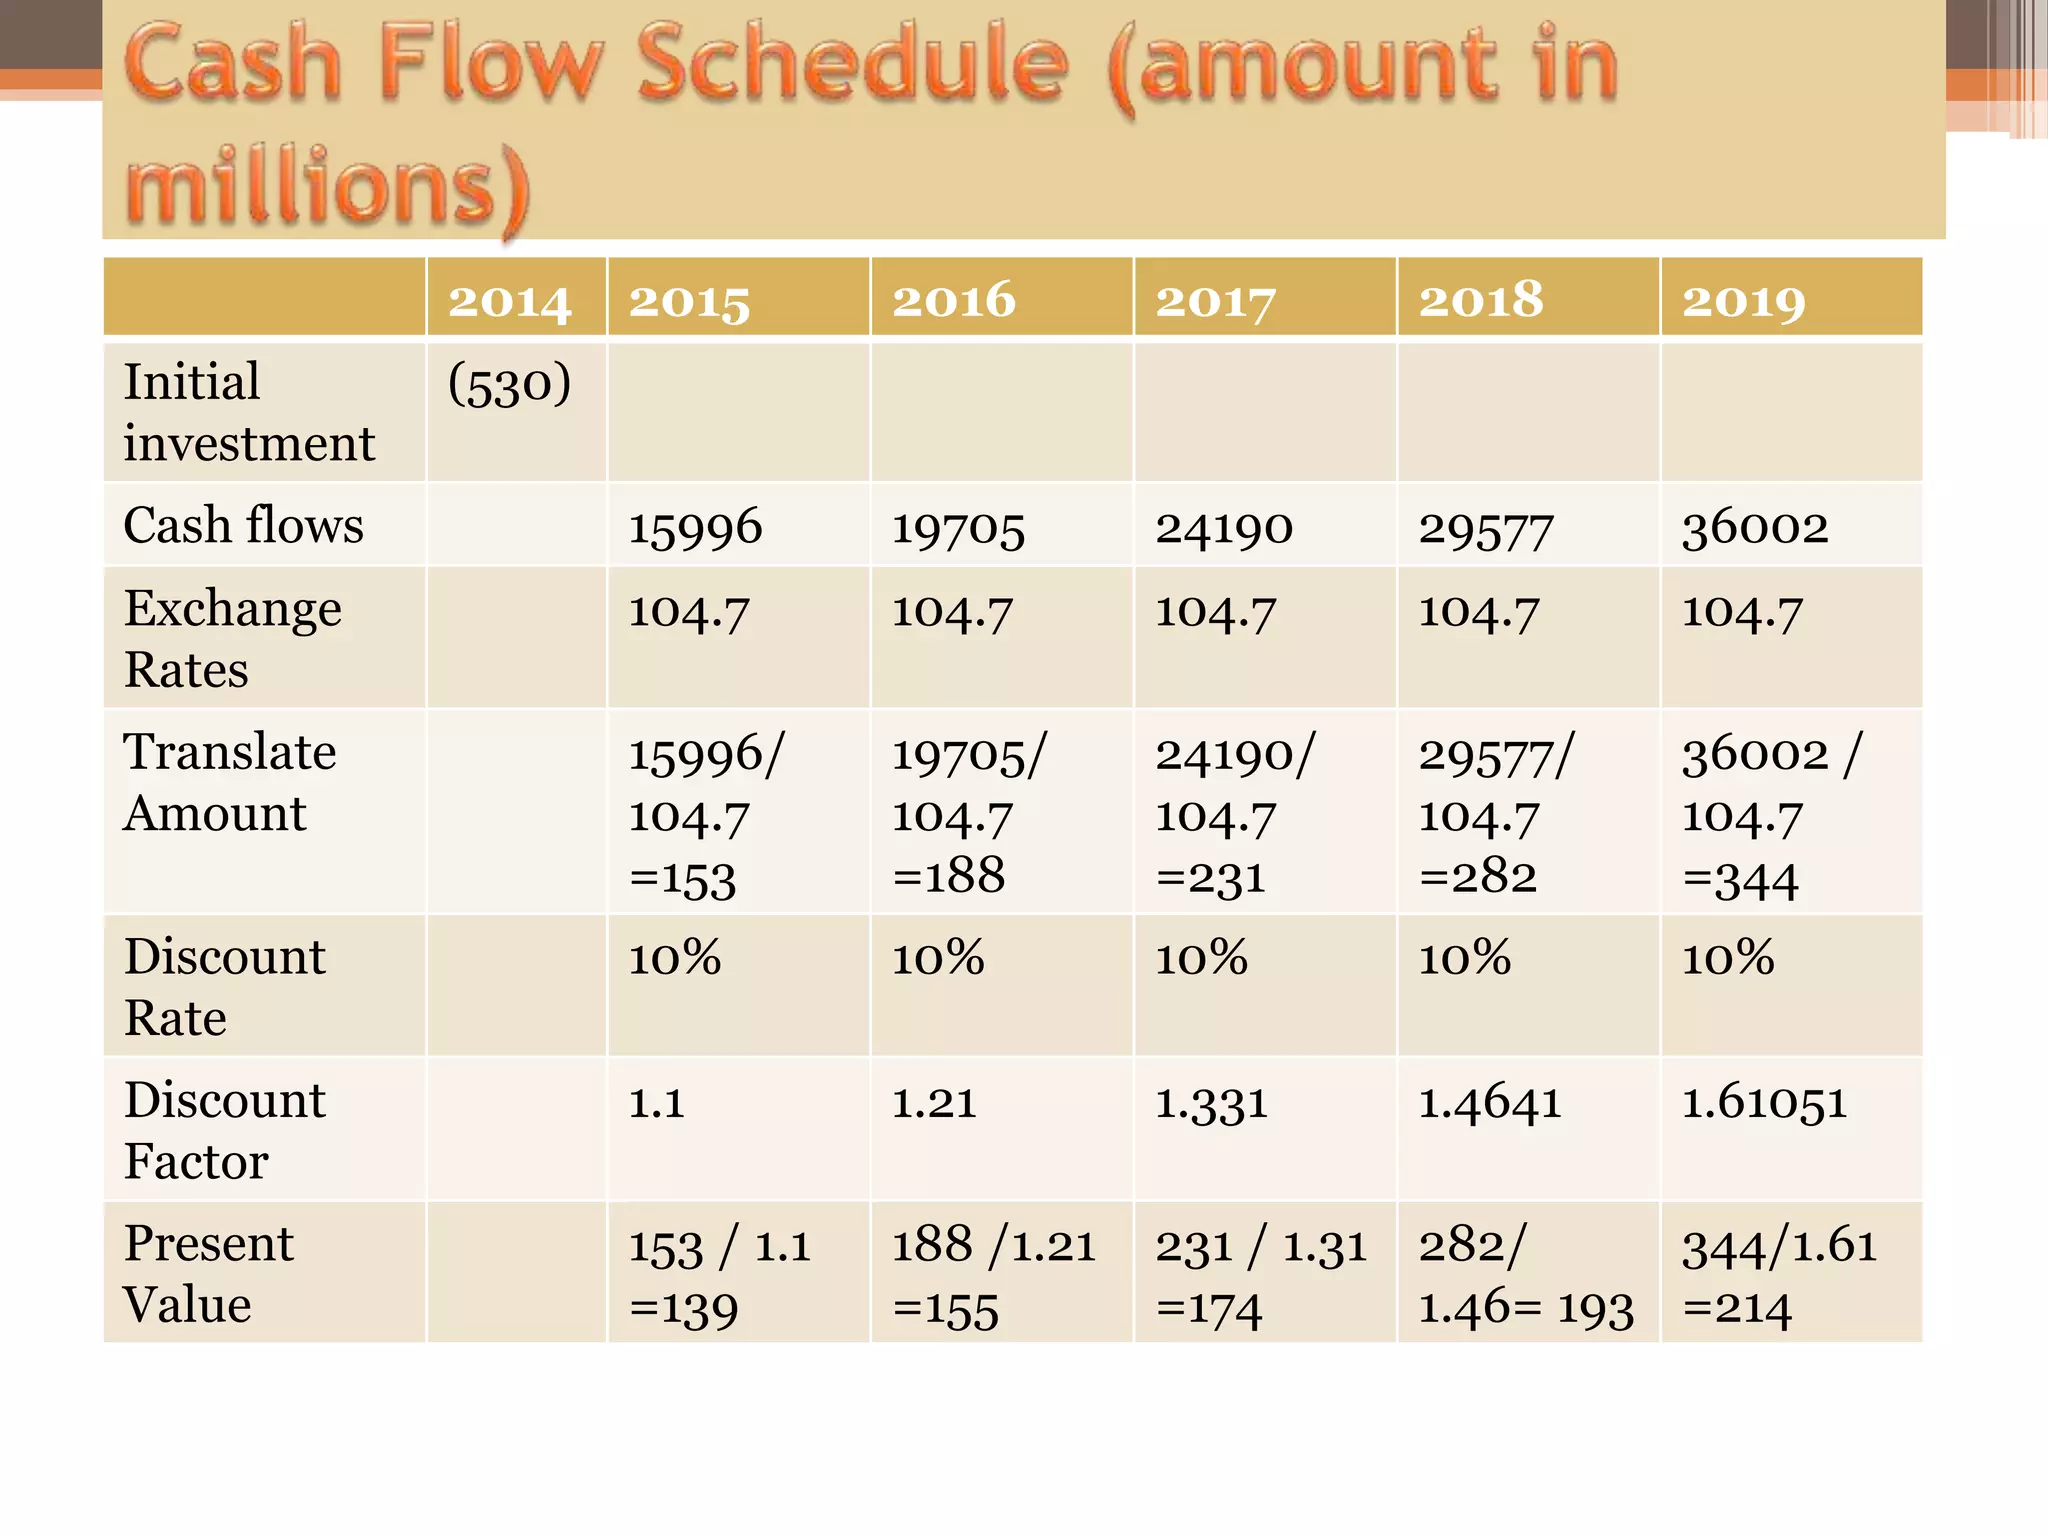
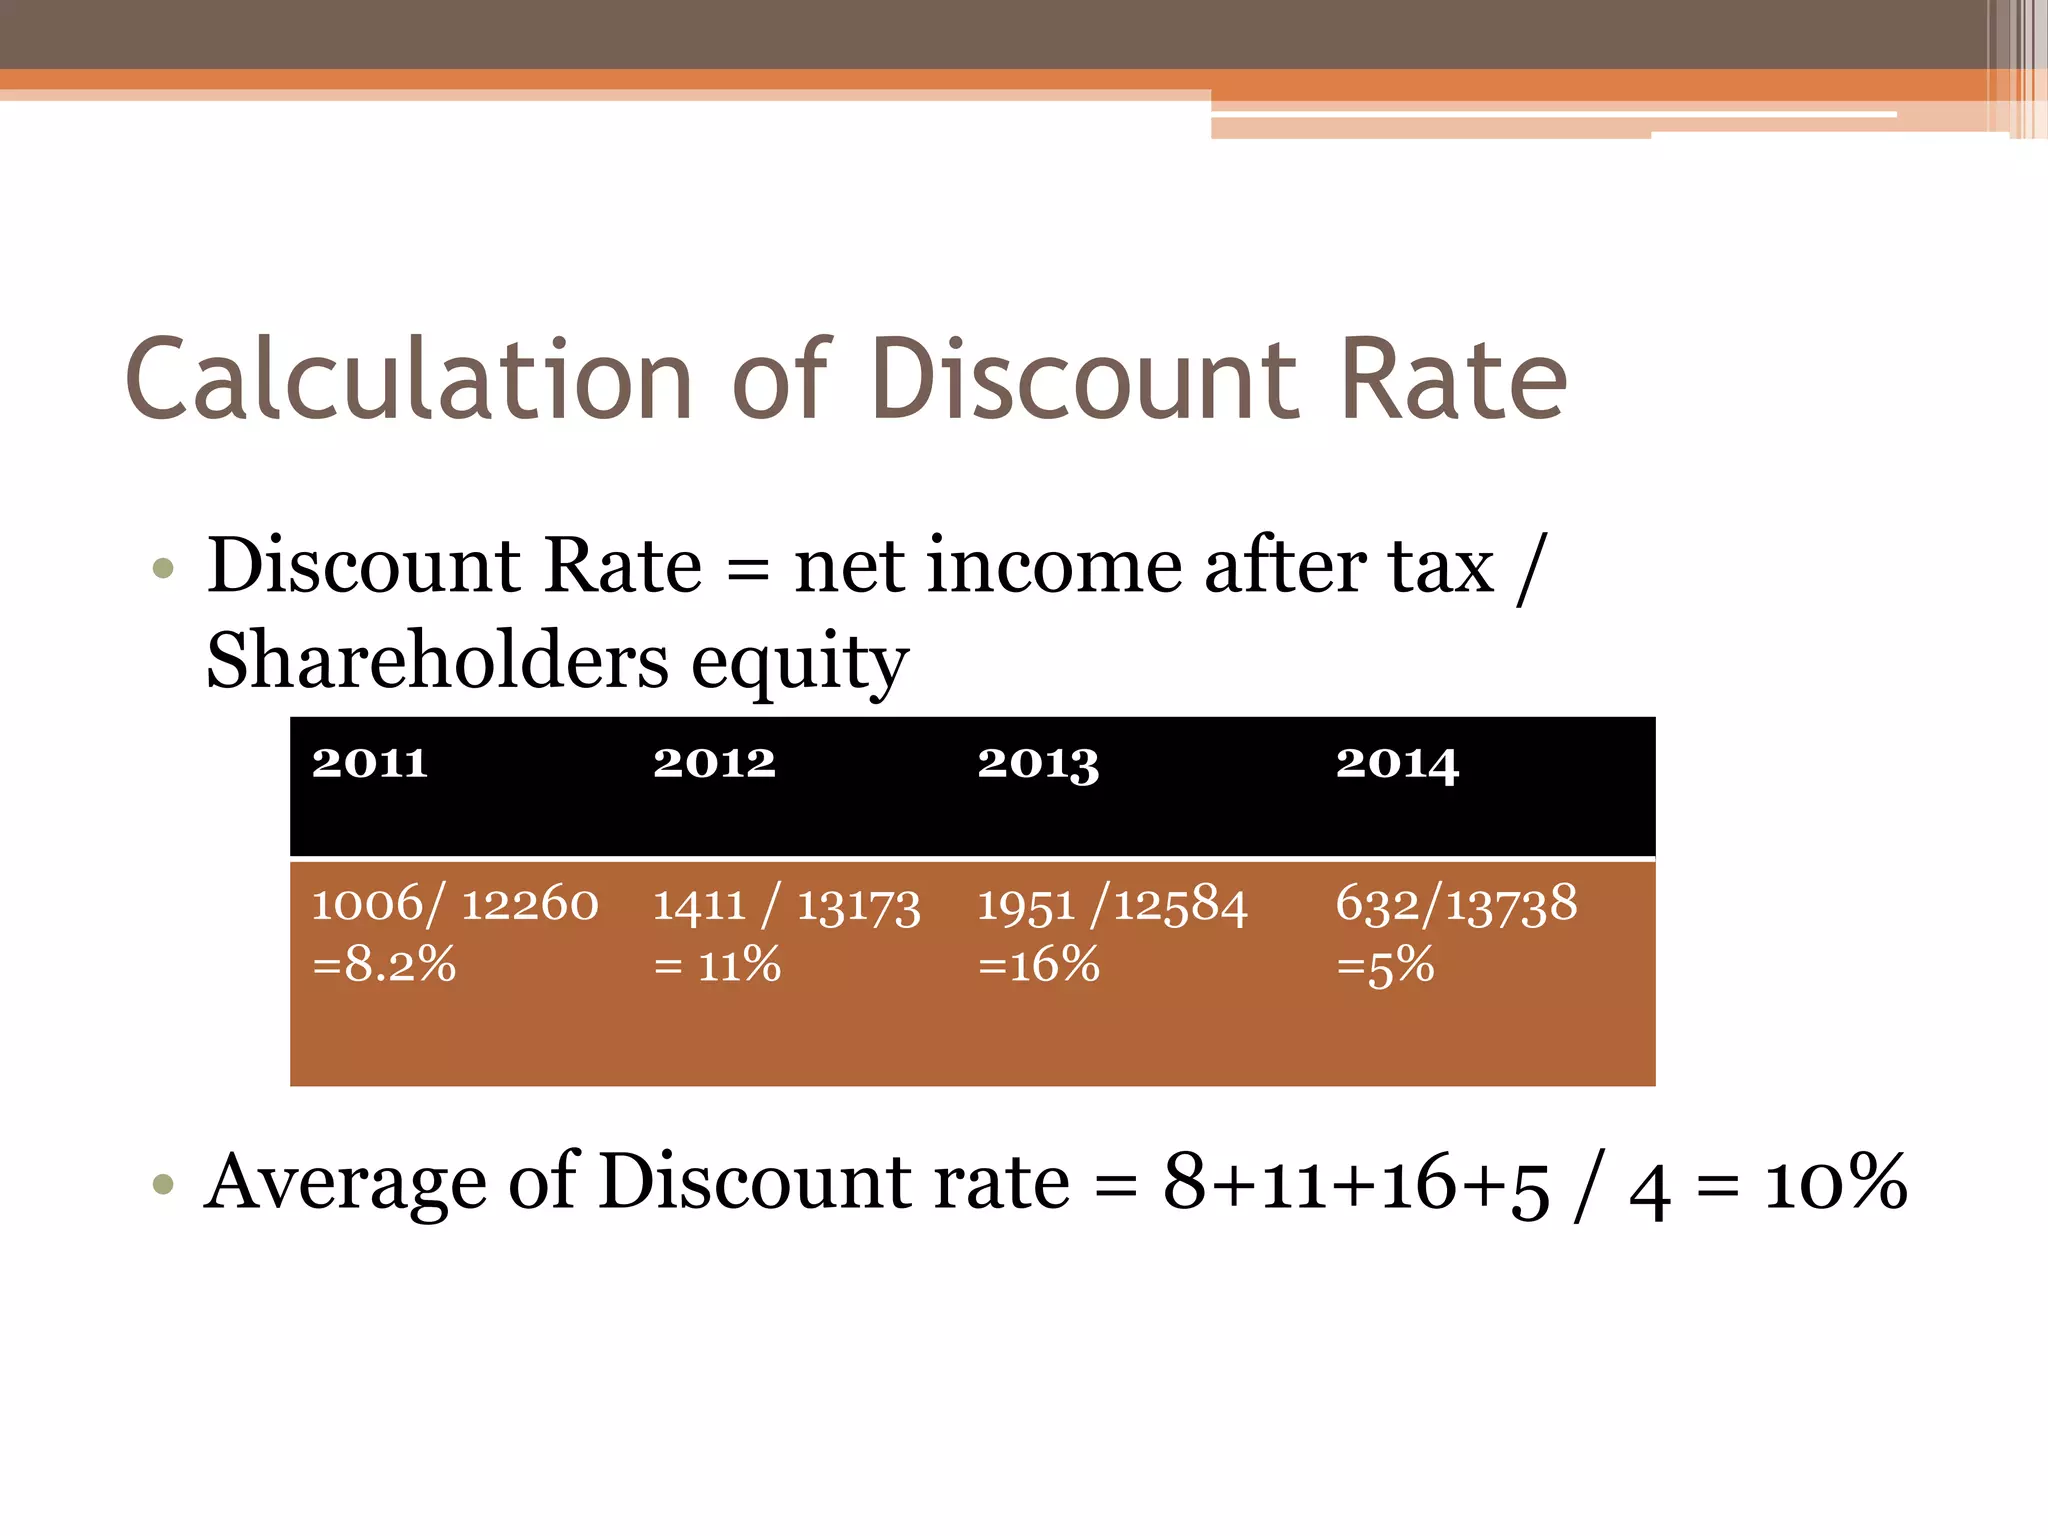
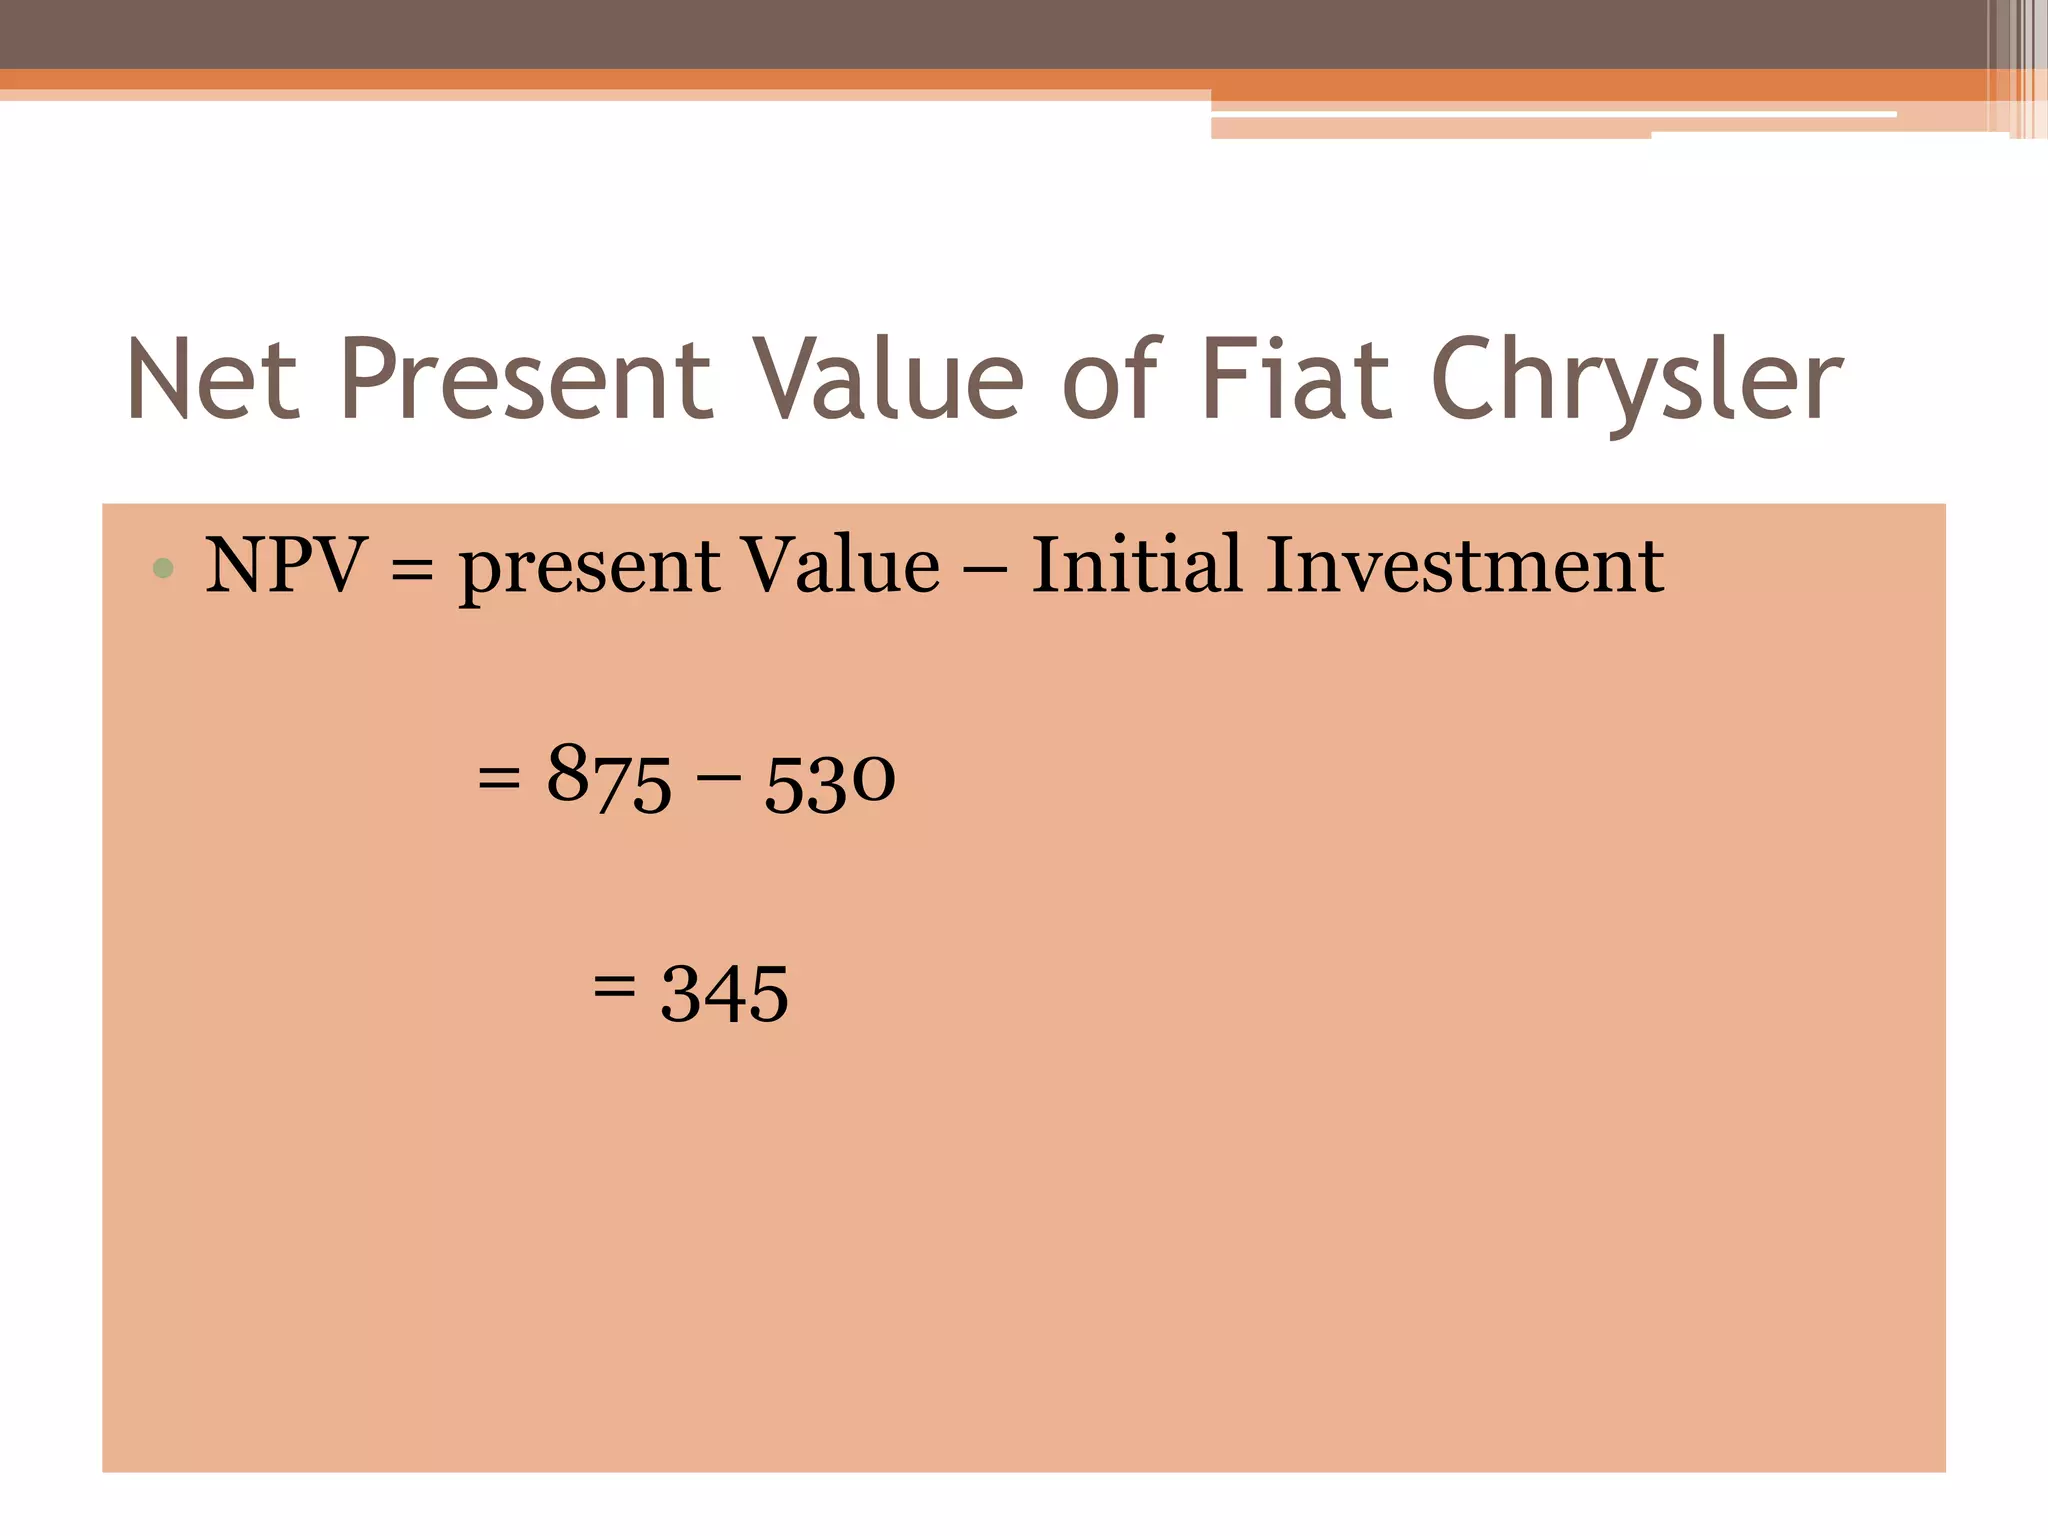
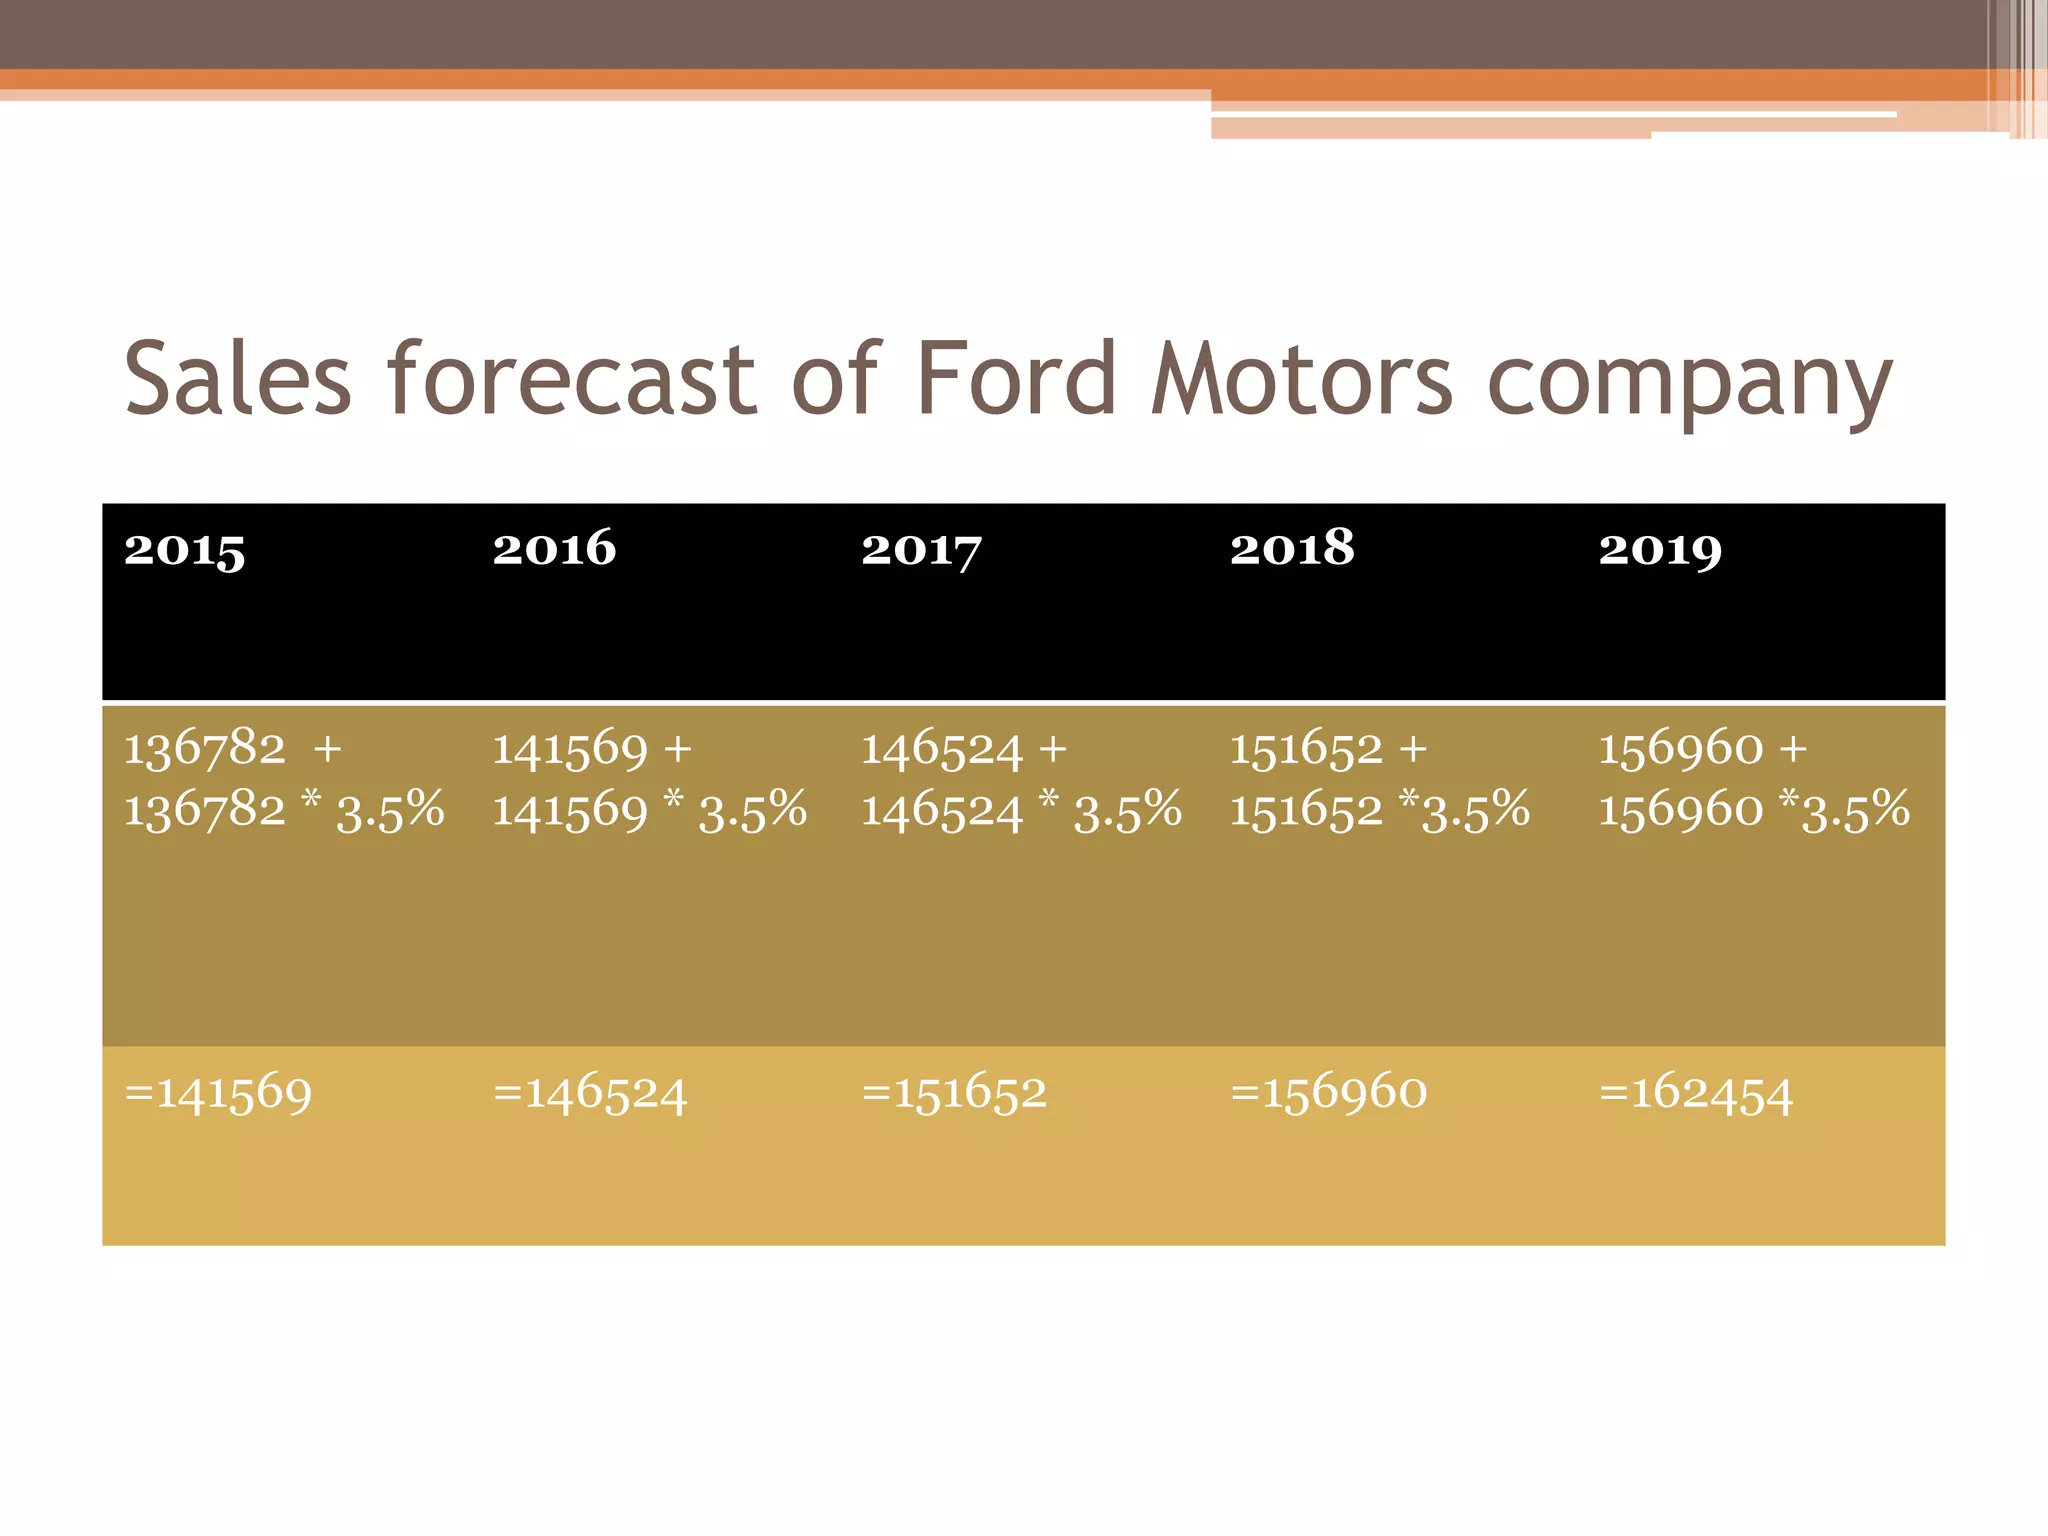
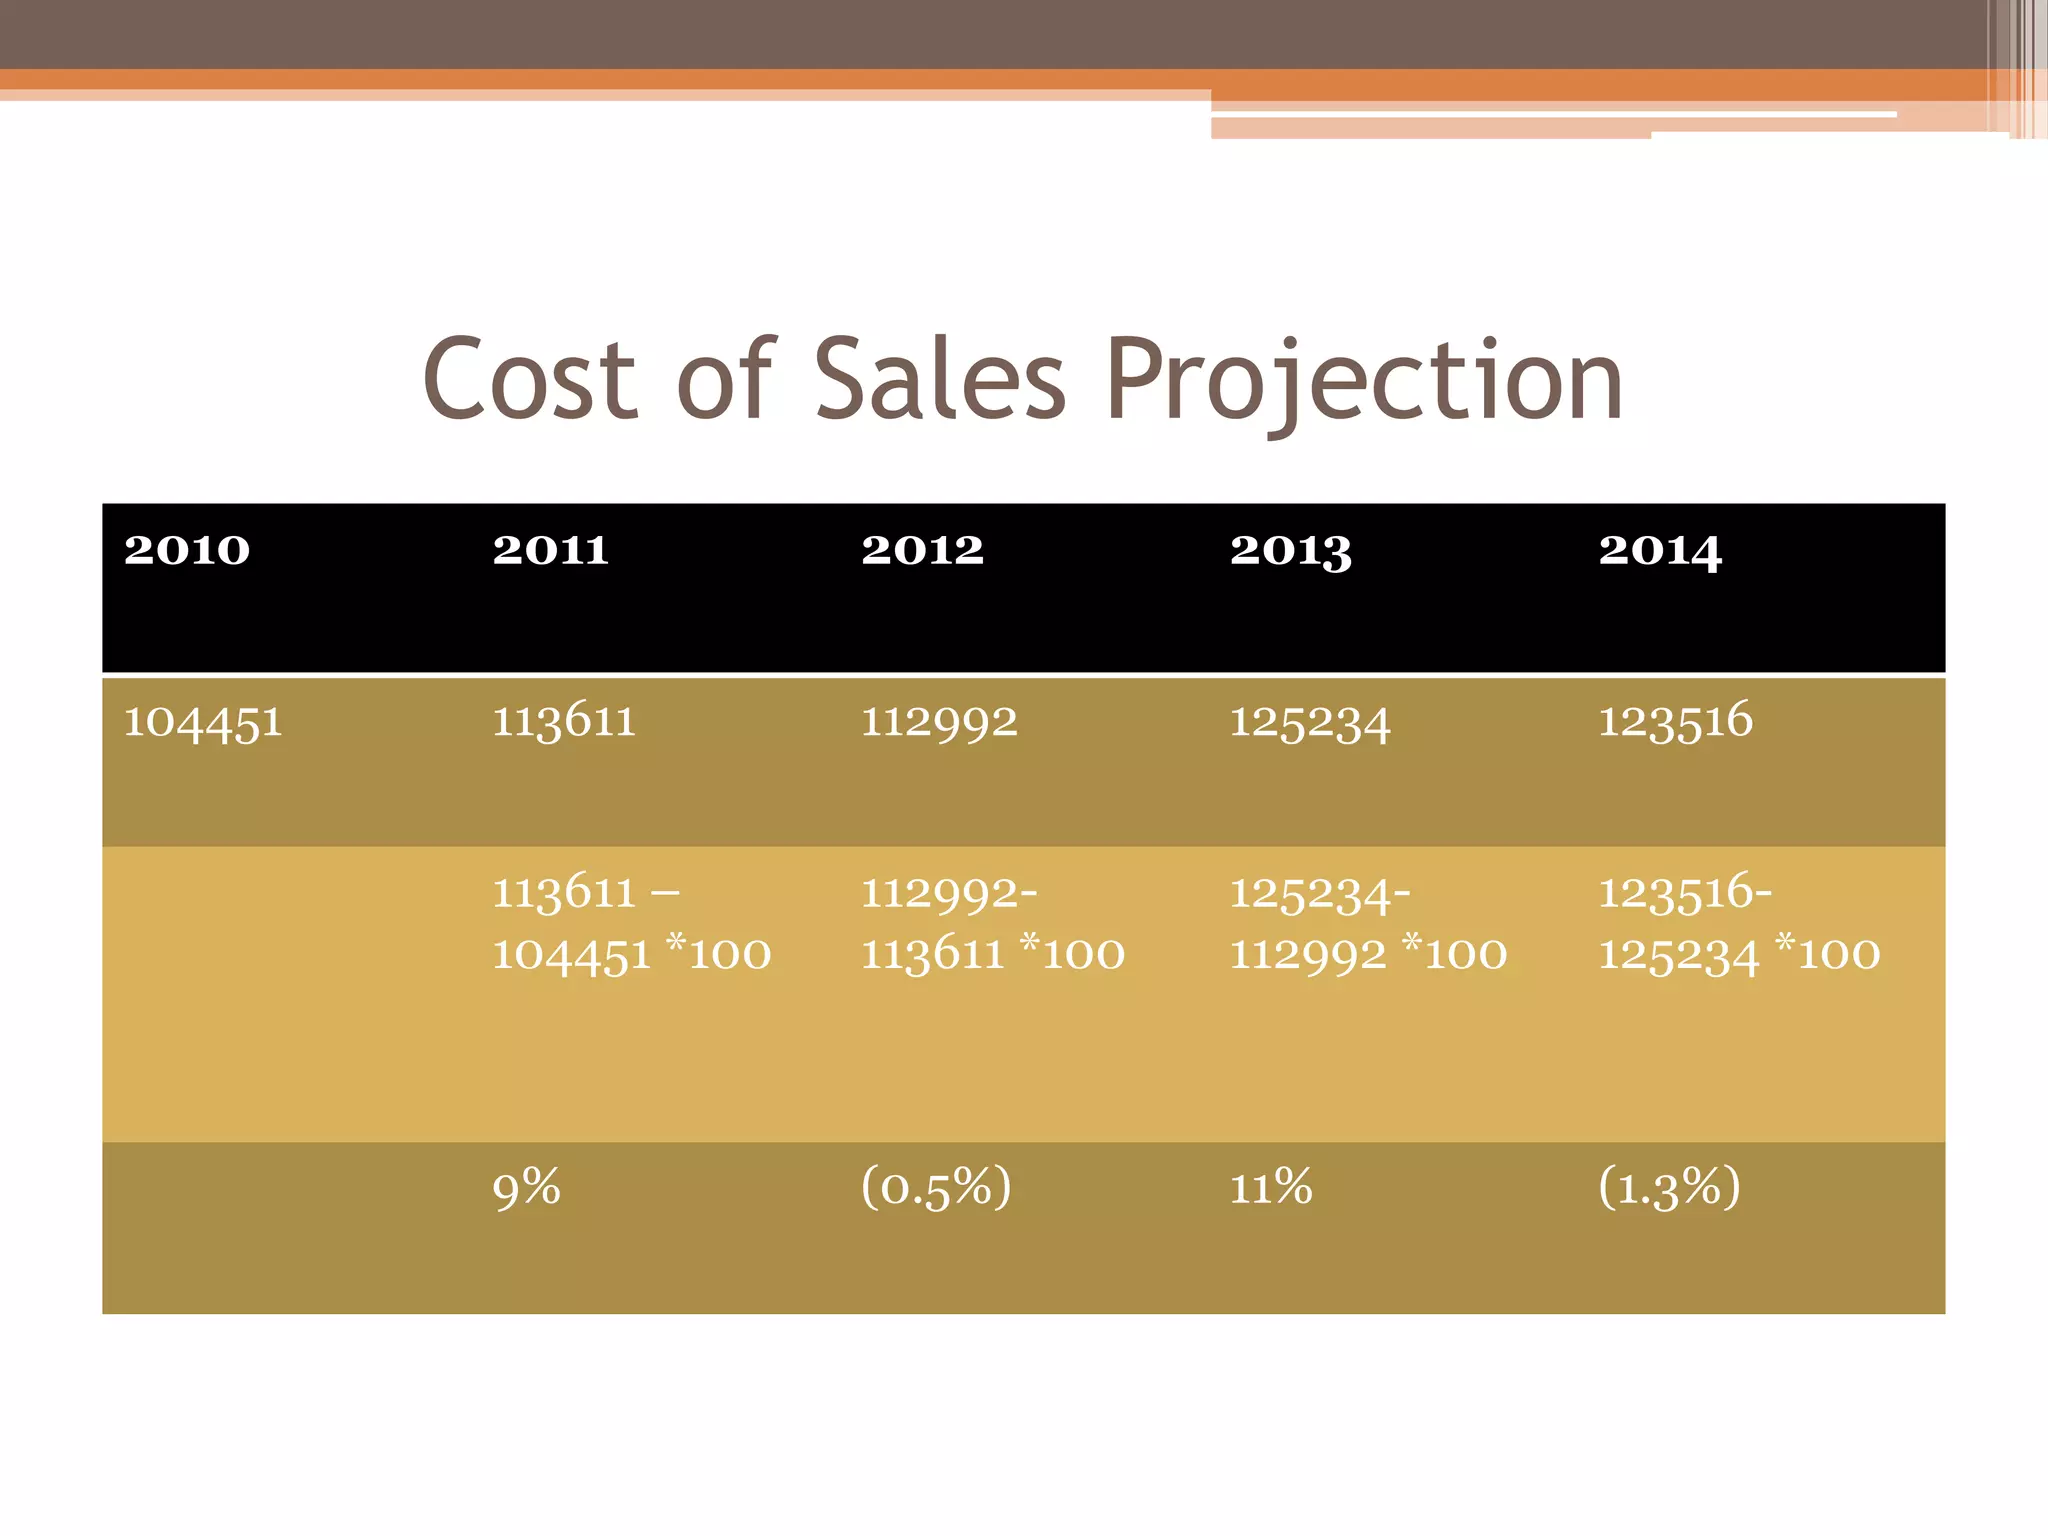
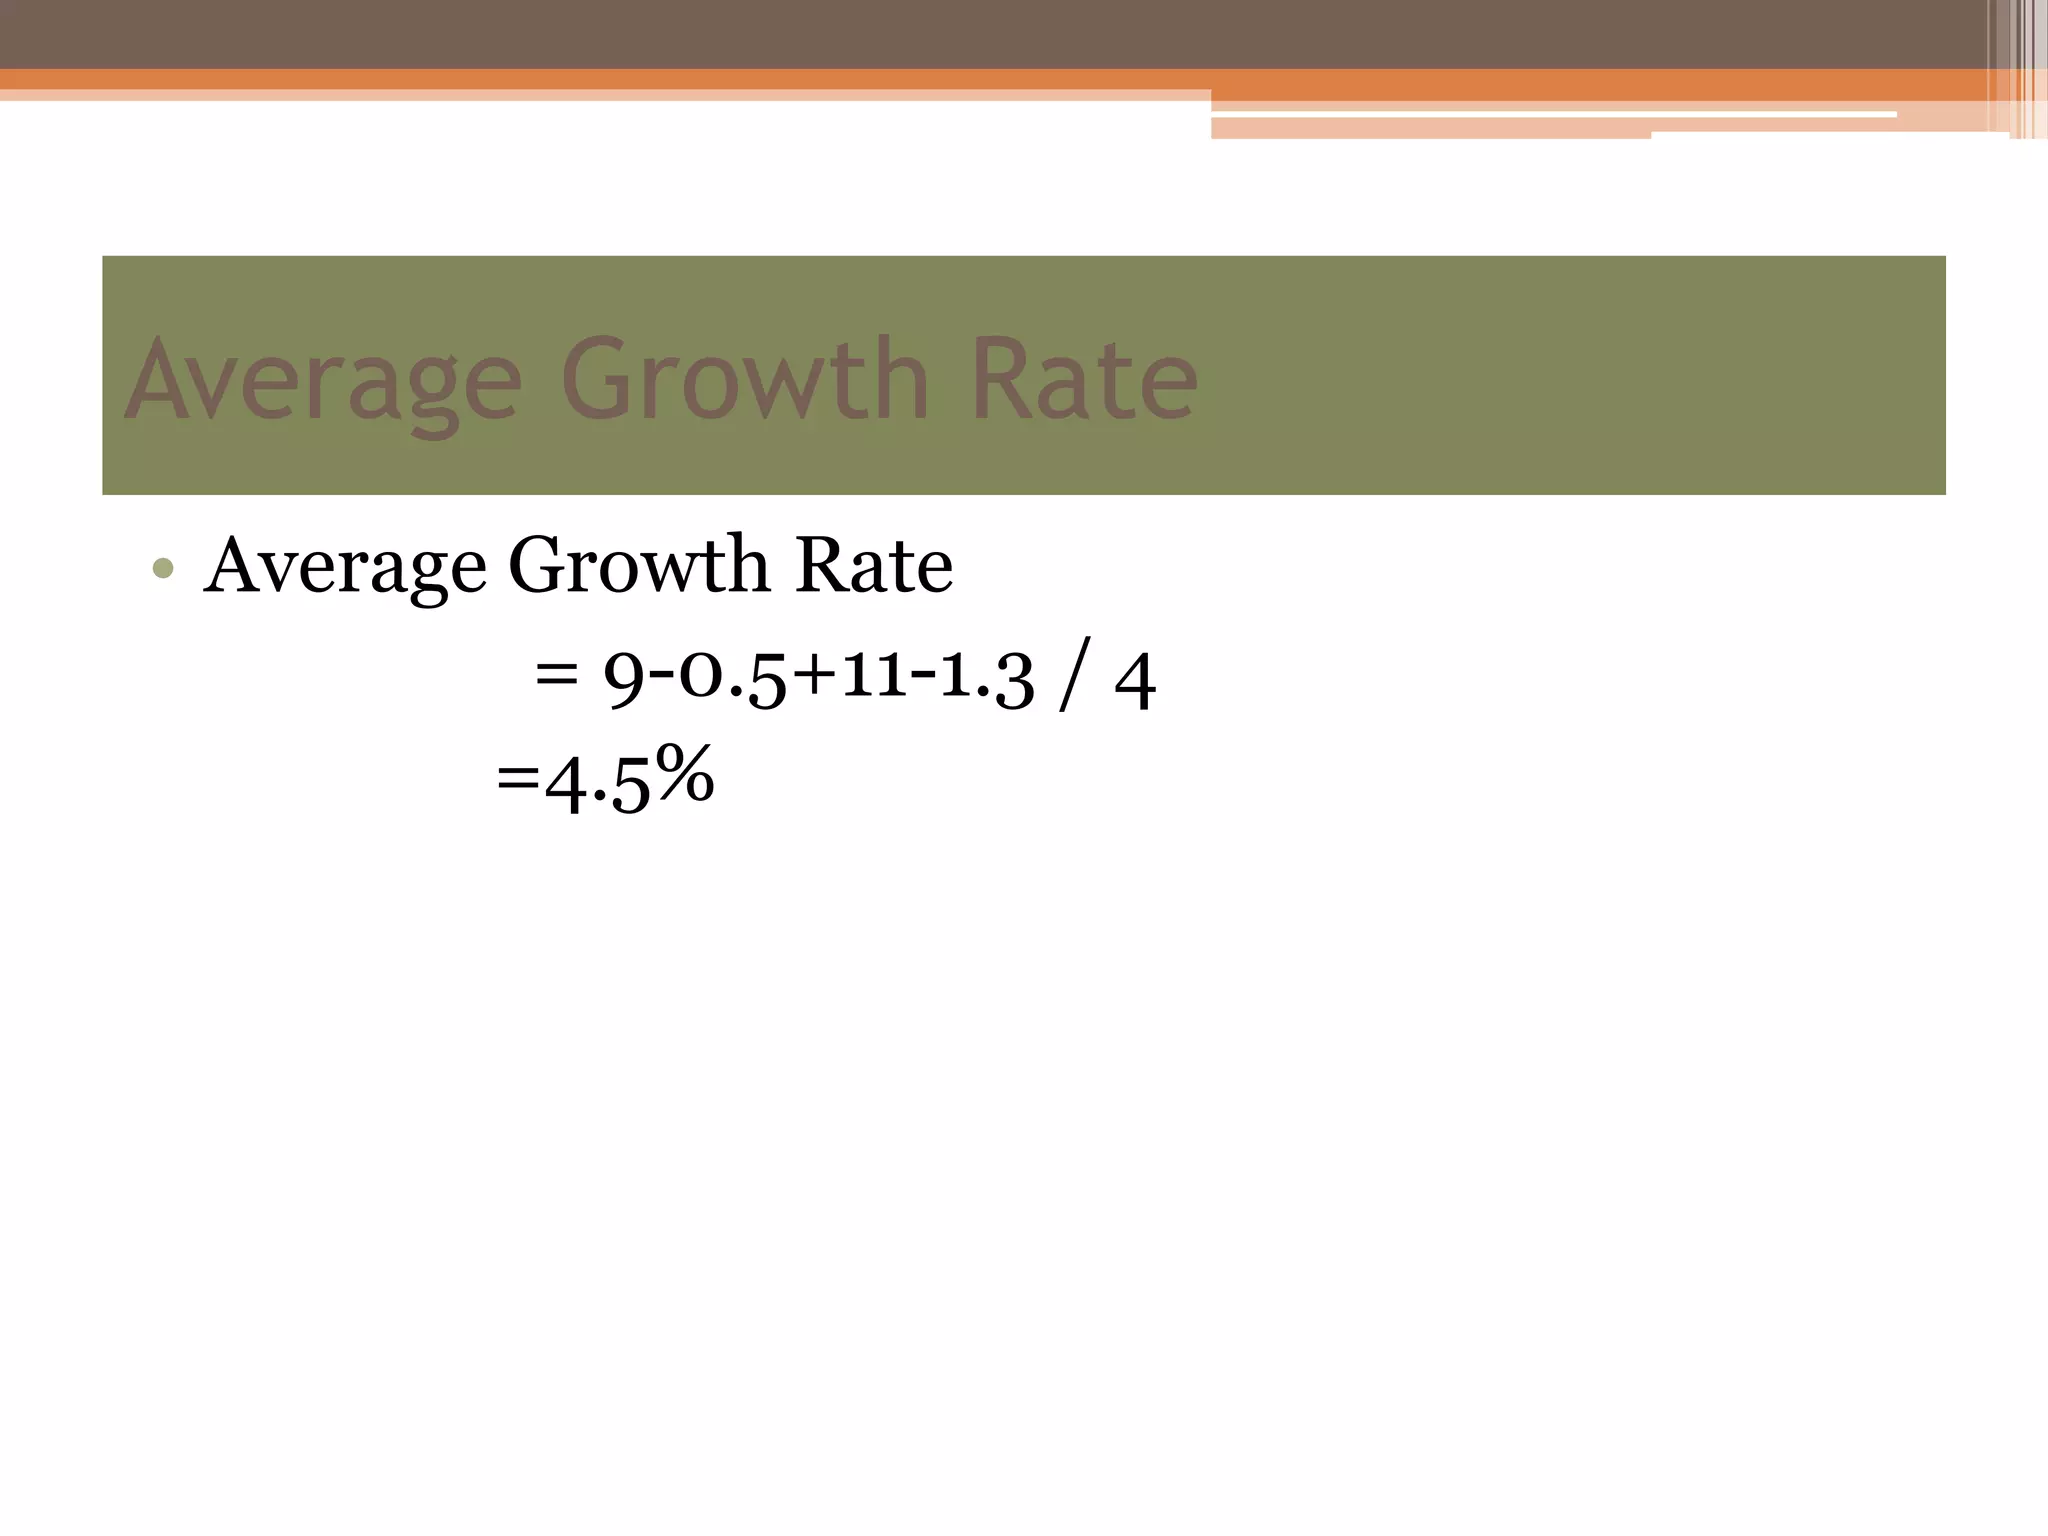
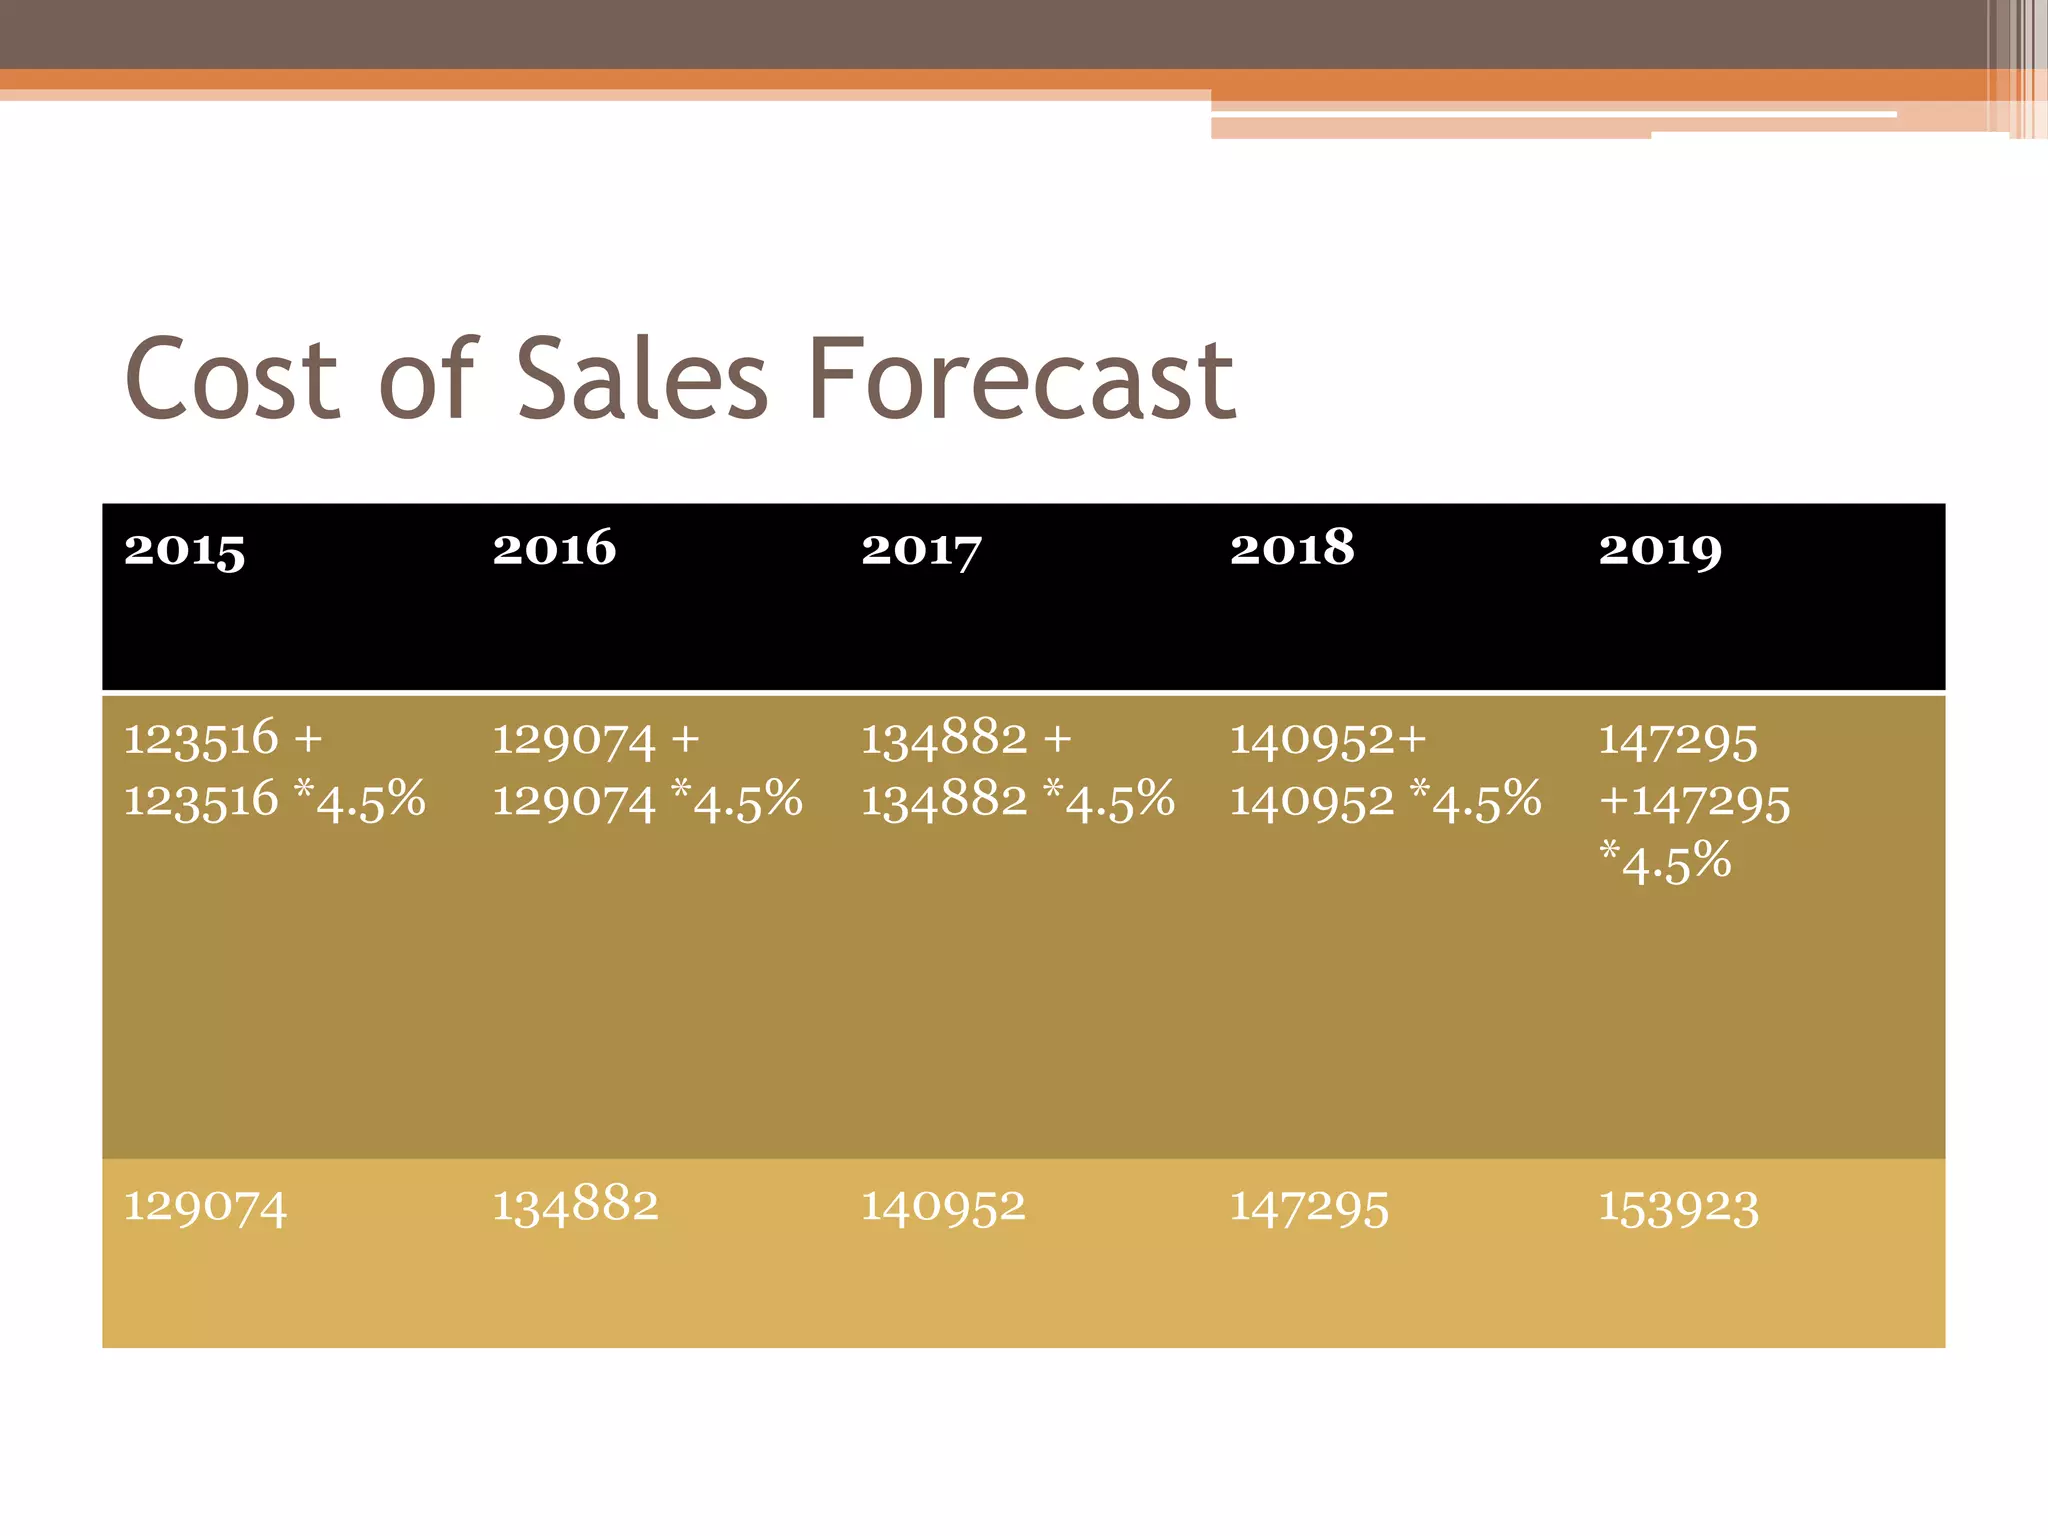
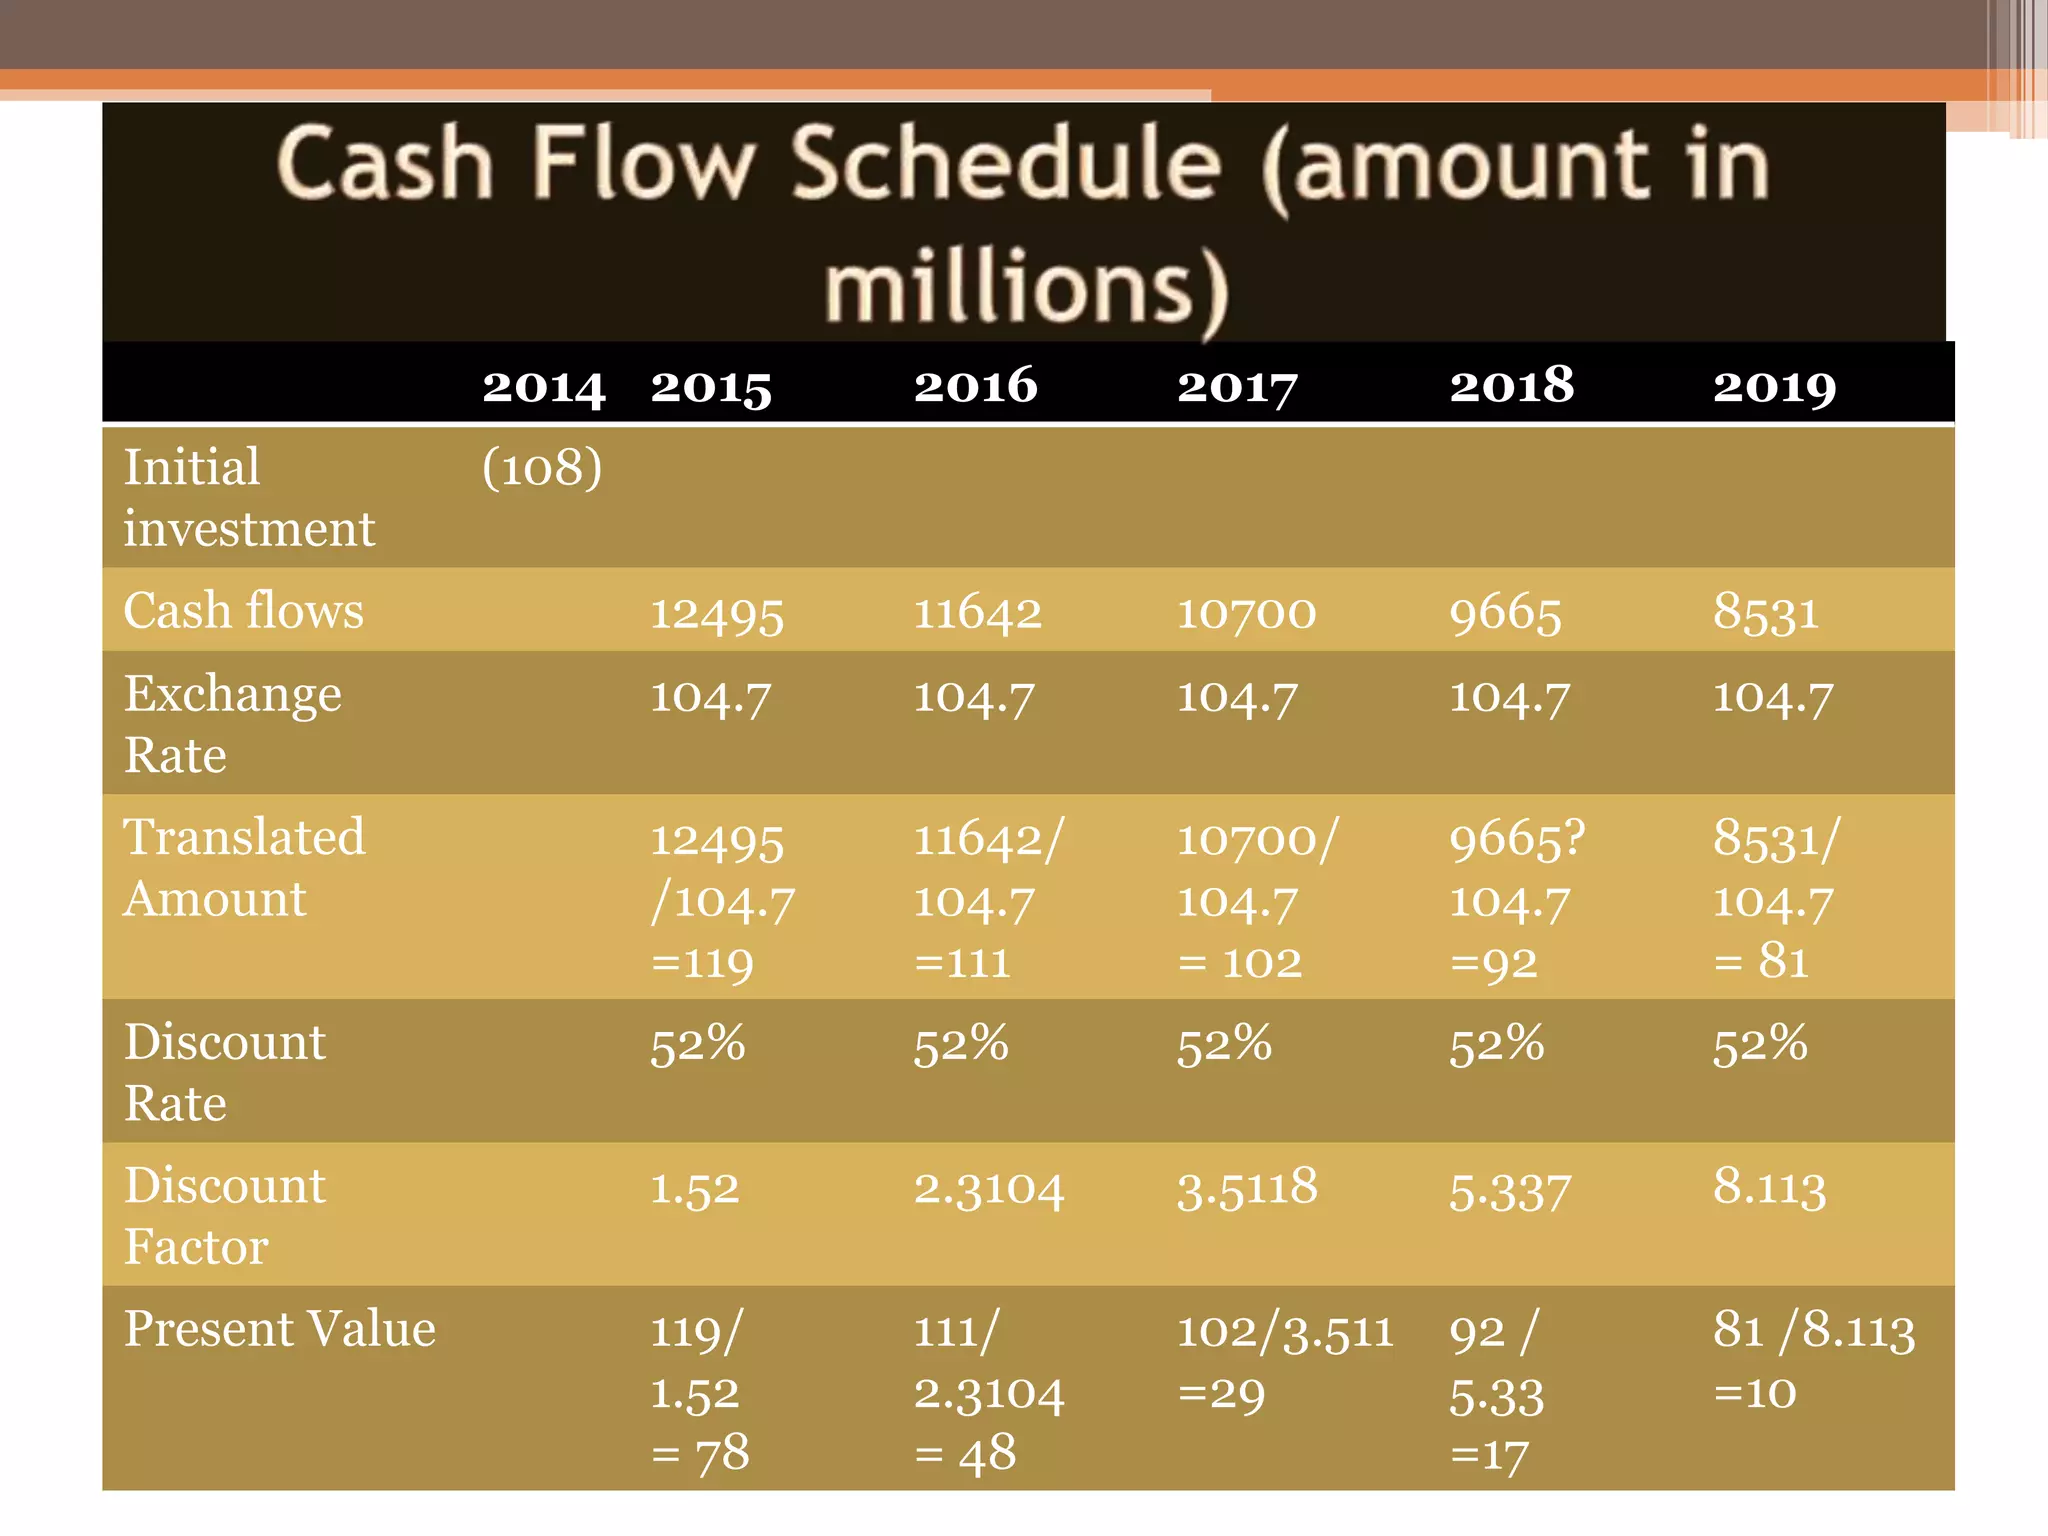
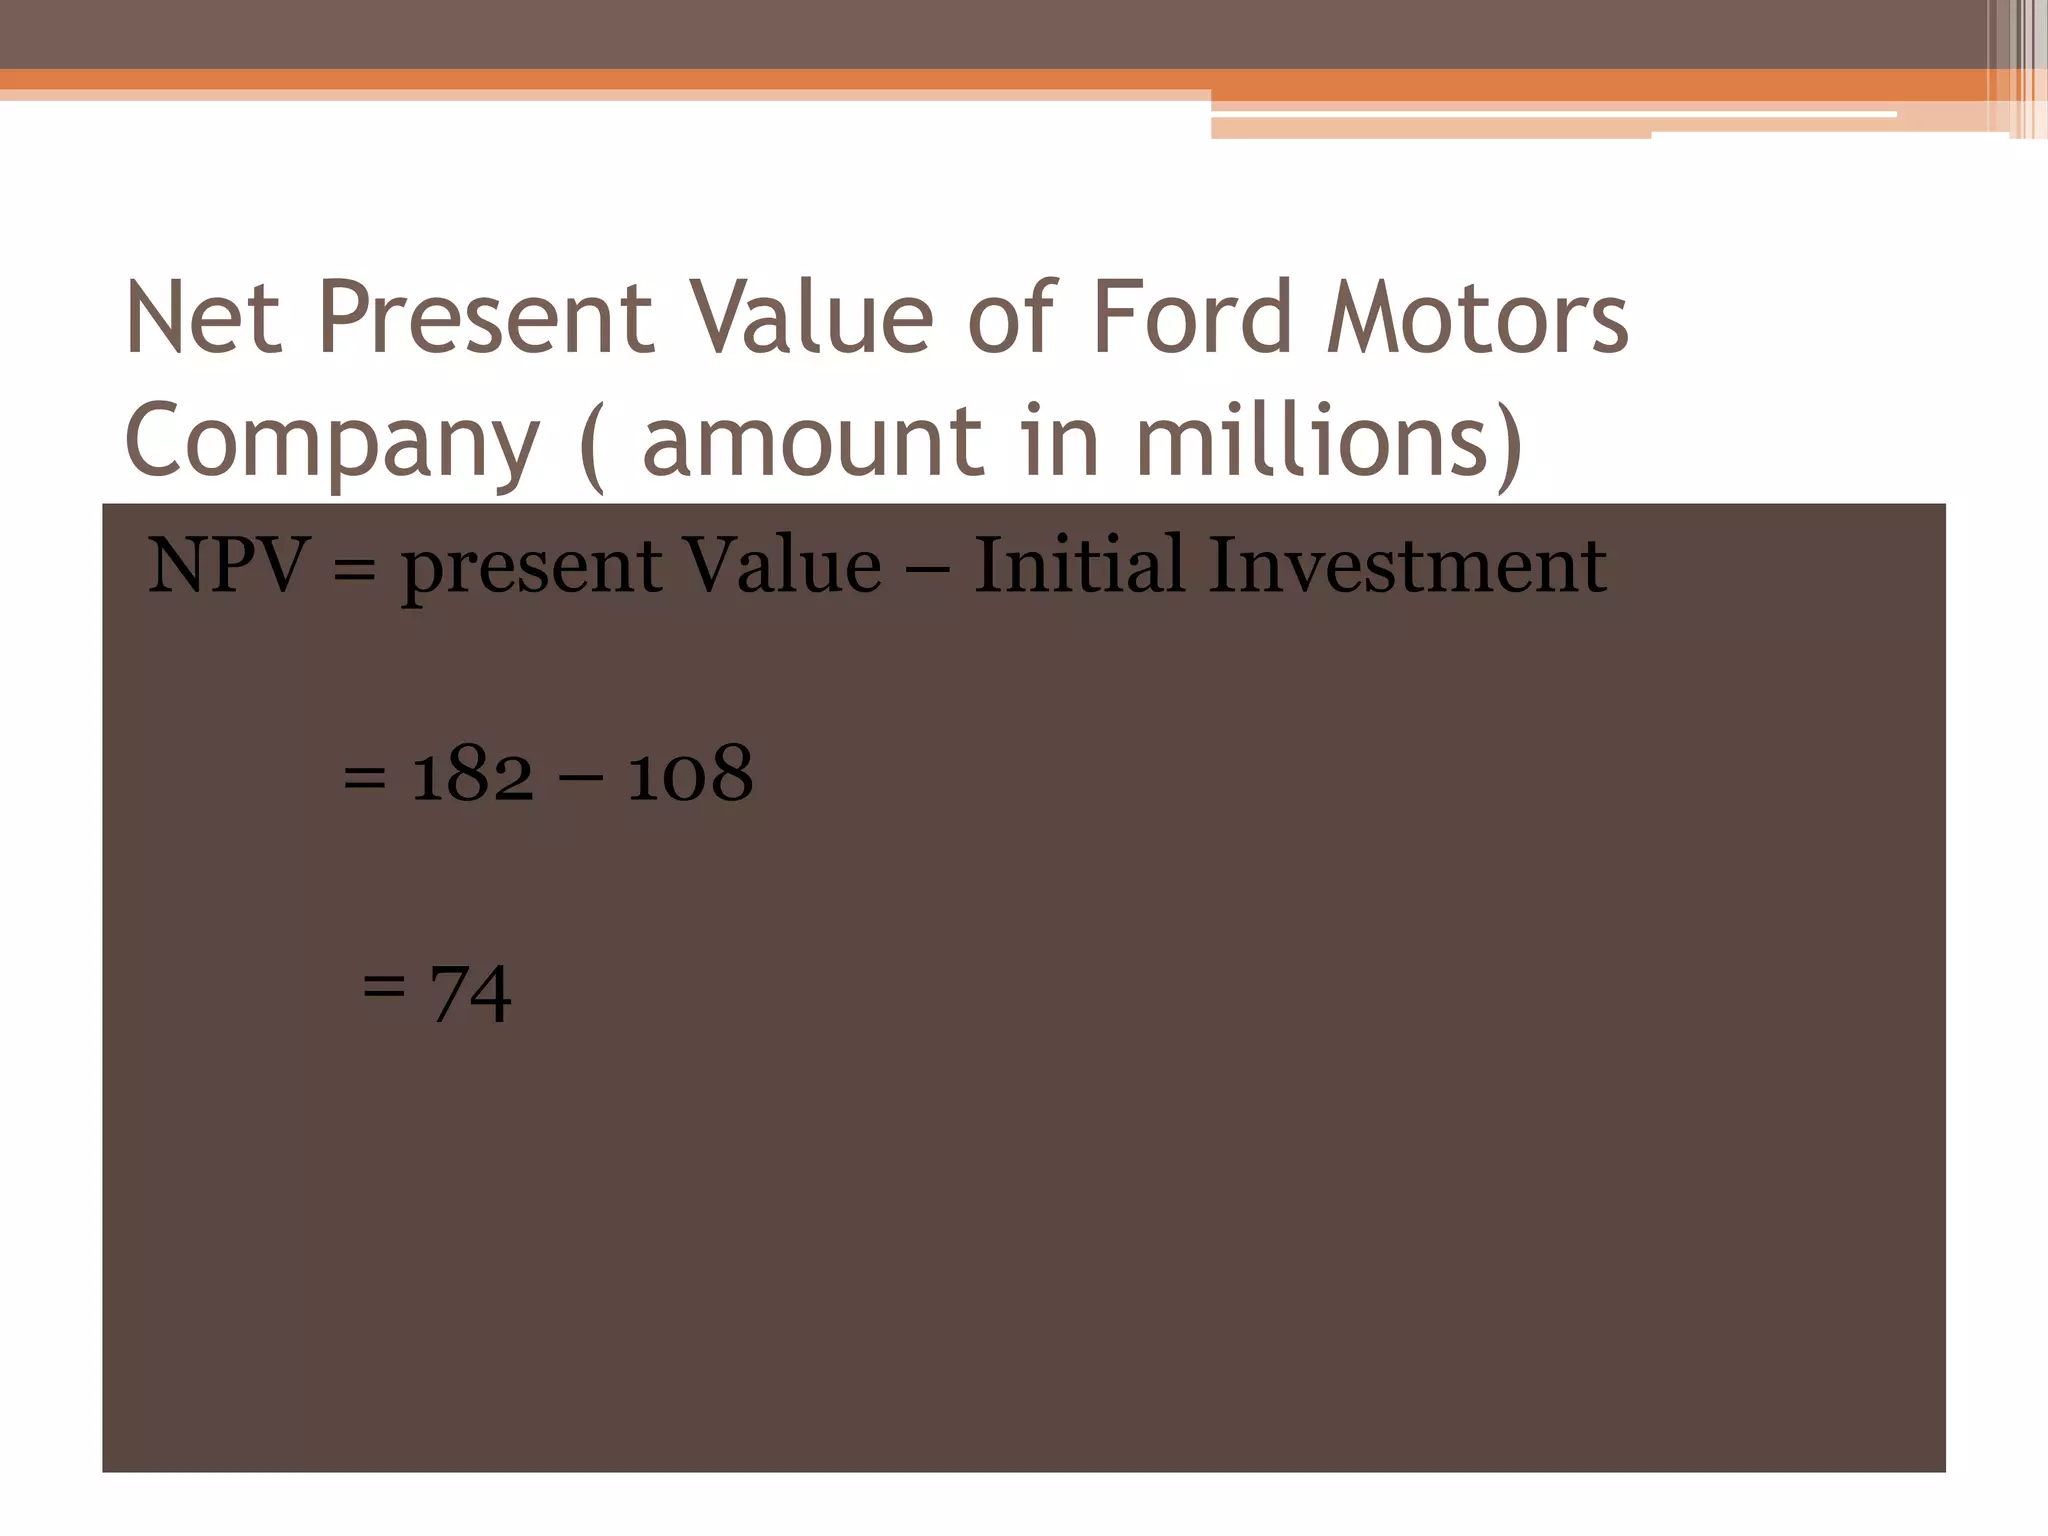
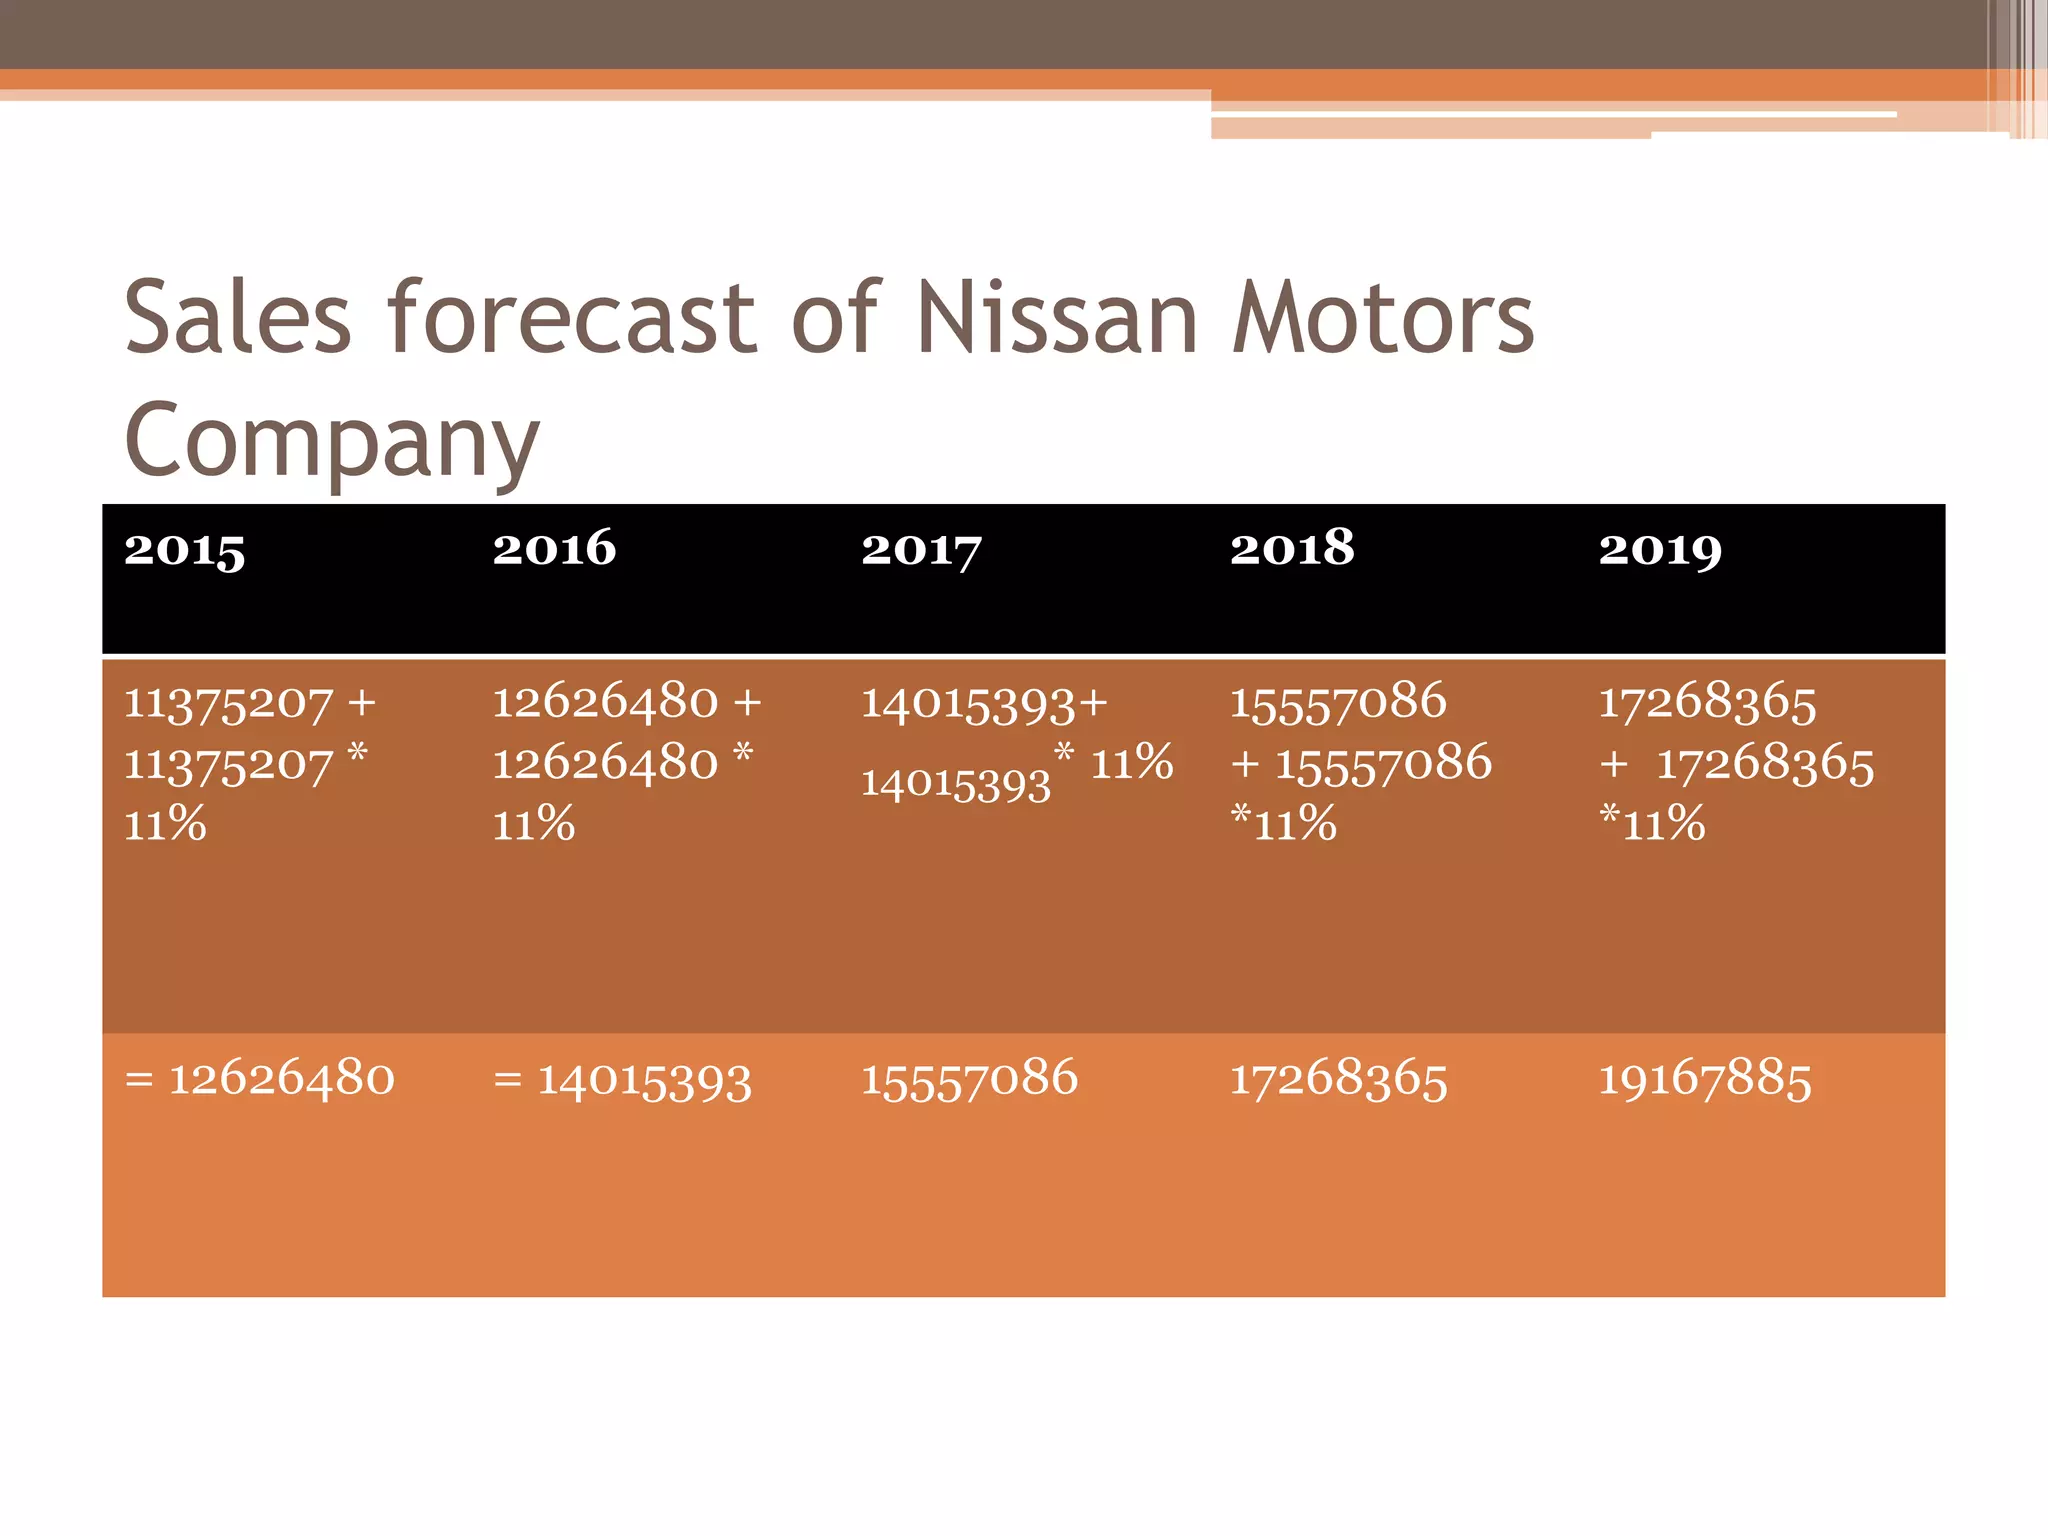
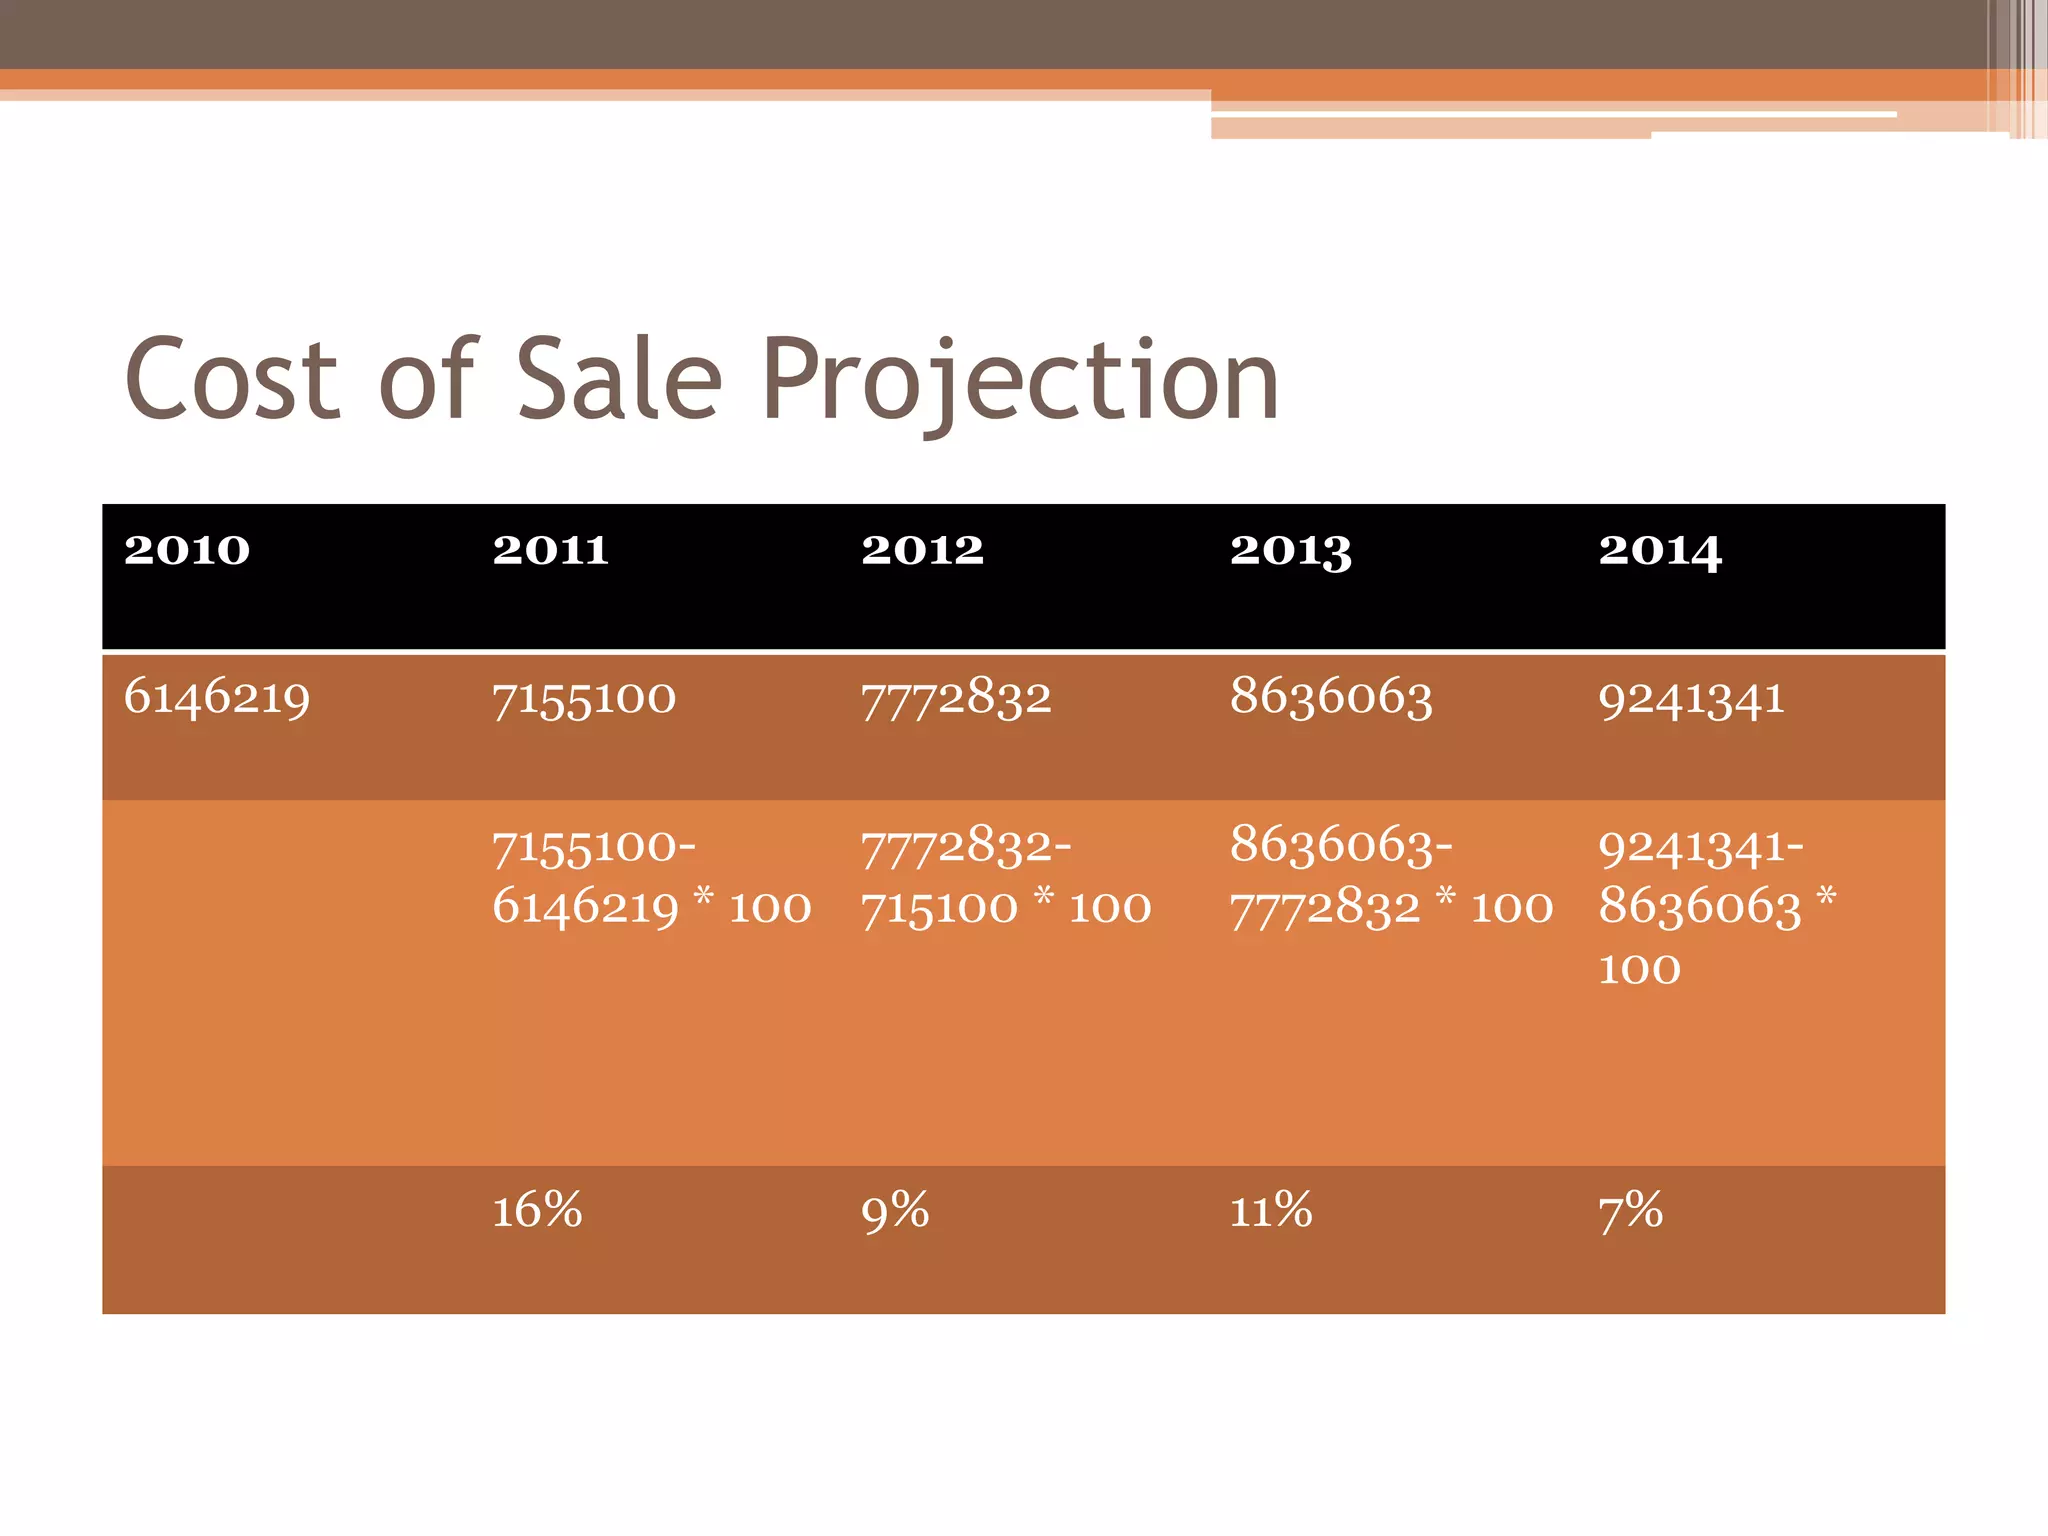
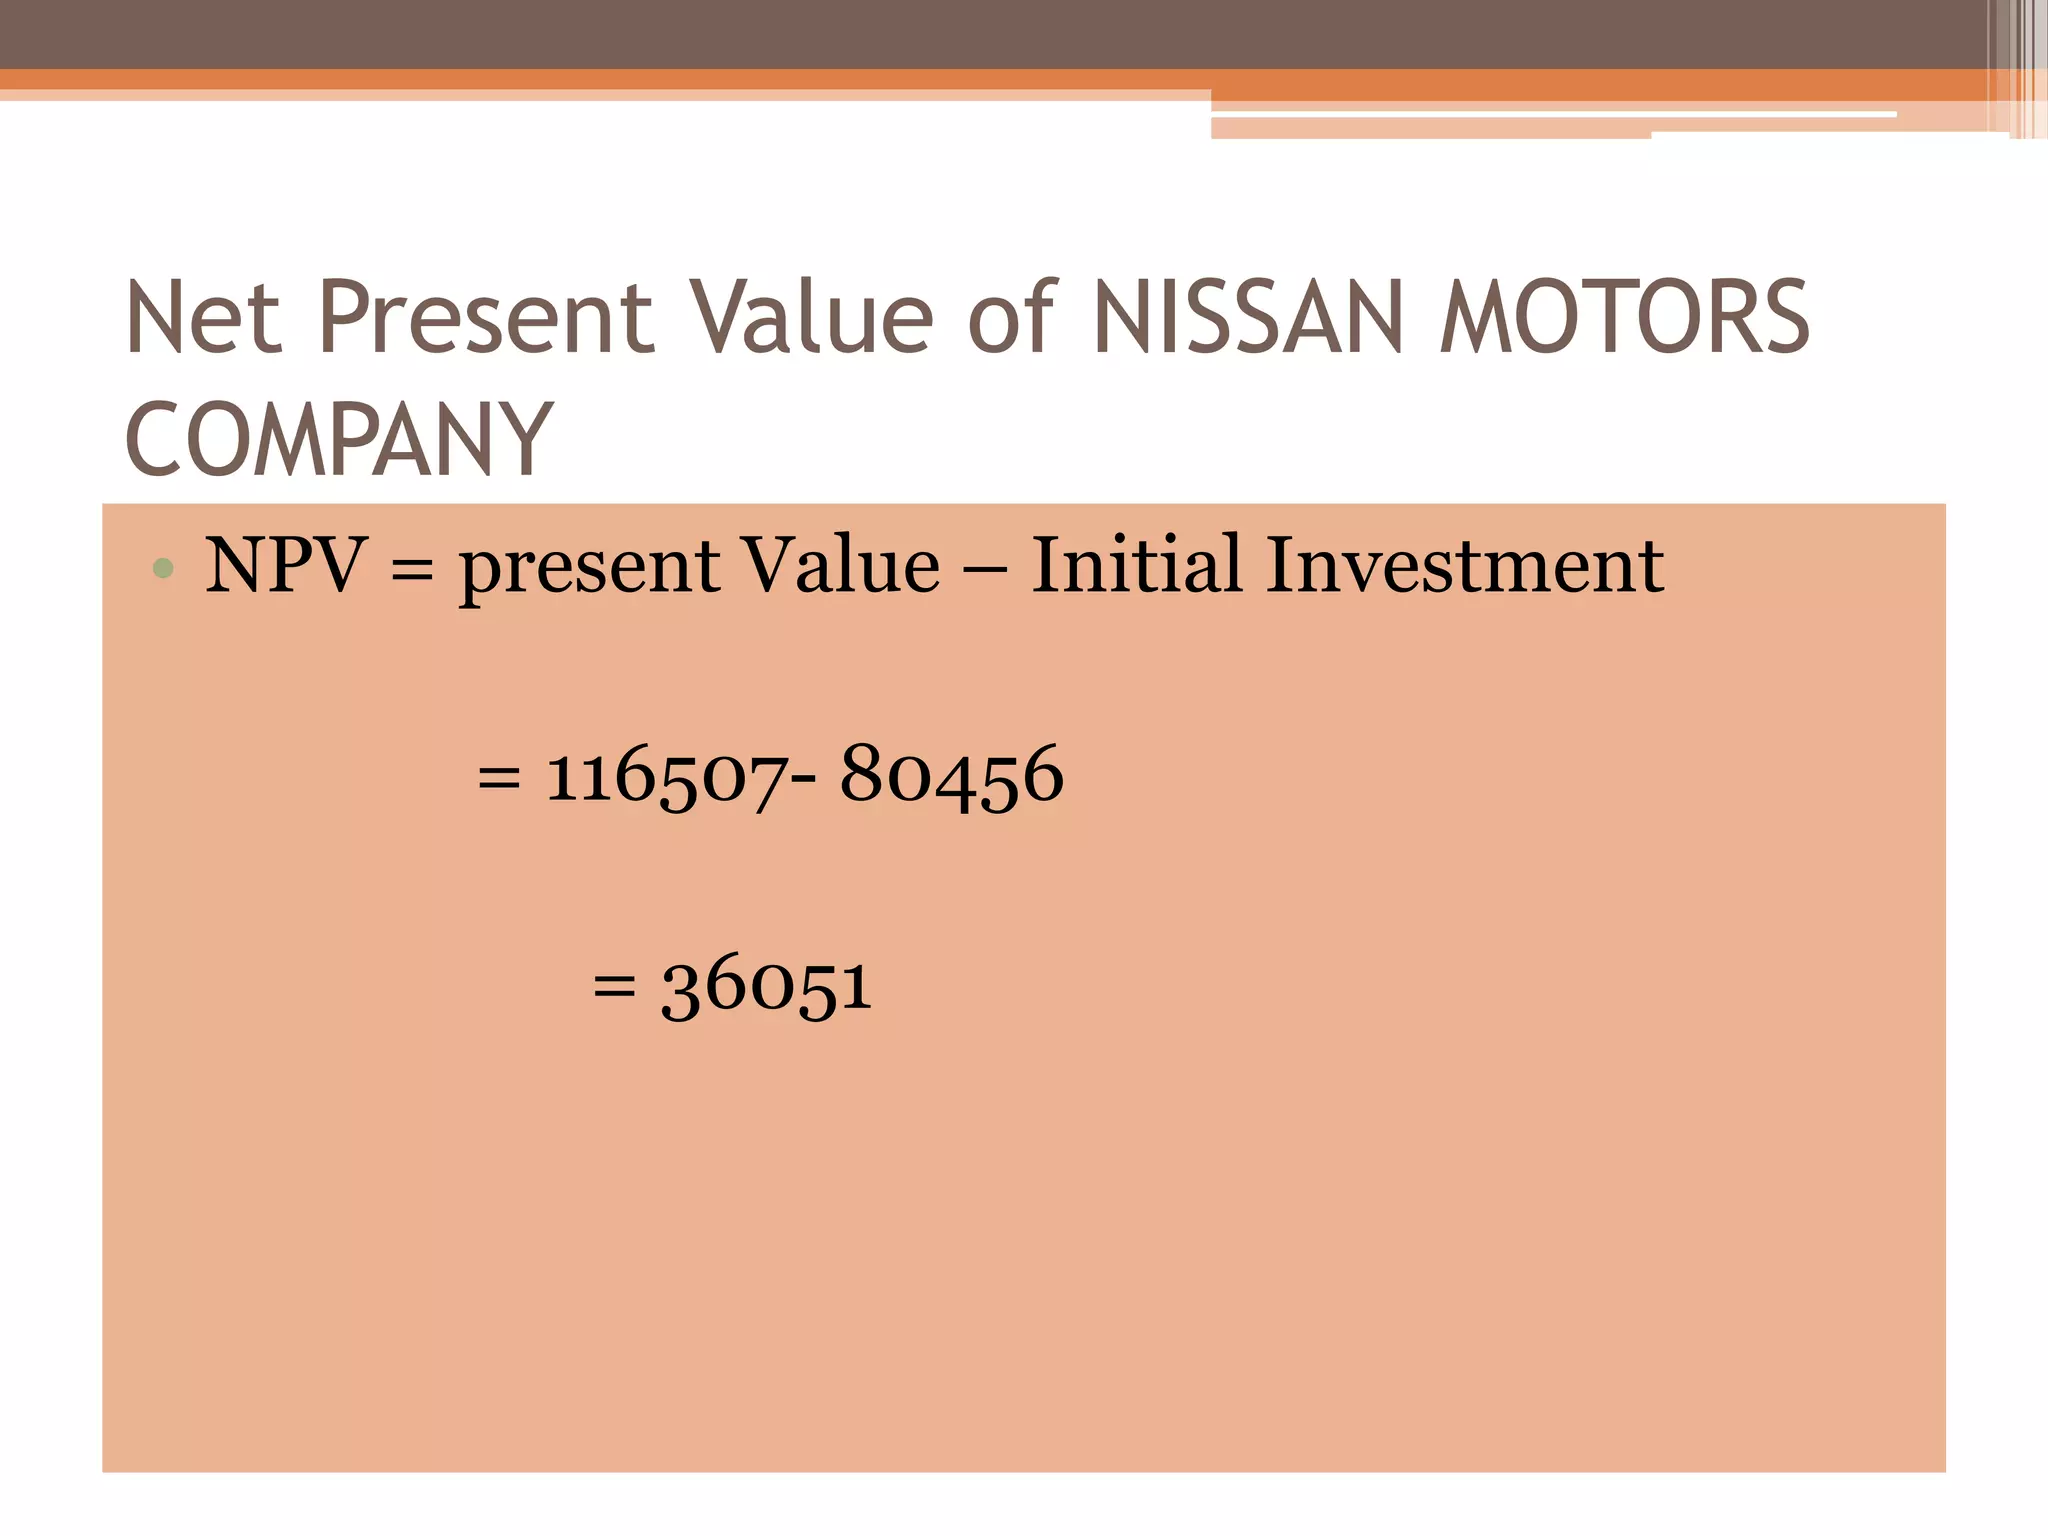
Project Presentation
Submitted by
Submitted to
Topic
Investment decision in Foreign Sector
Pakistan Brand of Automobile
Ghani Automobile Industries: Automobile
Industries is a Pakistani manufacturer of motorcycles based
in Lahore. The car and automobile brands in America is very
successful and if Pakistan Suzuki will invest in car sector in
America it will be also successful.
Ghani Automobile
Ghani Automobile is a collaboration of two
industrial groups, Ghani Group of Companies &
Chongqing Yingang Science and Technology Group
Company Limited, and is a public limited company
quoted on the stock exchange in Pakistan. Ghani
Automobiles is a company of Ghani Group, and is
listed on Stock Exchanges. Established in 2004, the
company started its commercial production of the
two wheelers during 2005. The head office is in
Model Town, Lahore, Pakistan while the plant is
situated at 49 km Multan Road.
Location of Ghani Automobile in
Pakistan
Future Expectation of Ghani
Automobile
Car industry or automobile industry in America
is an important part of the American economy
The industry makes a significant contribution to
the economies of regional areas through service
opportunities and through their quality
The agenda of American car and automobile
brands is to provide the best and luxury car for
people.
Competitors of Automobile in America
Fiat Group with Chrysler
Ford Motors Company
Nissan Motors
Fiat Automobiles
Fiat Chrysler Automobile is an Italian-
American multinational automobile
manufacturer. It is the world’s seventh-largest
auto maker. The group was established in 2014
by merging Fiat S.P.A. into a new holding
company incorporated in the Netherland and
headquartered in London, UK and primary
listing on the New York Stock Exchange and
secondary on Borsa Italian.
Performance of Fiat in 2014
FCA delivered a strong performance in 2014
with 4.6 million cars sold, and the Jeep brand
achieving records sales of more than one million
Cars (when FIAT’s involvement in Chrysler
began Jeep was selling just 337,000 units).
FINANCIAL INVESTMENTS (5.5% of
GAV)
• Their Financial Investments returned 14.3% on average
in 2014.
• During the year we slightly reduced their exposure to
single equity names (direct investments
• returned +14.1%) and they exited a number of
third‐party funds they were invested in.
• Their main investment is in the Black Ant Fund (59.16%
of our financial investments) which
• returned +12.7% and its allocation at the end of the year
was 36% in listed equities and equity
• options, 40% in credit and 24% in cash.
• Their fund investments, excluding Black Ant, were the
best performers with a +20.3% return
Fiat passenger car Production
Sales Projection of Fiat with Chrysler
2010 2011 2012 2013 2014
35880 59559 83957 86816 96090
599559-35880 /
35880 * 100
83957-59559
/ 59559 *100
86816-83957
/ 83957 * 100
96090-86816
/ 86816 * 100
= 66% 41% 3% 11%
Average Growth Rate
66%+41%+3%+11% / 4
= 30%
Sales Forecast
2015 2016 2017 2018 2019
96090+
96090 * 30%
124917+
124917 * 30%
162392+
162392 * 30%
211110+
211110 * 30%
274443+
274443 *30 %
=124917 =162392 =211110 =274443 =356776
Cost of sale Projection
2010 2011 2012 2013 2014
30716 50704 71474 74570 83146
50704-30716
/ 30716 *100
71474-50704
/50704 * 100
74570-71474
/71474 *100
83146-74570
/74570 *100
65% 41% 4% 12%
Average Growth Rate
65% + 41% + 4% + 12% / 4
=31%
Average Growth Rate
Cost of sale Forecast
2015 2016 2017 2018 2019
83146 +
86146 * 31%
108921+
108921 * 31%
142687+
142687 *31%
186920+
186920 * 31%
244866 +
244866 *31%
108921 142687 186920 244866 320774
2014 2015 2016 2017 2018 2019
Initial
investment
(530)
Cash flows 15996 19705 24190 29577 36002
Exchange
Rates
104.7 104.7 104.7 104.7 104.7
Translate
Amount
15996/
104.7
=153
19705/
104.7
=188
24190/
104.7
=231
29577/
104.7
=282
36002 /
104.7
=344
Discount
Rate
10% 10% 10% 10% 10%
Discount
Factor
1.1 1.21 1.331 1.4641 1.61051
Present
Value
153 / 1.1
=139
188 /1.21
=155
231 / 1.31
=174
282/
1.46= 193
344/1.61
=214
Calculation of Discount Rate
• Discount Rate = net income after tax /
Shareholders equity
• Average of Discount rate = 8+11+16+5 / 4 = 10%
2011 2012 2013 2014
1006/ 12260
=8.2%
1411 / 13173
= 11%
1951 /12584
=16%
632/13738
=5%
Net Present Value of Fiat Chrysler
• NPV = present Value – Initial Investment
= 875 – 530
= 345
Feasibility of Ford Motors
Company
 Ford is committed to developing great products
for customers around the world. In 2014, they are
introducing 23 new vehicles globally.
Ford saw the largest percentage point gain in U.S.
market share among automakers in 2013. In
addition, Ford F-Series was the best-selling vehicle
in the United States for the 32nd year in a row and
Ford Focus was the best-selling nameplate in the
world.
 With the freshest car portfolio in the industry and a
commitment to deliver continuous improvement for
fuel economy, Ford is well positioned in the global
marketplace
Performance in 2014
2014 was a successful step forward in furthering
One Ford plan to deliver profitable growth for all.
Despite a challenging environment, particularly in
South America and Russia, and an unprecedented
number of product launches, the company’s fifth
consecutive year of pre-tax profit and positive
automotive operating-related cash flow reflects our
continued focus on our One Ford plan.
•
Market Shares in USA
Market share represents reported retail sales of
their brands as a percent of total industry sales
volume in the relevant market or region. Market
share is based, in part, on estimated vehicle
registrations; includes medium and heavy
trucks.
20 market share was 8.0 percent, 7.8 percent,
and 7.9 percent in 2014, 2013, and 2012,
respectively. Automotive Segments were
reorganized effective January 1, 2014.
Sales projection of Ford Motors
company
2010 2011 2012 2013 2014
119280 128168 126567 139369 136782
128168-
119280 * 100
126567-
128168 * 100
139369-
126567 *100
136782 –
139369 *100
7% (1%) 10% (2%)
Average Growth Rate
7-1+10-2 / 4
= 3.5%
Average Growth Rate
Sales forecast of Ford Motors company
2015 2016 2017 2018 2019
136782 +
136782 * 3.5%
141569 +
141569 * 3.5%
146524 +
146524 * 3.5%
151652 +
151652 *3.5%
156960 +
156960 *3.5%
=141569 =146524 =151652 =156960 =162454
Cost of Sales Projection
2010 2011 2012 2013 2014
104451 113611 112992 125234 123516
113611 –
104451 *100
112992-
113611 *100
125234-
112992 *100
123516-
125234 *100
9% (0.5%) 11% (1.3%)
• Average Growth Rate
= 9-0.5+11-1.3 / 4
=4.5%
Average Growth Rate
Cost of Sales Forecast
2015 2016 2017 2018 2019
123516 +
123516 *4.5%
129074 +
129074 *4.5%
134882 +
134882 *4.5%
140952+
140952 *4.5%
147295
+147295
*4.5%
129074 134882 140952 147295 153923
2014 2015 2016 2017 2018 2019
Initial
investment
(108)
Cash flows 12495 11642 10700 9665 8531
Exchange
Rate
104.7 104.7 104.7 104.7 104.7
Translated
Amount
12495
/104.7
=119
11642/
104.7
=111
10700/
104.7
= 102
9665?
104.7
=92
8531/
104.7
= 81
Discount
Rate
52% 52% 52% 52% 52%
Discount
Factor
1.52 2.3104 3.5118 5.337 8.113
Present Value 119/
1.52
= 78
111/
2.3104
= 48
102/3.511
=29
92 /
5.33
=17
81 /8.113
=10
NPV = present Value – Initial Investment
= 182 – 108
= 74
Net Present Value of Ford Motors
Company ( amount in millions)
Feasibility of NISSAN Motors
• Since 1999, Nissan has been part of the Renault–
Nissan Alliance, a partnership between Nissan
and French automaker Renault. As of 2013,
Renault holds a 43.4% voting stake in Nissan,
while Nissan holds a 15% non-voting stake in
Renault. Carlos Ghosn serves as CEO of both
companies.
• Nissan was the sixth largest automaker in the
world behind Toyota, General
Motors, Volkswagen Group, Hyundai Motor
Group, and Ford in 2013.
• Taken together, the Renault–Nissan Alliance
would be the world’s fourth largest automaker.
Nissan is the leading Japanese brand in China,
Russia and Mexico
Performance in 2014
Nissan's North American sales increase 12
percent in 2014, more than double overall
industry performance; market share rises to 9.3
percent, up 0.6 points
North American production rises 21 percent;
U.S. production +24 percent; Mexico +18
percent
Smyrna, Tennessee facility becomes the top-
producing automotive manufacturing plant in
North America through first
Sales Projection of Nissan Motors
Company
2010 2011 2012 2013 2014
7517277 8773093 9409026 10482520 11375207
8773093-
7517277 /
7517277 *100
9409026-
8773093 /
8773093 *100
10482520 –
9409026 /
9409026 *100
11375207-
10482520 /
1048252*100
=17% 7% 11% 9%
• Average Growth Rate
= 17+7+11+9 / 4
= 11%
Average Growth Rate
Sales forecast of Nissan Motors
Company
2015 2016 2017 2018 2019
11375207 +
11375207 *
11%
12626480 +
12626480 *
11%
14015393+
14015393* 11%
15557086
+ 15557086
*11%
17268365
+ 17268365
*11%
= 12626480 = 14015393 15557086 17268365 19167885
Cost of Sale Projection
2010 2011 2012 2013 2014
6146219 7155100 7772832 8636063 9241341
7155100-
6146219 * 100
7772832-
715100 * 100
8636063-
7772832 * 100
9241341-
8636063 *
100
16% 9% 11% 7%
• Average Growth Rate
= 16+9+11+7 / 4
=10.7%
Average Growth Rate
Cost of Sales Forecast
2015 2016 2017 2018 2019
9241341 +
9241341 *
10.7%
10230164 +
10230164 *
10.7%
11324792 +
11324792 *
10.7%
12457271 +
12457271 *
10.7%
13790199 +
13790199 *
10.7%
=10230164 =11324792 = 12457271 =13790199 = 15265750
2014 2015 2016 2017 2018 2019
Initial
Investment
(8045
-6)
Cash Flows 2396316 2690601 3099815 3478166 39021335
Exchange
Rate
104.7 104.7 104.7 104.7 104.7
Translated
Amount
2396316/
104.7
= 22887
2690601
/ 104.7
= 25698
3099815/
104.7
=29607
3478166/
104.7
=33220
3902135/
104.7
=37270
Discount
Rate
8% 8% 8% 8% 8%
Discount
Factor
1.08 1.1664 1.2597 1.3604 1.4693
Present
Value
22887 /
1.08
=21192
25698/
1.1664
=22032
29607/
1.2597
=23503
33220/
1.3604
=24419
37270/
1.4693
=25361
Net Present Value of NISSAN MOTORS
COMPANY
• NPV = present Value – Initial Investment
= 116507- 80456
= 36051
All these analysis of the competitors shows that
their net present value is favorable in automobile
industry so the Ghani Automobile company has
the opportunity to enhance their business by
investing in automobile sector in America it will
be successful investment into foreign because
these companies also working as a leader into
industry due to successful sector of Cars and
other automobiles.
Project Presentation (1)

Project Presentation (1)

  • 1.
  • 2.
  • 3.
  • 4.
  • 5.
    Pakistan Brand ofAutomobile Ghani Automobile Industries: Automobile Industries is a Pakistani manufacturer of motorcycles based in Lahore. The car and automobile brands in America is very successful and if Pakistan Suzuki will invest in car sector in America it will be also successful.
  • 6.
    Ghani Automobile Ghani Automobileis a collaboration of two industrial groups, Ghani Group of Companies & Chongqing Yingang Science and Technology Group Company Limited, and is a public limited company quoted on the stock exchange in Pakistan. Ghani Automobiles is a company of Ghani Group, and is listed on Stock Exchanges. Established in 2004, the company started its commercial production of the two wheelers during 2005. The head office is in Model Town, Lahore, Pakistan while the plant is situated at 49 km Multan Road.
  • 7.
    Location of GhaniAutomobile in Pakistan
  • 8.
    Future Expectation ofGhani Automobile Car industry or automobile industry in America is an important part of the American economy The industry makes a significant contribution to the economies of regional areas through service opportunities and through their quality The agenda of American car and automobile brands is to provide the best and luxury car for people.
  • 10.
    Competitors of Automobilein America Fiat Group with Chrysler Ford Motors Company Nissan Motors
  • 12.
    Fiat Automobiles Fiat ChryslerAutomobile is an Italian- American multinational automobile manufacturer. It is the world’s seventh-largest auto maker. The group was established in 2014 by merging Fiat S.P.A. into a new holding company incorporated in the Netherland and headquartered in London, UK and primary listing on the New York Stock Exchange and secondary on Borsa Italian.
  • 13.
    Performance of Fiatin 2014 FCA delivered a strong performance in 2014 with 4.6 million cars sold, and the Jeep brand achieving records sales of more than one million Cars (when FIAT’s involvement in Chrysler began Jeep was selling just 337,000 units).
  • 14.
    FINANCIAL INVESTMENTS (5.5%of GAV) • Their Financial Investments returned 14.3% on average in 2014. • During the year we slightly reduced their exposure to single equity names (direct investments • returned +14.1%) and they exited a number of third‐party funds they were invested in. • Their main investment is in the Black Ant Fund (59.16% of our financial investments) which • returned +12.7% and its allocation at the end of the year was 36% in listed equities and equity • options, 40% in credit and 24% in cash. • Their fund investments, excluding Black Ant, were the best performers with a +20.3% return
  • 15.
  • 16.
    Sales Projection ofFiat with Chrysler 2010 2011 2012 2013 2014 35880 59559 83957 86816 96090 599559-35880 / 35880 * 100 83957-59559 / 59559 *100 86816-83957 / 83957 * 100 96090-86816 / 86816 * 100 = 66% 41% 3% 11%
  • 17.
  • 18.
    Sales Forecast 2015 20162017 2018 2019 96090+ 96090 * 30% 124917+ 124917 * 30% 162392+ 162392 * 30% 211110+ 211110 * 30% 274443+ 274443 *30 % =124917 =162392 =211110 =274443 =356776
  • 19.
    Cost of saleProjection 2010 2011 2012 2013 2014 30716 50704 71474 74570 83146 50704-30716 / 30716 *100 71474-50704 /50704 * 100 74570-71474 /71474 *100 83146-74570 /74570 *100 65% 41% 4% 12%
  • 20.
    Average Growth Rate 65%+ 41% + 4% + 12% / 4 =31% Average Growth Rate
  • 21.
    Cost of saleForecast 2015 2016 2017 2018 2019 83146 + 86146 * 31% 108921+ 108921 * 31% 142687+ 142687 *31% 186920+ 186920 * 31% 244866 + 244866 *31% 108921 142687 186920 244866 320774
  • 22.
    2014 2015 20162017 2018 2019 Initial investment (530) Cash flows 15996 19705 24190 29577 36002 Exchange Rates 104.7 104.7 104.7 104.7 104.7 Translate Amount 15996/ 104.7 =153 19705/ 104.7 =188 24190/ 104.7 =231 29577/ 104.7 =282 36002 / 104.7 =344 Discount Rate 10% 10% 10% 10% 10% Discount Factor 1.1 1.21 1.331 1.4641 1.61051 Present Value 153 / 1.1 =139 188 /1.21 =155 231 / 1.31 =174 282/ 1.46= 193 344/1.61 =214
  • 23.
    Calculation of DiscountRate • Discount Rate = net income after tax / Shareholders equity • Average of Discount rate = 8+11+16+5 / 4 = 10% 2011 2012 2013 2014 1006/ 12260 =8.2% 1411 / 13173 = 11% 1951 /12584 =16% 632/13738 =5%
  • 24.
    Net Present Valueof Fiat Chrysler • NPV = present Value – Initial Investment = 875 – 530 = 345
  • 25.
    Feasibility of FordMotors Company
  • 26.
     Ford iscommitted to developing great products for customers around the world. In 2014, they are introducing 23 new vehicles globally. Ford saw the largest percentage point gain in U.S. market share among automakers in 2013. In addition, Ford F-Series was the best-selling vehicle in the United States for the 32nd year in a row and Ford Focus was the best-selling nameplate in the world.  With the freshest car portfolio in the industry and a commitment to deliver continuous improvement for fuel economy, Ford is well positioned in the global marketplace
  • 27.
    Performance in 2014 2014was a successful step forward in furthering One Ford plan to deliver profitable growth for all. Despite a challenging environment, particularly in South America and Russia, and an unprecedented number of product launches, the company’s fifth consecutive year of pre-tax profit and positive automotive operating-related cash flow reflects our continued focus on our One Ford plan. •
  • 28.
    Market Shares inUSA Market share represents reported retail sales of their brands as a percent of total industry sales volume in the relevant market or region. Market share is based, in part, on estimated vehicle registrations; includes medium and heavy trucks. 20 market share was 8.0 percent, 7.8 percent, and 7.9 percent in 2014, 2013, and 2012, respectively. Automotive Segments were reorganized effective January 1, 2014.
  • 29.
    Sales projection ofFord Motors company 2010 2011 2012 2013 2014 119280 128168 126567 139369 136782 128168- 119280 * 100 126567- 128168 * 100 139369- 126567 *100 136782 – 139369 *100 7% (1%) 10% (2%)
  • 30.
    Average Growth Rate 7-1+10-2/ 4 = 3.5% Average Growth Rate
  • 31.
    Sales forecast ofFord Motors company 2015 2016 2017 2018 2019 136782 + 136782 * 3.5% 141569 + 141569 * 3.5% 146524 + 146524 * 3.5% 151652 + 151652 *3.5% 156960 + 156960 *3.5% =141569 =146524 =151652 =156960 =162454
  • 32.
    Cost of SalesProjection 2010 2011 2012 2013 2014 104451 113611 112992 125234 123516 113611 – 104451 *100 112992- 113611 *100 125234- 112992 *100 123516- 125234 *100 9% (0.5%) 11% (1.3%)
  • 33.
    • Average GrowthRate = 9-0.5+11-1.3 / 4 =4.5% Average Growth Rate
  • 34.
    Cost of SalesForecast 2015 2016 2017 2018 2019 123516 + 123516 *4.5% 129074 + 129074 *4.5% 134882 + 134882 *4.5% 140952+ 140952 *4.5% 147295 +147295 *4.5% 129074 134882 140952 147295 153923
  • 35.
    2014 2015 20162017 2018 2019 Initial investment (108) Cash flows 12495 11642 10700 9665 8531 Exchange Rate 104.7 104.7 104.7 104.7 104.7 Translated Amount 12495 /104.7 =119 11642/ 104.7 =111 10700/ 104.7 = 102 9665? 104.7 =92 8531/ 104.7 = 81 Discount Rate 52% 52% 52% 52% 52% Discount Factor 1.52 2.3104 3.5118 5.337 8.113 Present Value 119/ 1.52 = 78 111/ 2.3104 = 48 102/3.511 =29 92 / 5.33 =17 81 /8.113 =10
  • 36.
    NPV = presentValue – Initial Investment = 182 – 108 = 74 Net Present Value of Ford Motors Company ( amount in millions)
  • 37.
  • 38.
    • Since 1999,Nissan has been part of the Renault– Nissan Alliance, a partnership between Nissan and French automaker Renault. As of 2013, Renault holds a 43.4% voting stake in Nissan, while Nissan holds a 15% non-voting stake in Renault. Carlos Ghosn serves as CEO of both companies.
  • 39.
    • Nissan wasthe sixth largest automaker in the world behind Toyota, General Motors, Volkswagen Group, Hyundai Motor Group, and Ford in 2013. • Taken together, the Renault–Nissan Alliance would be the world’s fourth largest automaker. Nissan is the leading Japanese brand in China, Russia and Mexico
  • 40.
    Performance in 2014 Nissan'sNorth American sales increase 12 percent in 2014, more than double overall industry performance; market share rises to 9.3 percent, up 0.6 points North American production rises 21 percent; U.S. production +24 percent; Mexico +18 percent Smyrna, Tennessee facility becomes the top- producing automotive manufacturing plant in North America through first
  • 41.
    Sales Projection ofNissan Motors Company 2010 2011 2012 2013 2014 7517277 8773093 9409026 10482520 11375207 8773093- 7517277 / 7517277 *100 9409026- 8773093 / 8773093 *100 10482520 – 9409026 / 9409026 *100 11375207- 10482520 / 1048252*100 =17% 7% 11% 9%
  • 42.
    • Average GrowthRate = 17+7+11+9 / 4 = 11% Average Growth Rate
  • 43.
    Sales forecast ofNissan Motors Company 2015 2016 2017 2018 2019 11375207 + 11375207 * 11% 12626480 + 12626480 * 11% 14015393+ 14015393* 11% 15557086 + 15557086 *11% 17268365 + 17268365 *11% = 12626480 = 14015393 15557086 17268365 19167885
  • 44.
    Cost of SaleProjection 2010 2011 2012 2013 2014 6146219 7155100 7772832 8636063 9241341 7155100- 6146219 * 100 7772832- 715100 * 100 8636063- 7772832 * 100 9241341- 8636063 * 100 16% 9% 11% 7%
  • 45.
    • Average GrowthRate = 16+9+11+7 / 4 =10.7% Average Growth Rate
  • 46.
    Cost of SalesForecast 2015 2016 2017 2018 2019 9241341 + 9241341 * 10.7% 10230164 + 10230164 * 10.7% 11324792 + 11324792 * 10.7% 12457271 + 12457271 * 10.7% 13790199 + 13790199 * 10.7% =10230164 =11324792 = 12457271 =13790199 = 15265750
  • 47.
    2014 2015 20162017 2018 2019 Initial Investment (8045 -6) Cash Flows 2396316 2690601 3099815 3478166 39021335 Exchange Rate 104.7 104.7 104.7 104.7 104.7 Translated Amount 2396316/ 104.7 = 22887 2690601 / 104.7 = 25698 3099815/ 104.7 =29607 3478166/ 104.7 =33220 3902135/ 104.7 =37270 Discount Rate 8% 8% 8% 8% 8% Discount Factor 1.08 1.1664 1.2597 1.3604 1.4693 Present Value 22887 / 1.08 =21192 25698/ 1.1664 =22032 29607/ 1.2597 =23503 33220/ 1.3604 =24419 37270/ 1.4693 =25361
  • 48.
    Net Present Valueof NISSAN MOTORS COMPANY • NPV = present Value – Initial Investment = 116507- 80456 = 36051
  • 49.
    All these analysisof the competitors shows that their net present value is favorable in automobile industry so the Ghani Automobile company has the opportunity to enhance their business by investing in automobile sector in America it will be successful investment into foreign because these companies also working as a leader into industry due to successful sector of Cars and other automobiles.