Download to read offline


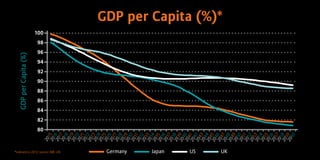
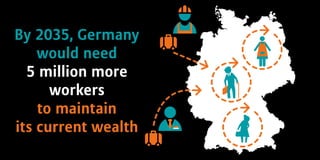
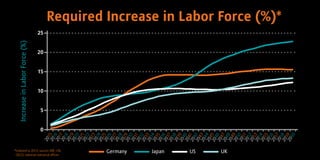

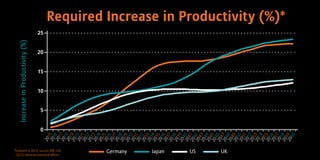


By 2035, Germany may face a significant decline in GDP per capita, potentially losing nearly one-sixth due to an aging population. To maintain its current wealth, Germany will require an additional 5 million workers, necessitating a 17% increase in worker productivity per hour. This situation underscores the urgent need for labor force expansion and productivity enhancements.