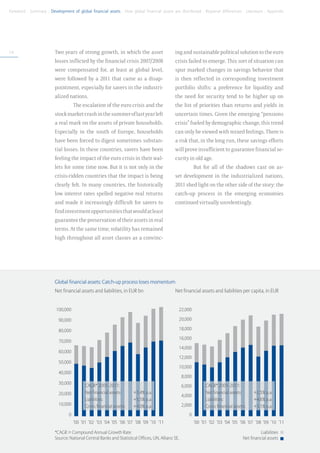
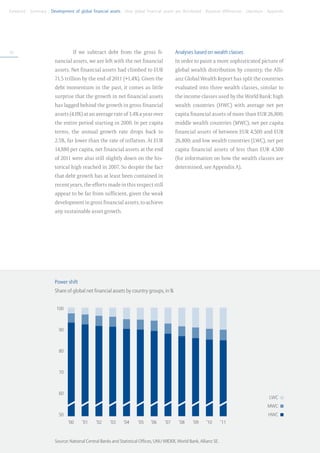
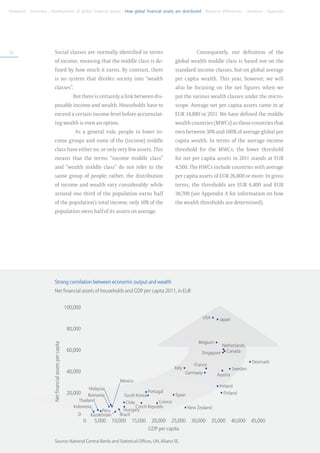
Economic Research &
Corporate Development


Allianz
Global Wealth
Report 2012
Allianz
Global Wealth
Report 2012

Kathrin Brandmeir
Dr. Michaela Grimm
Dr. Michael Heise
Dr. Arne Holzhausen
Gabriele Steck
Allianz Global Wealth Report 2012


Preface                                                                                                                           5


At first glance, global wealth development paints an impressive picture: last year, the finan-
cial assets of private households worldwide topped the 100 trillion mark. This is a staggering
amount, enough to allow savers to buy the outstanding government bonds of every country
in the world three times over.


If we scratch beneath the surface, however, the development proves to be anything but spec-
tacular. Since 2000, per capita financial assets have been growing at an average rate of 3% a
year – roughly on a par with the global rate of inflation during this period. In other words:
over the past eleven years, savers have not, on average, managed to achieve any real value
gains. The reason behind this development is obvious: any attempts by households to save
have been scuppered by the recurring crises on the financial markets; wealth development
in the US and Europe has been particularly disappointing of late. In 2011, western Europe was
actually the only region in the world in which assets contracted overall.


The trend definitely provides food for thought. The longer it takes to restructure the financial
markets and find a sustainable solution to the eurozone debt crisis, in particular, the greater
the risk of “losing” a whole generation of savers because the idea of long-term investment
is eyed with deep mistrust. But given the major challenges that lie ahead, from the shifts
in the global economic and political weights, to climate change and demographic change,
we cannot afford to take the short-sighted approach. Confidence in the financial markets,
which serve to balance out risks and returns in the long term, is a must if we want to achieve
sustainable growth and prosperity.


But there is another aspect of global wealth development that harbors risks. This time, it is
the other side of the coin; private household debt. Although debt growth has slowed consider-
ably across the globe over the past few years – in the US, debt actually declined for the fourth
year running in 2011 – the pace of debt growth is still too fast, particularly on the emerging
markets, which, even today, are still reporting annual growth rates of 20%.


So the third issue of the “Allianz Global Wealth Report“, which takes another detailed look
at the global wealth and debt situation of private households based on international data,
provides not only a cornucopia of information and comparisons, but also leaves readers with
plenty to chew over in their minds. I am convinced that, in doing so, the report makes an im-
portant contribution by looking at current problems from a different perspective, namely the
perspective of savers, who are, unfortunately, all too often overlooked in the political debate,
although they are essential to our long-term prosperity.


Michael Diekmann
Chairman of the Board of Management of Allianz SE
Table of contents
	 9	 Summary

	13	 Development of global financial assets:
		 Personal assets in the shadow of the crisis

	29	 How global financial assets are distributed:
		 How big is the world’s middle class in terms of wealth?

	37	 Regional differences:
		 Financial assets in individual regions

	91	 Literature

	92	 Appendix A: Methodological comments

	95	 Appendix B: Financial assets by country
Summary
Allianz Global Wealth Report 2012


The development in global gross financial           Global prosperity gap and different catch-up
assets of private households in 2011 was            processes                                                                          9

largely disappointing. The growth rate              In order to paint a more sophisticated pic-
slowed to 1.6%, the lowest level seen since         ture of global wealth distribution by country,
the crisis-ridden year of 2008. Not least due       the Allianz Global Wealth Report has split
to the weaker euro, financial assets in the 52      the countries evaluated into three wealth
countries included in our analysis neverthe-        classes, similar to the income classes used
less surpassed the EUR 100 trillion mark for        by the World Bank: high wealth countries
the first time, coming in at EUR 103.3 trillion     (HWC) with average net per capita finan-
at the end of 2011. Global financial assets         cial assets of more than EUR 26,800; mid-
have been growing at an average rate of 4.0%        dle wealth countries (MWC), net per capita
a year since 2000, slower than the growth in        financial assets of between EUR 4,500 and
nominal economic output. At a good 3%, per          EUR 26,800; and low wealth countries (LWC),
capita growth in financial assets has only          net per capita financial assets of less than
been on a par with average global inflation         EUR 4,500.
during the same period. This means that sav-
ers worldwide have not been able to achieve         Wealth is distributed very unevenly through-
any real asset growth over the past eleven          out the world. Even today, around 85% of glo-
years.                                              bal net financial assets are still in the hands
                                                    of private households in HWCs, although
2011 also saw private household debt climb          these countries are home to less than 20% of
to a new record high of EUR 31.8 trillion. The      the global population. The global prosperity
pace of debt growth has, however, slackened         gap is immense from a per capita perspec-
considerably since the financial crisis of          tive, too: net per capita financial assets in the
2007/08, coming in at “only” 2.2% last year.        HWCs totaled EUR 70,590 at the end of 2011,
This resulted in an improvement in the glo-         several times higher than in the LWCs, where
bal debt ratio (liability of private households     the same figure came in at only EUR 2,040
as percent of global GDP) to 67.0%, a far cry       per capita. People in MWCs had average net
from the pre-crisis high of 2007 (71.4%).           financial assets worth EUR 10,240.


Global net financial assets (gross financial        The considerable variance in the levels also
assets less liabilities) reached EUR 71.5 tril-     implies marked differences in growth. Net
lion at the end of 2011. Over the past decade,      per capita financial assets in the LWCs has
the growth in net financial assets has lagged       been growing by almost 16% a year since
significantly behind the growth in gross            2000, eight times faster than in the HWCs.
financial assets at 3.4% a year, a side effect of   At the beginning of the decade, per capita
the rapid debt growth prior to the outbreak of      financial assets in the HWCs were still 141
the financial crisis. At EUR 14,880 per capita,     times as high as in the LWCs, a factor that
net financial assets at the end of 2011 were        has since been reduced to 35.
also still slightly down on the historical high
reached in 2007.
Foreword . Summary . Development of global financial assets . How global financial assets are distributed . Regional differences . Literature . Appendix


                                   These marked differences in growth also                     Although eastern European households
10                                 mirror the varying impact of the latest                     still have the lowest net per capita financial
                                   financial crises. The world’s poorer coun-                  assets as a region, they topped the growth
                                   tries have escaped these slumps virtually                   charts both last year and looking at the last
                                   unscathed: average per capita net financial                 decade as a whole: net per capita financial
                                   assets in the LWCs, for example, are already                assets have increased by almost 12% a year
                                   almost 38% higher than they were in 2007,                   on average since 2000, with developments
                                   whereas in the HWCs, financial assets are                   in Latin America and the Asian emerging
                                   still lingering at a level that is 3.2% lower               markets looking similarly dynamic. The
                                   than the pre-crisis level.                                  financial crisis has, however, triggered a
                                                                                               considerable reduction in the annual growth
                                   Compared with the LWCs, the MWCs have                       rate in all three regions. The crisis has dealt
                                   been much slower in playing catch-up since                  an even greater blow to the richer parts of
                                   2000. The annual growth in net per capita fi-               the world: in these regions (North America,
                                   nancial assets in this group of countries was               western Europe and Oceania), net per capita
                                   “only” twice as high as in their richer coun-               financial assets are still down on the level
                                   terparts. This can be explained by a combi-                 seen in 2007. Both over the entire decade
                                   nation of a relatively high debt level to begin             starting in 2000 (+1.3% a year) and in 2011
                                   with and considerable debt momentum in                      (-1.5%), western Europe reported the poorest
                                   these countries: as with gross financial as-                growth performance. The euro crisis is tak-
                                   sets, debt also grew more than twice as fast                ing its toll.
                                   as in the HWCs over the same period.
                                                                                               World seeks refuge in security
                                   Households in eastern Europe remain the                     In addition to the level of assets and asset
                                   “growth champions”                                          growth, there are also very marked differ-
                                   A regional analysis returns the expected                    ences in asset structures worldwide. In the
                                   result: on the one hand, we have the rich                   HWCs, financial assets are distributed more
                                   regions of North America, western Europe                    or less evenly among the three major asset
                                   and Oceania, with average net per capita fi-                classes: bank deposits, insurance policies/
                                   nancial assets of between almost EUR 32,000                 pensions and securities, although the latter
                                   and EUR 87,400, and on the other, there are                 still dominate with a share of more than
                                   the poorer countries of Asia, Latin America                 37%. In the LWCs, by far the majority of as-
                                   and eastern Europe, where the same figure                   sets (63%) are held in bank deposits – as was
                                   comes in at only somewhere between EUR                      already the case before the outbreak of the
                                   2,430 and EUR 6,620; without the four HWCs                  financial crisis – and in MWCs, too, bank
                                   of Israel, Japan, Taiwan and Singapore, the                 deposits still account for more than 40% of
                                   corresponding value for Asia’s emerging                     all financial assets.
                                   markets actually comes in at only EUR 2,320.
Allianz Global Wealth Report 2012


Nevertheless, more security-focused than            723 million people fall into the wealth middle
return-oriented investment strategies have          class                                                                           11

since become something of a global trend.           The analysis of wealth distribution by coun-
Bank deposits have upped their share of glo-        try neglects to take account of differences
bal financial assets by almost five percent-        within individual countries. Consequently,
age points over the past decade and, in some        the Allianz Global Wealth Report has also
cases, have been reaping above-average ben-         calculated the average net per capita fi-
efits in richer regions like Australia, western     nancial assets per population decile within
Europe and North America. But as far as the         the countries analyzed. According to this
need for long-term wealth accumulation is           calculation, 723 million people worldwide
concerned, the tendency to “flee” to low-risk       belonged to the global wealth middle class
investments appears counterproductive.              in 2011 (net per capita financial assets of be-
This is why a fast solution to the debt crises is   tween EUR 4,500 and EUR 26,800). This figure
an absolute must if investor confidence is to       has more than doubled since 2000. The new
make a comeback.                                    wealth middle class is being recruited al-
                                                    most exclusively from the emerging markets,
Debt reduction making slow but sure progress        which now account for just under 55% of the
As with savings habits, the differences             middle class (2000: a good 16%).
in borrowing behavior are similarly pro-
nounced. The lion’s share of personal debt          428 million people in the world can be
has been accumulated in the HWCs: they ac-          deemed to belong to the wealth upper class;
count for just under 80% of global debt. This       unlike the middle class, this figure has
is also, however, where debt growth is the          dipped slightly since 2000. While the propor-
lowest, especially since the financial crisis:      tion of people who fall into the high-wealth
over the past four years, the average growth        category and do not live in the industrialized
rate in the HWCs was only 0.6% a year, where-       nations fell in both absolute (+15 million)
as the MWCs and LWCs achieved rates of 3.9%         and relative (+3.5 percentage points) terms,
and 21.0% a year respectively. This means           the number of “rich people” in the industrial-
that the debt ratio has been reduced, at least      ized nations has fallen by around 32 million.
in the HWCs, compared with 2007. Follow-            Financial crisis and debt excesses leave a
ing a further increase in the rate in 2008 and      distinct mark.
2009, it has finally fallen, also in the MWCs,
by a total of around two percentage points          Not least given the above, it proves revealing
over the past two years. In the LWCs, on the        to adopt an approach that allows country-
other hand, the rate has continued to climb         specific factors to be assessed and analyzed
over the years, reaching 26.2% at the end of        in a regional context. This is why, after pro-
2011. This still, however, leaves it a long way     viding an overview of the development and
off the global rate of 67.0%.                       distribution of financial assets in a global
                                                    context, the second part of the Allianz Global
                                                    Wealth Report addresses these issues at
                                                    regional level.
Development of
global financial assets


Personal assets
in the shadow of
the crisis
Foreword . Summary . Development of global financial assets . How global financial assets are distributed . Regional differences . Literature . Appendix


14                       Two years of strong growth, in which the asset                                 ing and sustainable political solution to the euro
                         losses inflicted by the financial crisis 2007/2008                             crisis failed to emerge. This sort of situation can
                         were compensated for, at least at global level,                                spur marked changes in savings behavior that
                         were followed by a 2011 that came as a disap-                                  is then reflected in corresponding investment
                         pointment, especially for savers in the industri-                              portfolio shifts: a preference for liquidity and
                         alized nations.                                                                the need for security tend to be higher up on
                                        The escalation of the euro crisis and the                       the list of priorities than returns and yields in
                         stock market crash in the summer of last year left                             uncertain times. Given the emerging “pensions
                         a real mark on the assets of private households.                               crisis” fueled by demographic change, this trend
                         Especially in the south of Europe, households                                  can only be viewed with mixed feelings. There is
                         have been forced to digest sometimes substan-                                  a risk that, in the long run, these savings efforts
                         tial losses. In these countries, savers have been                              will prove insufficient to guarantee financial se-
                         feeling the impact of the euro crisis in their wal-                            curity in old age.
                         lets for some time now. But it is not only in the                                            But for all of the shadows cast on as-
                         crisis-ridden countries that the impact is being                               set development in the industrialized nations,
                         clearly felt. In many countries, the historically                              2011 shed light on the other side of the story: the
                         low interest rates spelled negative real returns                               catch-up process in the emerging economies
                         and made it increasingly difficult for savers to                               continued virtually unrelentingly.
                         find investment opportunities that would at least
                         guarantee the preservation of their assets in real
                         terms. At the same time, volatility has remained
                         high throughout all asset classes as a convinc-


                         Global financial assets: Catch-up process loses momentum
                         Net financial assets and liabilities, in EUR bn                                Net financial assets and liabilities per capita, in EUR


                          100,000                                                                        22,000

                           90,000                                                                        20,000

                           80,000                                                                        18,000

                                                                                                         16,000
                           70,000
                                                                                                         14,000
                           60,000
                                                                                                         12,000
                           50,000
                                                                                                         10,000
                           40,000
                                                                                                           8,000
                           30,000
                                                CAGR* 2001-2011:                                           6,000              CAGR* 2001-2011:
                           20,000               Net financial assets: 	         +3.4% p.a.                                    Net financial assets: 	         +2.5% p.a.
                                                                                                           4,000
                                                Liabilities: 	                  +5.5% p.a.                                    Liabilities: 	                  +4.6% p.a.
                           10,000               Gross financial assets: 	       +4.0% p.a.                 2,000              Gross financial assets: 	       +3.1% p.a.
                                    0                                                                             0
                                	       ’00 	’01 	’02 	 ’03 	’04 	’05 	 ’06 	’07 	 ’08 	’09	 ’10	 ’11         	       ’00 	’01 	’02 	 ’03 	’04 	’05 	 ’06 	’07 	 ’08 	’09	 ’10	 ’11

                         *CAGR = Compound Annual Growth Rate                                                                                                     Liabilities
                         Source: National Central Banks and Statistical Offices, UN, Allianz SE.                                                       Net financial assets
Allianz Global Wealth Report 2012


        This also, however, implies a different               The disappointing development is all                                15

debt trend, as well. Whereas many of the world’s      the more evident if we look at private financial
industrialized nations focused more on delev-         assets in per capita terms. In 2011, just under
eraging, personal debt levels on the emerging         EUR 21,500 could be attributed to each global
markets continued on an upward trajectory. As         citizen, a figure that was up by 0.8% on 2010. This
a result, many of these countries have seen the       means that the previous high reported in 2007
debt ratio (liabilities as percent of GDP) climb      (EUR 21,180 per capita) was actually outstripped
steeply in recent years, sometimes to a point         by 1.5%. All in all, however, gross per capita fi-
that is verging on critical.                          nancial assets have been increasing by only 3.1%
                                                      a year since the beginning of the new millen-
Global asset growth moves down a gear                 nium, i.e. at exactly the same pace as average
Global gross financial assets grew by only 1.6% in    global inflation. This means that, on average,
2011, down considerably on the average growth         savers worldwide have not been able to achieve
rates for the two previous years (7.3% per an-        any real asset growth over the past eleven years.
num). In absolute terms, the asset base reached       Sobering news.
a new high of EUR 103.3 trillion.
        All in all, global financial assets have      Debt growth slowed in its tracks
been growing at an average rate of 4.0% a year        Gross financial assets tell only one side of the
since 2000, somewhat ahead of the global infla-       wealth story; the other side is about debt. Debt
tion rate for the same period (3.1%) but slower       also reached a new record high in 2011 at EUR
than the growth in global economic output,            31.8 trillion, up by 2.2% on a year earlier and out-
which has increased by around 5.1% a year in          stripping growth in gross financial assets again
nominal terms over the same period. So overall,       for the first time in three years. Nevertheless,
wealth development has been somewhat disap-           the global debt trend also bears the hallmarks
pointing over the past eleven years. Savers are       of the crisis: whereas in the period from 2003
having to pick up the bill – in the form of lost      to 2007, debt grew at a rate of 8.1% a year, post-
return opportunities – for the ever faster succes-    crisis growth (2008 to 2011) has only averaged
sion of financial crises – from the stock market      2.4%. This has resulted in an improvement in the
slump at the start of the decade when the dot-        global debt ratio (liability of private households
com bubble burst to the Lehman shock and the          as percent of global GDP) to 67.0% of late, after
current euro crisis. In a sustainable world, assets   touching a high of 71.8% in 2006. In this sense,
should be achieving returns that are roughly in       the deleveraging of private households is cer-
line with nominal growth; then there would be         tainly progressing, with the relative debt burden
annual wealth formation, i.e. savings, of around      slowly but surely becoming lighter.
2% of the global economic output. Based on these
rather conservative assumptions, today’s global
financial assets would be around EUR 26 trillion
or a good quarter higher.
Foreword . Summary . Development of global financial assets . How global financial assets are distributed . Regional differences . Literature . Appendix


16                                 If we subtract debt from the gross fi-                       Analyses based on wealth classes
                         nancial assets, we are left with the net financial                     In order to paint a more sophisticated picture of
                         assets. Net financial assets had climbed to EUR                        global wealth distribution by country, the Alli-
                         71.5 trillion by the end of 2011 (+1.4%). Given the                    anz Global Wealth Report has split the countries
                         debt momentum in the past, it comes as little                          evaluated into three wealth classes, similar to
                         surprise that the growth in net financial assets                       the income classes used by the World Bank: high
                         has lagged behind the growth in gross financial                        wealth countries (HWC) with average net per
                         assets (4.0%) at an average rate of 3.4% a year over                   capita financial assets of more than EUR 26,800;
                         the entire period starting in 2000. In per capita                      middle wealth countries (MWC), net per capita
                         terms, the annual growth rate drops back to                            financial assets of between EUR 4,500 and EUR
                         2.5%, far lower than the rate of inflation. At EUR                     26,800; and low wealth countries (LWC), net per
                         14,880 per capita, net financial assets at the end                     capita financial assets of less than EUR 4,500
                         of 2011 were also still slightly down on the his-                      (for information on how the wealth classes are
                         torical high reached in 2007. So despite the fact                      determined, see Appendix A).
                         that debt growth has at least been contained in
                         recent years, the efforts made in this respect still
                         appear to be far from sufficient, given the weak
                         development in gross financial assets, to achieve
                         any sustainable asset growth.


                         Power shift
                         Share of global net financial assets by country groups, in %


                          100


                           90


                           80


                           70


                           60
                                                                                                                                                LWC
                                                                                                                                               MWC
                           50                                                                                                                  HWC
                            	   ’00 	   ’01 	   ’02 	   ’03 	   ’04 	   ’05 	   ’06 	   ’07 	    ’08 	   ’09	   ’10	   ’11


                         Source: National Central Banks and Statistical Offices, UNU WIDER, World Bank, Allianz SE.
Allianz Global Wealth Report 2012


Huge global prosperity gap                                                   Different catch-up processes                                                                17

The result is anything but surprising. Wealth is                             Despite these vast differences, however, the last
distributed very unevenly throughout the world.                              eleven years have not been a lost decade for the
It is still the case that around 85% of global net                           world’s poorer countries. Net per capita financial
financial assets are in the hands of private                                 assets in the LWCs has been growing by almost
households in the HWCs – although these coun-                                16% a year since 2000, a good eight times faster
tries only account for 18% of the total population                           than in the HWCs. These sizeable differences in
and around 60% of global economic output. The                                growth are closely linked to the varying impact
trend is, nevertheless, moving in the “right” di-                            of the financial crises. The assets of poorer coun-
rection: the HWCs’ share of the global wealth                                tries managed to escape these crashes virtually
cake has shrunk by a good 8 percentage points                                unscathed. This becomes particularly clear if
since 2000, meaning that poorer countries are                                we compare the development in financial assets
gaining ground.                                                              in the HWCs since the financial crisis directly
               The global prosperity gap is huge from                        with the development in the LWCs: while net per
a per capita perspective, too. At EUR 70,590, net                            capita financial assets in the poorer countries
per capita financial assets in the HWCs at the                               have risen by almost 38% since the end of 2007,
end of 2011 were several times greater than in                               average per capita financial assets in the HWCs
the LWCs, where they averaged only EUR 2,040.                                were still 3.2% lower than the pre-crisis level at
People in MWCs had average financial assets                                  the end of 2011.
worth EUR 10,240.


Big prosperity gap
Net financial assets per capita, in EUR
High Wealth Countries                              Middle Wealth Countries                           Low Wealth Countries


  80,000                                            11,000                                             2,200
                                                    10,000                                             2,000
  70,000
                                                      9,000                                            1,800
  60,000                                              8,000                                            1,600

  50,000                                              7,000                                            1,400
                                                      6,000                                            1,200
  40,000
                                                      5,000                                            1,000
  30,000                                              4,000                                              800

  20,000                                              3,000                                              600
                                                      2,000                                              400
  10,000
                                                      1,000                                              200
           0                                                 0                                                 0
       	       ’00 	   ’07 	 ’08 	 ’09	 ’10	 ’11         	       ’00 	   ’07 	 ’08 	 ’09	 ’10	 ’11         	       ’00 	   ’07 	 ’08 	 ’09	 ’10	 ’11


Source: National Central Banks and Statistical Offices, UNU WIDER, World Bank, Allianz SE.
Foreword . Summary . Development of global financial assets . How global financial assets are distributed . Regional differences . Literature . Appendix


18                                  This uneven development means that                                The catch-up process in the MWCs, on
                         the “inequality factor” between the world’s rich-                   the other hand, is much slower. Growth in net per
                         er and poorer countries, which was still hovering                   capita financial assets in this group of countries
                         at 141 in 2000, has now been pushed down to 35,                     has been “only” twice as high as in their richer
                         a development that is, without a doubt, impres-                     counterparts since 2000. This is due less to asset
                         sive and highlights some degree of convergence                      growth itself – after all, gross per capita financial
                         of financial assets, at least in relative terms. Af-                assets have also grown at twice the rate – than
                         ter all, if we look at the flip side of the coin, the               to the higher rate of debt growth, which was 2.5
                         absolute gap in net per capita financial assets                     times faster than in the HWCs. A glance at the
                         has widened from EUR 57,000 to EUR 68,550 –                         countries to which the relevant wealth groups
                         in spite of the signs of narrowing that emerged                     belong sheds light on these differences.
                         during some phases of the financial crisis. Even                             Most HWCs are located in North America
                         if the difference in growth momentum seen over                      and western Europe. As far as the other regions
                         the past ten years were to persist in the future –                  of the world are concerned, only Australia, Israel,
                         uninterrupted catch-up trend on the one hand                        Japan, Singapore and Taiwan have made it into
                         and financial crises at periodic intervals on the
                         other – it would be the mid-2020s before the ab-
                         solute differences would start to become less
                         pronounced.


                         Development of net financial assets per capita
                         Index (2000=100)


                          500           2011, in EUR
                                        70,590
                          450

                          400

                          350
                                                       10,243
                                                                     2,036
                          300

                          250

                          200

                          150
                                                                                                                                                LWC
                          100
                                                                                                                                               MWC
                           50                                                                                                                  HWC
                           	    ’00 	     ’01 	   ’02 	   ’03 	    ’04 	     ’05 	   ’06 	    ’07 	   ’08 	   ’09	     ’10


                         Source: National Central Banks and Statistical Offices, UNU WIDER, World Bank, Allianz SE.
Allianz Global Wealth Report 2012


the club of rich countries. The MWCs include not                    rael, Japan, Taiwan and Singapore, however, net                                    19

only Chile and Mexico from Latin America, and                       financial assets in Asia’s emerging markets only
Malaysia and South Korea from Asia, but also, in                    come in at EUR 2,320. On the other hand, eastern
particular, eastern European countries and eu-                      Europe achieves a value of EUR 5,070, provided
rozone crisis countries such as Greece, Ireland,                    that we include only the EU member states. The
Portugal and Spain. Some of these countries are                     average per capita assets of EUR 3,560 in Latin
characterized by high debt levels and high debt                     America reflect the progress that this region has
growth; so the subdued increase in net financial                    made in recent years (2000: EUR 1,130).
assets over the past decade comes as no surprise.                             The relative wealth situation, i.e. the
The LWCs also witnessed rapid debt growth as a                      analysis of net financial assets in relation to
group during this period, but they started at a                     economic output, is slightly different. Although
far lower level.                                                    North America leads the field in this compari-
          On the whole, however, the global                         son, too, Asia is now ahead of western Europe
wealth map paints a predictable picture; on the                     and Oceania. Without Israel, Japan, Taiwan and
one hand, we have the rich countries of North                       Singapore, however, Asia would drop back to
America, western Europe and Oceania, with av-                       well behind western Europe again, although it
erage regional per capita wealth of between EUR                     would still be in front of Oceania. The develop-
31,960 (Oceania) and EUR 87,400 (North Ameri-                       ment witnessed since 2000 is similarly striking:
ca) in net terms, and on the other, there are the                   there is only one region that has managed to
poorer countries of Asia, Latin America and                         improve this indicator over the last eleven years:
eastern Europe, where the same figure comes in
at only between EUR 2,430 (eastern Europe) and
EUR 6,620 (Asia). Without the four HWCs of Is-


Global imbalances
Net financial assets 2011, in EUR
                                                                              Eastern Europe

                                                 Western Europe
         North America
 100,000              87,401                                                                 2,434
                                                                41,241    	 ’07 	’08 	’09	 ’10	 ’11
   50,000                                                                                               Asia
         0
         	 ’07 	’08 	’09	 ’10	 ’11           	 ’07 	’08 	’09	 ’10	 ’11
                                                                                                                6,615

                                                                                            	 ’07 	’08 	’09	 ’10	 ’11

                    Latin America
                                                                                                      Oceania

                                  3,561
                                                                                                                31,956
              	 ’07 	’08 	’09	 ’10	 ’11
                                                                                            	 ’07 	’08 	’09	 ’10	 ’11

Source: National Central Banks and Statistical Offices, UN, Allianz SE.
Foreword . Summary . Development of global financial assets . How global financial assets are distributed . Regional differences . Literature . Appendix


20                       Latin America. All other regions, on the other                        under 10% (average annual growth in the period
                         hand, have suffered partially drastic setbacks,                       from 2007 to 2011). The decline in Latin America
                         most notably so in Oceania. All in all, this de-                      is even more pronounced: since 2007, the aver-
                         velopment is an impressive affirmation of how                         age growth in net per capita financial assets has
                         growth and prosperity gains have been based                           been 6.5 percentage points slower than before.
                         primarily on debt in the past.                                        This appears surprising at first glance, because
                                                                                               one would have certainly imagined the impact
                         Households in eastern Europe remain the “growth                       of the euro crisis on neighboring eastern Europe
                         champions“                                                            to have been more pronounced than on far-off
                         Nonetheless, assets have, of course, grown over                       Latin America. Once again, it pays to look at the
                         the past few years, in some cases markedly                            debt trend: in Latin America, the crisis has not
                         so. Eastern European households (region as a                          put a damper on personal debt. On the contrary,
                         whole) have witnessed the strongest growth in                         personal debt growth has continued to pick up
                         net per capita financial assets since 2000, with                      speed over the past few years. This is not the case
                         an average annual growth rate of almost 12%.                          in eastern Europe; debt momentum has tailed off
                         Eastern Europe also fared well on average in the                      considerably, especially in the eastern European
                         face of the financial crisis and by the end of 2011,                  EU countries: whereas in the years prior to the
                         per capita assets were already up by around                           crisis, annual growth rates around the 30% mark
                         44% on the pre-crisis level. Nevertheless, the fi-                    were the norm, the growth rate has amounted to
                         nancial crisis has left a visible scar. The annual                    a “mere” 5% of late.
                         growth rate has fallen during this period from
                         almost 13% before the crisis (average annual
                         growth in the period from 2000 to 2007) to just


                         Net financial assets trailing behind economic output
                         Net financial assets, as % of GDP


                                  North America


                                               Asia


                                 Western Europe


                                     Asia ex HWC


                                          Oceania


                                   Latin America

                                                                                                                                               2000
                                  Eastern Europe
                                                                                                                                               2011
                                                         0            50            100             150          200            250


                         Source: National Central Banks and Statistical Offices, Allianz SE.
Allianz Global Wealth Report 2012


          Asia’s emerging markets (Asia excl.                       the financial crisis was also much heftier: at the                         21

HWCs) have not escaped entirely unscathed ei-                       end of 2011, all three regions were still lurking
ther. At 7.9%, the average annual growth rates                      below the high achieved in 2007. And yet, despite
in the period since 2007 are still well down on                     having things in common, all three regions tell
the pre-crisis level. If we look at developments                    an entirely different story. In Oceania, where the
in the entire Asian region, this value is actually                  decline is the most substantial at around 15%,
decisively lower, at 1.8% per annum on average.                     the trend has been caused primarily by high
The low value for Asia as a whole over the past                     debt growth that exceeds the global average. In
four years is solely attributable to the standstill                 North America, net per capita financial assets
in Japan, by far the richest country in the region,                 at the end of 2011 were still down by 6.4% on the
where net per capita financial assets are actu-                     2007 level. The main culprit here lies in gross fi-
ally down by 0.6% on 2007.                                          nancial assets: the slump of 2008 hit this region
          All in all, the regional analysis also                    like no other (-17.2%); the recovery witnessed in
shows that it is precisely the poorer countries                     the years that followed was unable to make up
that have been witnessing a vast increase in                        for this shock, which is why North America is the
wealth over the past decade. The situation in                       only region in which total gross financial assets
the rich regions tells the very opposite story. Not                 are still lower than the high witnessed in 2007.
only has the growth in per capita financial assets
been far slower over the past eleven years, par-
ticularly in North America and western Europe,
where growth comes in at 2.1% and 1.3% respec-
tively, the setback inflicted on these regions by


Comparison of growth: Champion Eastern Europe
Average annual growth of net financial assets per capita, in %


        Western Europe


         North America


                 Oceania


                      Asia


          Latin America

                                                                                                           since 2000
         Eastern Europe
                                                                                                           since 2007
                	                -4                  0                    4          8              12


Source: National Central Banks and Statistical Offices, UN, Allianz SE.
Foreword . Summary . Development of global financial assets . How global financial assets are distributed . Regional differences . Literature . Appendix


22                       The fact that North America is, at the same time,                   crisis once again brought western European
                         the only region in which personal debt has been                     households to their knees: this region was the
                         cut, year after year, since the crisis is not enough                only region in the world that had to witness a
                         to pull net financial assets back up to above the                   drop in its gross financial assets. Consequently,
                         2007 level. In western Europe, the situation is a                   at the end of 2011, net per capita financial assets
                         combination of both factors. Debt continued to                      had only managed to exceed the 2007 record
                         grow, albeit at a far slower pace than before the                   high in nine out of western Europe’s 16 countries;
                         crisis, and gross financial assets also showed                      looking at the region as a whole, too, net per cap-
                         weak development. Although the direct asset                         ita financial assets slipped back into negative
                         shock of 2008 was less seismic than in North                        territory last year, down by 1.1% on 2007.
                         America and Oceania, the recovery that followed
                         was also far slower. Last year, the ongoing euro                    Conservative wealth structure in poorer countries
                                                                                             The reasons why the impact on financial assets
                                                                                             has been so varied lie, for one, in the nature of
                                                                                             the crisis itself – the financial crisis is a crisis
                                                                                             that affects developed markets, initially the US,
                                                                                             and now Europe. For another, differences in sav-
                                                                                             ings habits before the crisis also explain the
                                                                                             radical differences in asset structures and debt
                                                                                             dynamics.


                         Conservative asset structure in poorer countries
                         Asset classes as % of gross financial assets by country groups, 2011


                          100

                                                                                                                  14
                                                                                        22
                                     30                        32
                           75
                                                                                                                  19


                                                                                        34
                           50        35                        37

                                                                                                                  63

                           25                                                                                                                  Other
                                                                                        41
                                     33                                                                                                    Insurance
                                                               28
                                                                                                                                           Securities
                            0                                                                                                          Bank deposits
                                	 World	                     HWC	                      MWC	                      LWC


                         Source: National Central Banks and Statistical Offices, UNU WIDER, World Bank, Allianz SE.
Allianz Global Wealth Report 2012


          It is relatively easy to see the link be-                           There are significant differences be-                              23

tween asset structures and susceptibility to cri-                     tween the country groups on the whole as far as
sis. The higher the proportion of volatile capital                    asset structures are concerned. In the HWCs, fi-
market instruments in a portfolio, the greater                        nancial assets are distributed more or less even-
the negative impact of losses in the value of these                   ly among the three major asset classes: bank
securities on overall performance. This is why                        deposits, insurance policies/pensions and secu-
private households in the US and Greece, for ex-                      rities, although the latter dominate with a share
ample, were hit so hard in 2008: before the crisis                    of 37%. In the LWCs, by far the majority of assets
(late 2007), securities accounted for almost 60%                      (63%) are held in bank deposits – as was already
and more than 40% of financial assets in these                        the case before the outbreak of the financial
two countries respectively.                                           crisis – and in MWCs, too, bank deposits still ac-
                                                                      count for more than 40% of all financial assets.
                                                                      There is no doubt that this extremely risk-averse
                                                                      asset structure has helped the world’s poorer
                                                                      countries – even though it was not, of course, a
                                                                      conscious investment decision or a direct con-
                                                                      sequence of the financial crisis, but rather the
                                                                      result of the prevailing circumstances, i.e. the
                                                                      maturity of the individual financial systems, in
                                                                      the majority of cases.


Increasing risk aversion
Asset classes as % of global gross financial assets


100


         29                           29            29            30           30          30
  75


  50                                                35                         36          35
         41                           41                          36


  25                                                                                                             Other

                                                    33            32                       33                Insurance
         28                           27                                       31
                                                                                                             Securities
   0                                                                                                     Bank deposits
       	 2000	                      2007	          2008	         2009	        2010	       2011


Source: National Central Banks and Statistical Offices, Allianz SE.
Foreword . Summary . Development of global financial assets . How global financial assets are distributed . Regional differences . Literature . Appendix


24                       Increase in risk aversion across the globe                                   Securities are the biggest victims of
                         The financial and debt crisis has meant that the                   this trend: they are losing ground in almost all
                         increased investor focus on security as opposed                    global regions, even in the poorer ones. It is only
                         to on returns is by no means a characteristic that                 in Latin America that investors have remained
                         describes only the world’s poorer countries. This                  faithful to this asset class, largely due to the im-
                         trend is now being observed across the globe.                      proved performance on stock exchanges in the
                         While securities have become much less popu-                       region.
                         lar among investors, bank deposits have upped                                By contrast, insurance policies and pen-
                         their share of global financial assets by almost                   sions have gained asset share, reaping the ben-
                         5 percentage points since the start of the new                     efits from the trend towards more secure invest-
                         millennium. This reflects the increasing mood                      ment products. There is no region in which this is
                         of risk aversion among investors globally. This                    more pronounced than in (western and eastern)
                         does not, however, apply equally to all regions                    Europe, where this asset class has been given an
                         and countries. In actual fact, the global figures                  additional boost by the sometimes far-reaching
                         hide some very striking regional differences.                      pension reforms implemented in recent years. It
                                    Bank deposits, for example, have start-                 would appear that a large number of savers are
                         ed to account for an increasing proportion of as-                  now aware of the possible impact of demograph-
                         set portfolios in richer regions such as Oceania,                  ic change on prosperity in old age. The story in
                         western Europe and North America, in particu-                      Latin America is a similar one, whereas in Asia
                         lar. Here, where many households already have                      developments are being overshadowed mainly
                         substantial assets, the fear of loss is acute; at the              by the widespread stagnation in Japan.
                         same time, these regions are (or were) in the fir-                           The fact that insurance and pension
                         ing line during the recent crises. This has fueled                 products are only gaining relatively minimal
                         considerable uncertainty surrounding what is                       market share in a global comparison is due pri-
                         in store for the capital markets, luring investors                 marily to the climate on the world’s two biggest
                         into assuming a wait-and-see stance and stick-                     markets for these products, Japan and the US.
                         ing by a preference for liquidity.                                 Although insurance and pension products have
                                                                                            formed a key component of retirement provision
                                                                                            for some time now, they have been unable to fur-
                                                                                            ther expand their position in recent years. What
                                                                                            is more, these products are not necessarily seen
                                                                                            as a safe haven for turbulent times, because
                                                                                            many, such as variable annuities, are explicitly
                                                                                            tied to the capital market.
Allianz Global Wealth Report 2012


                     Looking at the sovereign debt crisis and                                                                                                    ly) low-risk investments, such as bank deposits,                                                                                                        25

the dramatic changes in the age structure of                                                                                                                     witnessed in many countries is counterproduc-
many European countries, however, it remains                                                                                                                     tive. The fact that savers are shying away from
to be seen whether the reforms and the reac-                                                                                                                     investments that offer the sort of returns they
tions in terms of savings habits will prove suf-                                                                                                                 need means that they have to save even harder
ficient. Our calculations definitely suggest that                                                                                                                in order to create a sufficiently comfortable fi-
the “pension gap” is still very much present. If no                                                                                                              nancial cushion. A responsible approach to pro-
further changes are made to the overall (tax) en-                                                                                                                vision ultimately involves a certain degree of
vironment, there is a real danger that many pri-                                                                                                                 risk-taking.
vate households will fail to accumulate the level                                                                                                                                       Winning back savers’ trust in the fi-
of savings that they need for the future. As far as                                                                                                              nancial markets and long-term investment is
the need for long-term wealth accumulation is                                                                                                                    crucial. After all, the longer it takes to restruc-
concerned, the tendency to “flee” to (supposed-                                                                                                                  ture the financial markets and find a sustain-
                                                                                                                                                                 able solution to the euro crisis, in particular, the
                                                                                                                                                                 greater the risk of “losing” a whole generation of
                                                                                                                                                                 savers because the idea of long-term investment
                                                                                                                                                                 is eyed with deep mistrust.


Asset classes benefit differently
Change of asset classes’ share of gross financial assets between 2000 and 2011, in percentage points
Bank deposits                                                                                  Securities                                                                                          Insurance
7                                                                                                5                                                                                                  8


6
                                                                                                                                                                                                    6
                                                                                                 0
5
                                                                                                                                                                                                    4
4                                                                                               -5

                                                                                                                                                                                                    2
2
                                                                                               -10
1                                                                                                                                                                                                   0


0                                                                                              -15                                                                                                 -2
    Latin America
                    Asia
                           Eastern Europe
                                            North America
                                                            Western Europe
                                                                             Oceania


                                                                                       World


                                                                                                     Oceania
                                                                                                               Western Europe
                                                                                                                                Eastern Europe
                                                                                                                                                 North America
                                                                                                                                                                 Asia
                                                                                                                                                                        Latin America


                                                                                                                                                                                           World


                                                                                                                                                                                                        North America
                                                                                                                                                                                                                        Asia
                                                                                                                                                                                                                               Latin America
                                                                                                                                                                                                                                               Western Europe
                                                                                                                                                                                                                                                                Eastern Europe
                                                                                                                                                                                                                                                                                 Oceania


                                                                                                                                                                                                                                                                                               World


Source: National Central Banks and Statistical Offices, Allianz SE.
Foreword . Summary . Development of global financial assets . How global financial assets are distributed . Regional differences . Literature . Appendix


26                       Start of deleveraging in the rich countries                                    around 73% if we compare the four years prior to
                         The differences in borrowing behavior are simi-                                the financial crisis with the four years that fol-
                         larly pronounced to those affecting asset struc-                               lowed. The ratio of liabilities to economic output
                         tures. Not surprisingly, the lion’s share of per-                              had fallen to 67.3% at the end of last year, putting
                         sonal debt has been accumulated in the HWCs:                                   it 2.1 percentage points short of the record value
                         they account for just under 80% of global debt.                                seen in 2009. In the LWCs, on the other hand, the
                         An analysis of debt development, however, is                                   debt ratio has continued to climb over the years,
                         more interesting. Since 2000, personal debt in                                 reaching 26.2% at the end of 2011. This still, how-
                         the HWCs has been growing at an average rate                                   ever, puts it well below the global figure: global
                         of 4.3% a year, whereas in the MWCs and LWCs,                                  private household debt came in at 67.0% of eco-
                         the rate of growth comes in at 10.0% and 18.3%                                 nomic output at the end of 2011.
                         respectively. The differences over the past four                                          Nowhere were the debt levels of private
                         years are even more striking, however: the aver-                               households higher than in Australia and New
                         age growth rate in the HWCs was only 0.6% a year,                              Zealand, where this sort of debt corresponded to
                         whereas the MWCs and LWCs achieved rates of                                    around 109% of GDP. Oceania is the only richer
                         3.9% and 21.0% respectively. Since nominal eco-                                region in the world where debt has been growing
                         nomic output in HWCs grew twice as fast as the                                 at double-digit rates on average since the turn of
                         liabilities in the same period (+1.2% per year on                              the millennium. By far the biggest debt culprits,
                         average), 2.1 percentage points could be sliced                                however, are eastern European households, with
                         off the debt ratio. But private households in the
                         MWCs also made progress as far as deleverag-
                         ing is concerned: the pace of debt growth fell by


                         Dynamic of indebtedness stopped in the HWC and MWC
                         Development of global debt burden,                                             Development of global debt burden,
                         in EUR bn                                                                      as % of GDP

                           35,000                                                                       100

                                                                                                         90
                           30,000
                                                                                                         80

                           25,000                                                                        70

                                                                                                         60
                           20,000                                                                                                                                World
                                                                                                         50                                                        LWC
                           15,000                                                                        40                                                       MWC
                                                                                                                                                                  HWC
                           10,000                                                                        30

                                                                                                         20
                            5,000
                                                                                                         10

                                    0                                                                     0
                                	       ’00 	’01 	’02 	 ’03 	’04 	’05 	 ’06 	’07 	 ’08 	’09	 ’10	 ’11    	 ’00 	 ’01 	 ’02 	 ’03 	 ’04 	 ’05 	 ’06 	 ’07 	 ’08 	 ’09	 ’10	 ’11


                         Source: National Central Banks and Statistical Offices, UNU WIDER, World Bank, Allianz SE.
Allianz Global Wealth Report 2012


average debt growth to the tune of almost 27% a                                             Eastern Europe is by no means an iso-                                           27

year. This breathtaking growth is due to two fac-                             lated case when it comes to the slowdown in debt
tors: first, the debt level is still relatively low, while                    accumulation in the aftermath of the financial
second, the opening of the banking markets as a                               crisis. This phenomenon is being observed in
result of accession to the EU and the low-interest                            almost all regions across the globe. In the US,
loans in foreign currencies (Swiss francs or eu-                              which is still the world’s largest “debt market“,
ros) has made it far easier for private households                            households have actually reduced their debt on
to access loans. The financial crisis, however,                               the whole over the past four years – also thanks
has changed this situation profoundly; after                                  to payment defaults and write-downs on prop-
virtual stagnation in 2009, debt grew by “only”                               erty loans: their debt levels are now sitting at
around 13% in total last year – with increasing                               5.4% below the pre-crisis level. In addition to the
differences emerging between individual coun-                                 US, there are six other countries in which loans
tries in the region: at present, only Russia, Tur-                            have been reduced in absolute terms during
key and, to a lesser extent, Poland are witnessing                            this period: Japan, Ireland, Spain, Estonia, Latvia
rapid growth in personal debt, whereas in other                               and Kazakhstan. This means that, thanks to the
countries such as the Baltic states, Bulgaria or                              turnaround in debt momentum, the debt ratio
Hungary, debt is already headed south.                                        was reduced in all regions last year – with one
                                                                              sole exception: at the end of 2011, Latin America
                                                                              had reached a record high in relative debt; every-
                                                                              where else, deleveraging would appear to be the
                                                                              order of the day.


Development of liabilities by region
Liabilities, indexed (2000=100)                                  Liabilities as % of GDP


1,300    Per capita in EUR, 2011                                  120
                                                                  110
                                 40.000
1,100                                                             100
                                 20.000                             90
  900                            0                                  80
                                                                    70                                                             Eastern Europe
  700                                                               60                                                               Latin America
                                                                    50                                                                    Oceania
  500                                                               40                                                              North America
                                                                    30                                                             Western Europe
  300                                                               20                                                                        Asia
                                                                    10                                                               Asia ex HWC
  100                                                                0                                                                      World
     ’
     	00 	’01 	’02 	’03 	’04 	’05 	’06 	’07 	’08 	’09	 ’10	’11        	’00 	’01 	’02 	’03 	’04 	’05 	’06 	’07 	’08 	’09	 ’10	’11


Source: National Central Banks and Statistical Offices, UN, Allianz SE.
How global financial
assets are distributed


How big is the
world’s middle class
in terms of wealth?
Foreword . Summary . Development of global financial assets . How global financial assets are distributed . Regional differences . Literature . Appendix


30                          Social classes are normally identified in terms                                                    Consequently, our definition of the
                            of income, meaning that the middle class is de-                                        global wealth middle class is based not on the
                            fined by how much it earns. By contrast, there                                         standard income classes, but on global average
                            is no system that divides society into “wealth                                         per capita wealth. This year, however, we will
                            classes”.                                                                              also be focusing on the net figures when we
                                                             But there is certainly a link between dis-            put the various wealth classes under the micro-
                            posable income and wealth. Households have to                                          scope. Average net per capita assets came in at
                            exceed a certain income level before accumulat-                                        EUR 14,880 in 2011. We have defined the middle
                            ing wealth is even an option.                                                          wealth countries (MWCs) as those countries that
                                                              As a general rule, people in lower in-               own between 30% and 180% of average global per
                            come groups and some of the (income) middle                                            capita wealth. In terms of the average income
                            class have either no, or only very few assets. This                                    threshold for the MWCs, the lower threshold
                            means that the terms “income middle class”                                             for net per capita assets in 2011 stands at EUR
                            and “wealth middle class” do not refer to the                                          4,500. The HWCs include countries with average
                            same group of people; rather, the distribution                                         per capita assets of EUR 26,800 or more. In gross
                            of income and wealth vary considerably: while                                          terms, the thresholds are EUR 6,400 and EUR
                            around one third of the population earns half                                          38,700 (see Appendix A for information on how
                            of the population’s total income, only 10% of the                                      the wealth thresholds are determined).
                            population owns half of its assets on average.


                            Strong correlation between economic output and wealth
                            Net financial assets of households and GDP per capita 2011, in EUR


                                                          100,000
                                                                                                                                     USA      Japan
                                                           80,000

                                                                                                                                Belgium
                        Net financial assets per capita


                                                                                                                                               Netherlands
                                                           60,000                                                                Singapore       Canada

                                                                                                                                                                Denmark
                                                                                                                              France
                                                                                                                   Italy                               Sweden
                                                           40,000                                                          Germany           Austria
                                                                                       Mexico
                                                                                                                                              Ireland
                                                                      Malaysia
                                                           20,000                                      Portugal                                 Finland
                                                                     Romania             South Korea               Spain
                                                                Thailand                 Chile           Greece
                                                             Indonesia                        Czech Republic               New Zealand
                                                                             Peru        Hungary
                                                               0      Kazakhstan       Brazil
                                                                    0   5,000       10,000   15,000     20,000    25,000     30,000        35,000      40,000   45,000
                                                                                                       GDP per capita

                            Source: National Central Banks and Statistical Offices, UN, Allianz SE.
Allianz Global Wealth Report 2012


The new wealth middle class                                                 In gross terms, 20 out of the 52 countries                           31

Government debt levels in many industrialized                     in our analysis fall into the HWC category. The
nations are the hot topic on everyone’s minds at                  category consists almost exclusively of estab-
the moment, but what sort of shape are private                    lished industrialized nations (plus Singapore
households in? We want to delve further into                      and Taiwan). But it is precisely in those industri-
this issue in our analysis of the global wealth                   alized nations with highly developed financial
middle class. If we include liabilities in our                    systems that household debt is also at its high-
analysis, which countries still make it into the                  est. Average per capita debt in these countries
high or middle wealth group? Have countries                       amounts to EUR 27,670, compared with only
been forced out of the group of HWCs or MWCs                      EUR 970 on the emerging markets. While it goes
in recent years due to their liabilities and how                  without saying that this debt is often offset by
has the distribution of wealth in these countries                 real assets, capital and interest payments still
changed since 2000?                                               have to be made using current income. The cri-
                                                                  sis in particular – which sent house prices tum-
                                                                  bling in some places – has left no doubt as to one
                                                                  fact: debt is still debt, i.e. liabilities that have to
                                                                  be paid back no matter what.


Uneven distribution
Share of global net financial assets (52 countries, 4.8bn people), by population deciles in %
Decile with lowest wealth                                                                    Decile with highest wealth

                                                                                                                    55


                                                                                                        17

                                                                                             10
                                                                                 7
                                                                    5
                                          2            3
     0         0             1

   	 1.	       2.	          3.	           4.	          5.	          6.	          7.	         8.	         9.	        10.


Source: National Central Banks and Statistical Offices, UNU WIDER, World Bank, Allianz SE.
Foreword . Summary . Development of global financial assets . How global financial assets are distributed . Regional differences . Literature . Appendix


32                                 In Finland, Norway and Ireland, house-                   asset growth (11.7% a year) unable to keep step
                         hold debt levels mean that these countries are                     with these rates. The crisis then put incomes
                         still only classed as MWCs in net terms. Finn-                     under pressure, making the process involved
                         ish households have debt averaging EUR 23,940                      in reducing these liabilities a slower one. Since
                         per capita, with Irish per capita debt coming in                   2009, however, liabilities have been falling and
                         at EUR 40,790 and the Norwegians sitting on as                     financial assets gradually rising again, mean-
                         much as EUR 66,080 of debt each. This explains                     ing that in 2011, Ireland was only a whisker away
                         why, at EUR 6,510 net, Norway’s households also                    from making it back into the HWC group, with
                         have the lowest per capita assets in Europe.                       average net assets to the tune of EUR 25,460 per
                         Whereas Finland (EUR 19,100 per capita) and                        capita. In the other European countries marred
                         Norway have been members of the MWCs for                           by the crisis, on the other hand, there is no in-
                         some time now in net terms, Ireland was not                        dication of a turnaround yet: net per capita as-
                         relegated to this group until 2007. Private house-                 sets in Greece, Portugal and Spain continued on
                         hold debt in Ireland swelled by more than 22%                      a downward trajectory last year. Nevertheless,
                         a year between 2000 and 2007, with financial                       these three countries were not HWC members
                                                                                            in terms of net assets even before the crisis hit;
                                                                                            while Portugal and Spain could be counted as
                                                                                            HWCs in gross terms, they lost this status in
                                                                                            2010 and 2011 respectively.


                         Classification of countries by net financial assets per capita

                                            HWC                                     MWC                                        LWC
                                        Australia                                   Chile                                  Argentina
                                         Austria                                   Croatia                                   Brazil
                                         Belgium                               Czech Republic                               Bulgaria
                                         Canada                                    Estonia                                   China
                                        Denmark                                   Finland                                  Colombia
                                          France                                   Greece                                     India
                                        Germany                                   Hungary                                  Indonesia
                                           Israel                                  Ireland                                Kazakhstan
                                            Italy                                 Malaysia                                   Latvia
                                          Japan                                    Mexico                                  Lithuania
                                       Netherlands                                 Norway                                 New Zealand
                                        Singapore                                 Portugal                                    Peru
                                         Sweden                                   Romania                                    Poland
                                       Switzerland                                Slovenia                                   Russia
                                         Taiwan                                 South Korea                                 Slovakia
                                             UK                                     Spain                                 South Africa
                                            USA                                                                             Thailand
                                                                                                                             Turkey
                                                                                                                            Ukraine

                         Source: National Central Banks and Statistical Offices, UNU WIDER, World Bank, Allianz SE.
Allianz Global Wealth Report 2012


         Personal debt is not, however, a “privi-           Obviously, a long development process                             33

lege” of the European crisis states. Brazil had     lies ahead before the average per capita assets
just made it into the MWC club in gross terms,      of a country’s entire population can surpass the
but remains a LWC with net per capita assets        middle or even high wealth threshold. This is
of EUR 2,980. Other countries that lost their net   why we have opted to look at wealth distribution
MWC status are Lithuania, New Zealand, Poland       within a country in terms of deciles. In order to
and Slovakia, where the credit boom had taken       do so, we have to make assumptions as to how
on huge proportions in recent years.                wealth is distributed within a country. In their
                                                    studies, Davies et al. (2009) showed that, despite
                                                    the differences, there is a stable link between
                                                    income and wealth distribution. We have used
                                                    this link to draw conclusions as to wealth distri-
                                                    bution in the countries we have analyzed based
                                                    on income distribution levels in these countries.
                                                    This involved “converting” income deciles into
                                                    wealth deciles to calculate the average wealth
                                                    per population decile.
Foreword . Summary . Development of global financial assets . How global financial assets are distributed . Regional differences . Literature . Appendix


34                                   Based on this breakdown, 723 million                             But the growth of the middle class is
                         people with medium net assets currently live                       not a success story for everyone, because it does
                         in the countries included in our analysis. This                    not spell a scenario in which there are only win-
                         equates to a respectable 15% of the total popu-                    ners. Particularly in those countries that have
                         lation. The momentum driving the rise of the                       set the stage for a massive increase in debt in
                         global middle class is astounding: over the past                   recent years and whose financial assets have
                         eleven years, the emerging markets, in particu-                    been hit hard by the crisis, there are now fewer
                         lar, have been witnessing an economic boom                         people of “high wealth” than there were at the
                         that has also had a very positive impact on the                    start of the millennium. These countries include
                         wealth of the population at large. In 2000, only                   New Zealand, Belgium, Finland, Ireland, Nether-
                         just under 8% (340 million) of the world’s popu-                   lands, Spain and the UK. But it is not only higher
                         lation was classed as falling into the middle                      debt levels that have slashed the number of rich
                         wealth category. Almost 50% of people in the                       people in the HWCs: in Japan, the US, Germany,
                         middle wealth bracket come from countries that                     Greece and Switzerland the number of high-
                         are considered to be low wealth countries on av-                   wealth individuals, based on gross assets, is also
                         erage (355 million). In 2000, only 10% of middle                   lower than in 2000.
                         wealth individuals were from the LWCs, with al-
                         most 70% coming from the HWCs (2011: 37%).


                         Over 1bn people around the globe own more than EUR 4,500 net
                         Population (52 countries analyzed), in million


                            3,656


                                                     723
                                                                             428                                                               HWC
                                                                                                                                               MWC
                                                                                                                                                LWC
                     	     <4,500	              4,500 - 26,800	            >26,800          Net financial assets per capita, in EUR


                         Source: National Central Banks and Statistical Offices, UNU WIDER, World Bank, Allianz SE.
Allianz Global Wealth Report 2012


          This means that around 50 million peo-                                                                            35

ple who we used to classify as “rich” are now
members of the wealth middle class (net assets).
Consequently, 13% of the growth in the mid-
dle class is attributable to the reduction in the
wealth upper class.
          In total, only 428 million people fall into
the high-wealth category today, 18 million, or
4%, down on 2000. As in the past, the vast major-
ity (383 million) come from HWCs (89%). As with
the wealth middle class, however, this propor-
tion is shrinking. As many as 11% or 45 million of
the high-wealth individuals come from poorer
countries. Eleven years ago, this group made up
no more than 7% (31 million) of the high-wealth
group. This means that economic success and
population growth in these countries – which,
particularly in the MWCs, are higher than in the
HWCs – have not been sufficient to make up for
the decline in the number of high net wealth in-
dividuals.


Growing wealth middle class mainly comes from LWC
Population (52 countries analyzed) by wealth classes, in million


                                               270


                                                98


       237
                                               355

                                                                                             HWC
        65                                                                                   MWC
        38                                                                                   LWC
	      2000	                                   2011


Source: National Central Banks and Statistical Offices, UNU WIDER, World Bank, Allianz SE.
Regional differences


Financial assets in
individual regions


	38	   Latin America
	46	   North America
	54	   Western Europe
	66	   Eastern Europe
	74	   Asia
	84	   Australia and New Zealand
Foreword . Summary . Development of global financial assets . How global financial assets are distributed . Regional differences . Literature . Appendix


38
Latin America

Population
Total  ·  ·  ·  ·  ·  ·  ·  ·  ·  ·  ·  ·  ·  ·  ·  ·  ·  ·  ·  ·  ·  ·  ·  ·  ·  ·  ·  ·  ·  ·  ·  ·  ·  ·  ·  ·  ·  ·  ·  ·  ·  ·  ·  ·  ·  ·  ·  ·  ·  ·  ·  ·  ·  ·  ·  ·  ·  ·  ·  ·  ·  ·  ·  ·  ·  ·  ·  ·  ·  ·  ·  ·  ·  ·  · 446 m
Proportion of the region as a whole ·  ·  ·  ·  ·  ·  ·  ·  ·  ·  ·  ·  ·  ·  ·  ·  ·  ·  ·  ·  ·  ·  ·  ·  ·  ·  ·  ·  ·  ·  ·  ·  ·  ·  ·  ·  ·  ·  ·  ·  ·  ·  ·  ·  ·  · 77%
Proportion of the global population · ·  ·  ·  ·  ·  ·  ·  ·  ·  ·  ·  ·  ·  ·  ·  ·  ·  ·  ·  ·  ·  ·  ·  ·  ·  ·  ·  ·  ·  ·  ·  ·  ·  ·  ·  ·  ·  ·  ·  ·  ·  ·  ·  ·  · 6.5%

GDP
Total  ·  ·  ·  ·  ·  ·  ·  ·  ·  ·  ·  ·  ·  ·  ·  ·  ·  ·  ·  ·  ·  ·  ·  ·  ·  ·  ·  ·  ·  ·  ·  ·  ·  ·  ·  ·  ·  ·  ·  ·  ·  ·  ·  ·  ·  ·  ·  ·  ·  ·  ·  ·  ·  ·  ·  ·  ·  ·  ·  ·  ·  ·  ·  ·  ·  ·  ·  · EUR 3,370bn
Proportion of the region as a whole ·  ·  ·  ·  ·  ·  ·  ·  ·  ·  ·  ·  ·  ·  ·  ·  ·  ·  ·  ·  ·  ·  ·  ·  ·  ·  ·  ·  ·  ·  ·  ·  ·  ·  ·  ·  ·  ·  ·  ·  ·  ·  ·  ·  ·  · 86%
Proportion of global GDP ·  ·  ·  ·  ·  ·  ·  ·  ·  ·  ·  ·  ·  ·  ·  ·  ·  ·  ·  ·  ·  ·  ·  ·  ·  ·  ·  ·  ·  ·  ·  ·  ·  ·  ·  ·  ·  ·  ·  ·  ·  ·  ·  ·  ·  ·  ·  ·  ·  ·  ·  ·  ·  ·  ·  ·  · 7.0%

Gross financial assets of private households
Total  ·  ·  ·  ·  ·  ·  ·  ·  ·  ·  ·  ·  ·  ·  ·  ·  ·  ·  ·  ·  ·  ·  ·  ·  ·  ·  ·  ·  ·  ·  ·  ·  ·  ·  ·  ·  ·  ·  ·  ·  ·  ·  ·  ·  ·  ·  ·  ·  ·  ·  ·  ·  ·  ·  ·  ·  ·  ·  ·  ·  ·  ·  ·  ·  ·  ·  ·  · EUR 2,550bn
Average ·  ·  ·  ·  ·  ·  ·  ·  ·  ·  ·  ·  ·  ·  ·  ·  ·  ·  ·  ·  ·  ·  ·  ·  ·  ·  ·  ·  ·  ·  ·  ·  ·  ·  ·  ·  ·  ·  ·  ·  ·  ·  ·  ·  ·  ·  ·  ·  ·  ·  ·  ·  ·  ·  ·  ·  · EUR 5,730 per capita
Proportion of global financial assets ·  ·  ·  ·  ·  ·  ·  ·  ·  ·  ·  ·  ·  ·  ·  ·  ·  ·  ·  ·  ·  ·  ·  ·  ·  ·  ·  ·  ·  ·  ·  ·  ·  ·  ·  ·  ·  ·  ·  ·  ·  ·  ·  ·  · 2.5%

Debt of private households
Total  ·  ·  ·  ·  ·  ·  ·  ·  ·  ·  ·  ·  ·  ·  ·  ·  ·  ·  ·  ·  ·  ·  ·  ·  ·  ·  ·  ·  ·  ·  ·  ·  ·  ·  ·  ·  ·  ·  ·  ·  ·  ·  ·  ·  ·  ·  ·  ·  ·  ·  ·  ·  ·  ·  ·  ·  ·  ·  ·  ·  ·  ·  ·  ·  ·  ·  ·  ·  ·  · EUR 970bn
Average ·  ·  ·  ·  ·  ·  ·  ·  ·  ·  ·  ·  ·  ·  ·  ·  ·  ·  ·  ·  ·  ·  ·  ·  ·  ·  ·  ·  ·  ·  ·  ·  ·  ·  ·  ·  ·  ·  ·  ·  ·  ·  ·  ·  ·  ·  ·  ·  ·  ·  ·  ·  ·  ·  ·  ·  · EUR 2,170 per capita
As % of GDP · · · · · · · · · · · · · · · · · · · · · · · · · · · · · · · · · · · · · · · · · · · · · · · · · · · · · · · · · · · · · · · · · · · · · 28.7%
Foreword . Summary . Development of global financial assets . How global financial assets are distributed . Regional differences . Literature . Appendix
	                                                                                                           Latin America


40                       This region is making headway in the race to                          did nothing to change Argentina’s status as the
                         catch up. Whereas not even 1% of the world’s                          country with the lowest net per capita assets
                         gross financial assets could be found in Latin                        in the region. Argentina’s households are also
                         America at the start of the millennium, the re-                       grappling with very high inflation: while official
                         gion accounted for no less than 2.5% of these as-                     statistics put the rate of inflation at 9.8% in 2011,
                         sets, or more than EUR 2.5 trillion, last year. Half                  independent observers suspect that the real fig-
                         of these assets were concentrated in the region’s                     ure is well in excess of 20%. Despite the fact that
                         largest economy, Brazil. The renewed flare-up in                      ten years have passed since the last sovereign
                         the international economic crisis, which dealt a                      default, many citizens are still finding it difficult
                         particularly hefty blow to household financial                        to shake off the painful memories of the severe
                         assets in Europe and North America, left Latin                        devaluation of the peso and the freezing of bank
                         American households unscathed again in 2011:                          deposits. The fact that inflation has reared its
                         as in the previous year, gross financial assets                       ugly head again is only serving to exacerbate the
                         climbed by 9.6%, growth that, in a global com-                        capital flight from Argentina, which was already
                         parison, came second only to the non-EU east-                         chronic. Many of the country’s citizens have no
                         ern European countries, which reported growth                         faith in their peso or their government anymore.
                         to the tune of 13.6%. Argentina led the regional                      Anyone who has the choice opts to invest abroad
                         pack with growth of around 24% – although this                        or stash his dollars or euros under his mattress.
                                                                                               In circumstances like these, it is, of course, ex-
                                                                                               tremely difficult to put a figure on the financial
                                                                                               assets of private households.


                         Indebtedness is increasing
                         Net financial assets and liabilities, in EUR bn                       Net financial assets and liabilities 2011, in EUR bn


                         2,500
                                                                                                      Brazil

                         2,000
                                                                                                    Mexico

                         1,500
                                                                                                       Chile


                         1,000                                                                    Colombia

                                           CAGR* 2001-2011:
                           500             Net financial assets: 	   +12.3% p.a.                  Argentina
                                           Liabilities:	             +16.7% p.a.
                                           Gross financial assets: 	 +13.7% p.a.
                                                                                                       Peru
                             0
                                 	 ’00 	          ’07 	   ’08 	   ’09	     ’10	    ’11                         0   200   400   600    800 1,000 1,200

                         *CAGR = Compound Annual Growth Rate                                                                                   Liabilities
                         Source: National Central Banks and Statistical Offices, Allianz SE.                                         Net financial assets
Allianz Global Wealth Report 2012


                          The region’s number two when it comes                    as almost 21% last year. Nevertheless, there is no                          41

   to gross financial asset growth – also if we look                               need for too much concern here. In Brazil, the
   at the decade as a whole – is Colombia, with av-                                rise in loans granted to private households can
   erage growth of 17.7% a year. Despite this sub-                                 be explained by the fact that more people now
   stantial growth over a prolonged period, how-                                   have access to the banking system. There has
   ever, Colombia is only just ahead of Argentina                                  been no deterioration in the ratio of loan repay-
   and Peru and has a long catch-up process ahead                                  ments to incomes. At 28.7% of GDP, household
   of it if it wants to join the ranks of its neighbors,                           debt in the region as a whole is only a fraction
   Brazil, Mexico and Chile.                                                       higher than the LWC average (26.2%). In Brazil,
                           In net terms, only 2.2% of the world’s fi-              however, this figure is already at 41%, roughly on
   nancial assets are at home in this region, with                                 a par with South Africa (40%) or the average for
   Latin American liabilities having grown at an                                   the eastern European EU countries (35.9%).
   average rate of almost 17% a year over the past
   eleven years, clearly outpacing the rest of the
   world (average of 5.5% a year). The biggest in-
   crease in liabilities over the past eleven years
   has been in Brazil, with a liability growth rate
   averaging 18.4% a year and coming in at as much


   Indebtedness
   Liabilities of households and GDP per capita 2011, in EUR


                         6,000                                                                 Slovakia
                                                                                                                     Slovenia
                                     Estonia

                         5,000
                                                                                                   Czech Republic

                         4,000                                                               Croatia
                                                                                           Chile
                                                                            Brazil           Hungary
Liabilities per capita


                                                                                         Poland
                         3,000


                         2,000
                                                       Bulgaria   Romania
                                               China                    Turkey
                         1,000                          Colombia             Russia
                                     Ukraine                     Mexico
                                                          Peru            Argentina
                            0         India
                                 0     2,000       4,000          6,000    8,000      10,000     12,000   14,000    16,000      18,000
                                                                     GDP per capita

   Source: National Central Banks and Statistical Offices, UN, Allianz SE.
Foreword . Summary . Development of global financial assets . How global financial assets are distributed . Regional differences . Literature . Appendix
	                                                                                                           Latin America


42                                    The entire region falls into the LWC cat-                          Chile and Mexico are already home to
                         egory, not only in terms of liabilities, but also as                a far from insignificant 13 million people in the
                         far as net financial assets (EUR 3,560 per capita)                  high wealth bracket (per capita net financial as-
                         are concerned. At country level, however, two                       sets in excess of EUR 26,800). In each of the six
                         of the region’s countries make it into the MWC                      countries included in our analysis, at least 10% of
                         bracket: Chile with EUR 9,460 (net) per capita,                     the population are in the middle wealth bracket,
                         which means that the country is ranked 25th out                     with as many as 20% falling into this category in
                         of 52 in a global comparison, and Mexico with                       Chile and Mexico. This makes around 58 million
                         EUR 5,750 (net) per capita (no. 30 in the ranking                   Latin Americans members of the global wealth
                         list). With net financial assets of EUR 2,980 per                   middle class, i.e. 8% of the global middle class
                         capita, Brazil comes in below the middle wealth                     lives in Latin America.
                         threshold of EUR 4,500 (net) per capita due to its
                         relatively high debt levels, which is why it is clas-
                         sified as a LWC. In an international comparison,
                         Brazil comes in 39th place, with the other coun-
                         tries of the region also ranked in the bottom
                         third: Colombia (44), Peru (42) – a country that
                         has been included in our analysis for the first
                         time this year – and Argentina (48).


                         Frontrunner Chile
                         Net financial assets and liabilities per capita,                    Net financial assets and liabilities per capita 2011,
                         in EUR                                                              in EUR

                         6,000                                                                         Chile


                         5,000
                                                                                                     Mexico

                         4,000
                                                                                                       Brazil

                         3,000
                                                                                                   Colombia
                         2,000
                                           CAGR* 2001-2011:
                                           Net financial assets: 	   +11.0% p.a.                       Peru
                         1,000
                                           Liabilities: 	            +15.4% p.a.
                                           Gross financial assets: 	 +12.4% p.a.
                                                                                                   Argentina
                             0
                                 	 ’00 	          ’07 	   ’08 	   ’09	    ’10	     ’11                          0   3,000   6,000       9,000     12,000

                         *CAGR = Compound Annual Growth Rate                                                                                  Liabilities
                         Source: National Central Banks and Statistical Offices, UN, Allianz SE.                                    Net financial assets
Allianz Global Wealth Report 2012


          The main problem facing Latin America,                            One characteristic of the region is the                          43

however, remains the uneven distribution of in-                   high proportion of financial assets invested in
come and wealth. The richest 20% of the popula-                   insurance and retirement provision, namely
tion earn more than 55% of the total income and                   26.7% – well above the LWC average of 14.4% and
hold more than 80% of the overall wealth. Moves                   just shy of the global average of almost 30%. The
to combat poverty in these countries are, howev-                  differences between the individual countries,
er, making at least slow progress. Although the                   however, are considerable. Some countries in the
proportion of income that goes to the poorest                     region were very quick to supplement the state
20% of the population has remained more or less                   social security systems with private retirement
stable over the past decade (3.8% of incomes as                   provision. The frontrunner and model in Latin
against 3.4% ten years ago), the richest 20% now                  America in this respect is, of course, Chile, where
“only” receive a share of 55%, compared to 58% at                 the Pinochet-led government took the decision
the start of the new millennium. This shows that                  to privatize the pay-as-you-go pension system
the middle class is growing slowly but surely.                    back in 1980 when it was facing bankruptcy. In
Mexico is the only country in which income dis-                   the new contribution-based system, individuals
tribution has become even more polarized. All                     pay contributions into a personal pension ac-
in all, however, Latin America is still in very poor              count that is managed and invested by private
shape compared with the rest of the world’s up-                   institutions. This explains why almost 60% of the
and-coming economies: the poorest 20% of the                      country’s total financial assets are invested in
emerging market population receive 6.2% of the                    retirement provision today. The Chilean pension
income, with the richest quintile taking 46.6%.                   insurance system has already been a source of
                                                                  inspiration for many countries across the globe.


Latin America’s population catching up slowly
Population by country groups, in %


                                                3
         7
                                                13


        92
                                                84


                                                                                                             HWC
                                                                                                             MWC
                                                                                                              LWC
	      2000	                                   2011


Source: National Central Banks and Statistical Offices, UNU WIDER, World Bank, Allianz SE.
Foreword . Summary . Development of global financial assets . How global financial assets are distributed . Regional differences . Literature . Appendix
	                                                                                                           Latin America


44                       Colombia also has an obligatory unemployment                                     Peru also has a contribution-based sys-
                         and pension insurance system financed by sav-                         tem with individual accounts, meaning that a
                         ings contributions made by employers in favor                         respectable 33% of financial assets are invested
                         of their employees. Consequently, almost 47% of                       in pension funds. The country’s capital market,
                         Colombia’s financial assets are tied up in pen-                       however, is still in the early stages of develop-
                         sions and insurance. In Brazil, the contribution-                     ment, meaning that Peruvians tend hardly to
                         based pension system has been truly booming                           invest anything on the stock or bond market out-
                         since the introduction of the VGBL (Vida Gerador                      side of pension funds. The vast majority of per-
                         de Beneficio Livre) and PGBL (Plano Gerador de                        sonal assets (57%) are still invested with banks.
                         Beneficio Livre) retirement provision products.                                  Finally, in Argentina, in the wake of the
                         Both models are tax-incentivized, contribution-                       nationalization of the private pension funds, the
                         based products; PGBL is designed purely for re-                       private retirement provision market is now vir-
                         tirement provision, similar to the 401(k) in the                      tually non-existent, meaning that the propor-
                         US. VGBL and PGBL products offer individuals a                        tion of financial assets invested in this area has
                         good way of saving for retirement, especially for                     fallen from 14.5% (2000) to 5% last year.
                         people working in Brazil’s very large informal                                   Mexicans traditionally invest the lion’s
                         sector, who do not contribute to the pay-as-you-                      share of their assets (around 70%) in shares and
                         go government pension system.                                         securities.


                         Share of old-age provision partly on HWC-level
                         Asset classes as % of gross financial assets


                               5                                  14
                              11
                                                33                                 27
                                                                                                                     59
                                                                                                     47
                                                7
                                                                  70
                              81
                                                                                   43

                                                57                                                   17
                                                                                                                     26                        Other
                                                                                                                                           Insurance
                                                                                   20                23                                    Securities
                                                                  15                                                 13
                                                                                                                                       Bank deposits
                    	     Argentina	           Peru	           Mexico	            Brazil	         Colombia	         Chile


                         Source: National Central Banks and Statistical Offices, Allianz SE.
Allianz Global Wealth Report 2012


                              45
Foreword . Summary . Development of global financial assets . How global financial assets are distributed . Regional differences . Literature . Appendix


46
North America

Population
Total  ·  ·  ·  ·  ·  ·  ·  ·  ·  ·  ·  ·  ·  ·  ·  ·  ·  ·  ·  ·  ·  ·  ·  ·  ·  ·  ·  ·  ·  ·  ·  ·  ·  ·  ·  ·  ·  ·  ·  ·  ·  ·  ·  ·  ·  ·  ·  ·  ·  ·  ·  ·  ·  ·  ·  ·  ·  ·  ·  ·  ·  ·  ·  ·  ·  ·  ·  ·  ·  ·  ·  ·  ·  ·  · 347 m
Proportion of the global population · ·  ·  ·  ·  ·  ·  ·  ·  ·  ·  ·  ·  ·  ·  ·  ·  ·  ·  ·  ·  ·  ·  ·  ·  ·  ·  ·  ·  ·  ·  ·  ·  ·  ·  ·  ·  ·  ·  ·  ·  ·  ·  ·  ·  · 5.1%

GDP
Total  ·  ·  ·  ·  ·  ·  ·  ·  ·  ·  ·  ·  ·  ·  ·  ·  ·  ·  ·  ·  ·  ·  ·  ·  ·  ·  ·  ·  ·  ·  ·  ·  ·  ·  ·  ·  ·  ·  ·  ·  ·  ·  ·  ·  ·  ·  ·  ·  ·  ·  ·  ·  ·  ·  ·  ·  ·  ·  ·  ·  ·  ·  ·  ·  ·  ·  · EUR 12,910bn
Proportion of global GDP ·  ·  ·  ·  ·  ·  ·  ·  ·  ·  ·  ·  ·  ·  ·  ·  ·  ·  ·  ·  ·  ·  ·  ·  ·  ·  ·  ·  ·  ·  ·  ·  ·  ·  ·  ·  ·  ·  ·  ·  ·  ·  ·  ·  ·  ·  ·  ·  ·  ·  ·  ·  ·  ·  ·  ·  · 24%

Gross financial assets of private households
Total  ·  ·  ·  ·  ·  ·  ·  ·  ·  ·  ·  ·  ·  ·  ·  ·  ·  ·  ·  ·  ·  ·  ·  ·  ·  ·  ·  ·  ·  ·  ·  ·  ·  ·  ·  ·  ·  ·  ·  ·  ·  ·  ·  ·  ·  ·  ·  ·  ·  ·  ·  ·  ·  ·  ·  ·  ·  ·  ·  ·  ·  ·  ·  ·  ·  ·  · EUR 41,970bn
Average ·  ·  ·  ·  ·  ·  ·  ·  ·  ·  ·  ·  ·  ·  ·  ·  ·  ·  ·  ·  ·  ·  ·  ·  ·  ·  ·  ·  ·  ·  ·  ·  ·  ·  ·  ·  ·  ·  ·  ·  ·  ·  ·  ·  ·  ·  ·  ·  ·  ·  ·  ·  ·  · EUR 120,810 per capita
Proportion of global financial assets ·  ·  ·  ·  ·  ·  ·  ·  ·  ·  ·  ·  ·  ·  ·  ·  ·  ·  ·  ·  ·  ·  ·  ·  ·  ·  ·  ·  ·  ·  ·  ·  ·  ·  ·  ·  ·  ·  ·  ·  ·  ·  ·  ·  · 41%

Debt of private households
Total  ·  ·  ·  ·  ·  ·  ·  ·  ·  ·  ·  ·  ·  ·  ·  ·  ·  ·  ·  ·  ·  ·  ·  ·  ·  ·  ·  ·  ·  ·  ·  ·  ·  ·  ·  ·  ·  ·  ·  ·  ·  ·  ·  ·  ·  ·  ·  ·  ·  ·  ·  ·  ·  ·  ·  ·  ·  ·  ·  ·  ·  ·  ·  ·  ·  ·  · EUR 11,610bn
Average ·  ·  ·  ·  ·  ·  ·  ·  ·  ·  ·  ·  ·  ·  ·  ·  ·  ·  ·  ·  ·  ·  ·  ·  ·  ·  ·  ·  ·  ·  ·  ·  ·  ·  ·  ·  ·  ·  ·  ·  ·  ·  ·  ·  ·  ·  ·  ·  ·  ·  ·  ·  ·  ·  ·  · EUR 33,410 per capita
As % of GDP · · · · · · · · · · · · · · · · · · · · · · · · · · · · · · · · · · · · · · · · · · · · · · · · · · · · · · · · · · · · · · · · · · · · · 89.9%
Foreword . Summary . Development of global financial assets . How global financial assets are distributed . Regional differences . Literature . Appendix
	                                                                                                           North America


48                       At the end of 2011, almost 41% of the world’s gross                     ance. Thanks to the recovery witnessed in the
                         financial assets were concentrated on the conti-                        closing quarter of the year, the gross financial
                         nent of North America. Taken together, Canadian                         assets of US households nevertheless grew ever
                         and US households had assets worth nearly EUR                           so slightly by 1.7% over the year as a whole. By
                         42 trillion, with the US alone home to around                           contrast, Canadians were unable to make up for
                         92% of them. In the two years following the out-                        the losses they incurred in Q2 and Q3. By the end
                         break of the financial crisis, which had burned a                       of 2011, their financial assets were down by 0.5%
                         hole of more than EUR 7.4 trillion in the pockets                       on the prior-year figure. This produces growth of
                         of North American households, gross financial                           1.5% for the region as a whole.
                         assets in the region started to recover again.
                         The average growth rate of 7.5% seen in 2009 and
                         2010, however, still lagged well behind the sort of
                         growth rates that were the order of the day prior
                         to the crisis (average of 10.8% from 2003 to 2007).
                         In the spring and summer of last year, asset
                         growth came to a complete standstill, mainly on
                         the back of disappointing stock market perform-


                         North America: Upward trend comes to a halt
                         Net financial assets and liabilities,                                   Net financial assets and liabilities per capita,
                         in EUR bn                                                               in EUR

                           45,000                                                                140,000

                           40,000
                                                                                                 120,000
                           35,000
                                                                                                 100,000
                           30,000

                           25,000                                                                  80,000

                           20,000                                                                  60,000

                           15,000
                                                CAGR* 2001-2011:                                   40,000              CAGR* 2001-2011:
                           10,000               Net financial assets: 	       +3.1% p.a.                               Net financial assets: 	       +2.1% p.a.
                                                Liabilities: 	                +5.2% p.a.           20,000              Liabilities: 	                +4.9% p.a.
                            5,000
                                                Gross financial assets: 	     +3.6% p.a.                               Gross financial assets: 	     +2.7% p.a.
                                    0                                                                      0
                                	       ’00 	             ’07 	   ’08 	     ’09	   ’10	    ’11         	       ’00 	             ’07 	   ’08 	     ’09	   ’10	    ’11

                         *CAGR = Compound Annual Growth Rate                                                                                           Liabilities
                         Source: Board of Governors of the Federal Reserve System, OECD, Statistics Canada, UN, Allianz SE.                  Net financial assets
Allianz Global Wealth Report 2012


              Liabilities in these two countries also                  EUR 90,420. All in all, regional net per capita fi-                                          49

moved in opposite directions last year. Whereas                        nancial assets were higher than in any other re-
US households managed to reduce their debt                             gion of the world, at EUR 87,400. More than 70% of
burden (-1.5%), Canada’s private households re-                        the North American population were members
mained on the personal debt path, increasing                           of the wealth middle and upper class. In global
their liabilities by 6%. Looking at the region as a                    terms, this means that every third high wealth
whole, this produces a reduction in debt of 0.8%,                      individual lives in this region. At country level,
meaning that net financial assets grew faster                          however, US citizens have “only” been sitting in
than their gross counterparts at 2.4%.                                 third place in the rankings for the highest net
               A significant difference emerged be-                    per capita financial assets since 2000, behind
tween the two neighbors as far as per capita as-                       their Swiss and Japanese counterparts. Whereas
sets are concerned. At EUR 123,590, the financial                      the Canadians were still in 5th place in 2000,
assets of US citizens were almost 30% higher                           their growing debt burden, in particular, pushed
than those of their northern neighbors (EUR                            them down to 7th place last year.
95,530) in gross terms. If we deduct the liabilities
from these figures, the gap actually widens to
more than 50% due to the higher per capita debt
that the Canadians have. In net terms, the aver-
age Canadian had assets worth EUR 59,910 at the
end of 2011, whereas the average US citizen had


Net financial assets and liabilities per capita, in EUR
USA                                                                    Canada


140,000                                                                140,000


120,000                                                                120,000


100,000                                                                100,000


  80,000                                                                80,000


  60,000                                                                60,000


  40,000              CAGR* 2001-2011:                                  40,000              CAGR* 2001-2011:
                      Net financial assets: 	       +2.1% p.a.                              Net financial assets: 	       +1.7% p.a.
  20,000              Liabilities: 	                +4.7% p.a.          20,000              Liabilities: 	                +6.5% p.a.
                      Gross financial assets: 	     +2.7% p.a.                              Gross financial assets: 	     +3.2% p.a.
          0                                                                     0
      	       ’00 	             ’07 	   ’08 	     ’09	   ’10	    ’11        	       ’00 	             ’07 	   ’08 	     ’09	   ’10	      ’11

*CAGR = Compound Annual Growth Rate                                                                                         Liabilities
Source: Board of Governors of the Federal Reserve System, OECD, Statistics Canada, UN, Allianz SE.                Net financial assets
Foreword . Summary . Development of global financial assets . How global financial assets are distributed . Regional differences . Literature . Appendix
	                                                                                                           North America


50                       Weak equity markets put a damper on asset growth                                                         still lost more than 14% in the three months be-
                         The devastating earthquake that hit Japan in                                                             tween July and September. By the end of the quar-
                         2011, coupled with the political tension in North                                                        ter, Canada’s S&P/TSX was also trading almost
                         Africa and the Middle East, meant that the spring                                                        13% lower than it had been at the end of June. The
                         of 2011 signaled the end of the upward trend on                                                          losses on the stock markets ultimately also had
                         the stock markets that had been ongoing since                                                            a negative impact on household financial assets.
                         the fall of 2010. One of the leading rating agencies                                                     In the period from April to September, the gross
                         stripped the US of its top credit rating in early                                                        financial assets of US and Canadian households
                         August in the wake of a lengthy debate on an in-                                                         dwindled by around EUR 2,390bn, which corre-
                         crease in the national debt ceiling. With the debt                                                       sponds to per capita losses of almost EUR 6,900.
                         crisis in Europe coming to a head, this fueled                                                           The region’s asset structure also had its part to
                         even more uncertainty among market partici-                                                              play in this development: at 53%, the proportion
                         pants, accelerating the downward trend on the                                                            of North American assets invested in securi-
                         stock markets in the third quarter of the year. Al-                                                      ties is well in excess of the average for all HWCs
                         though the slump was far less pronounced than                                                            worldwide (37%). With 55% securities in their as-
                         in Europe, the epicenter of the crisis, the S&P 500                                                      set portfolios, US households have even more of
                                                                                                                                  a risk appetite than their neighbors in Canada
                                                                                                                                  (36%), although a trend away from securities


                         Weak stock markets take their toll
                         Important equity indices,                                                                                Development of gross financial assets
                         indexed (04. Jan ’11=100)                                                                                during the year, q/q in %
                         110
                                                                                                                                      4
                         105

                         100                                                                                                          2

                          95
                                                                                                                                      0
                          90
                                        EURO STOXX 50
                          85                  S&P 500                                                                                                                         USA
                                              S&P/TSX                                                                             -2                                       Canada
                          80

                          75
                                                                                                                                  -4
                          70

                          65                                                                                                      -6
                                                                                                                                  	       Q1 2011	   Q2 2011	   Q3 2011	    Q4 2011
                               31.1.
                                       28.2.
                                               31.3.
                                                       29.4.
                                                               31.5.
                                                                       30.6.
                                                                               29.7.
                                                                                       31.8.
                                                                                               30.9.
                                                                                                       31.10.
                                                                                                                30.11.
                                                                                                                         30.12.


                         Source: Board of Governors of the Federal Reserve System, Datastream, OECD, Statistics Canada, Allianz SE.
Allianz Global Wealth Report 2012


and towards more bank deposits and insurance                                     Assets held in bank deposits proved to                            51

products has been emerging in recent years. The                       be the winner among the various asset classes
situation on the markets eased in the last three                      in 2011. In Canada, these assets had gained more
months of the year, so that, by the time the year                     than 5% year-on-year by the end of 2011, with
had come to a close, the S&P 500 had bounced                          gains of as much as more than 10% in the US. US
back to almost the same level that it started                         households increased their assets held in time
out at in 2011. The recovery made by the S&P/                         and savings deposits, which account for the ma-
TSX was not quite as positive, and it closed the                      jority of bank accounts, by around 6%. Demand
stock market year down by a good 11% in total. In                     deposits, which only accounted for a good 5% of
North America, private households also benefit-                       assets in 2010, soared by almost 90%, pushing
ted from the market recovery. Gross financial as-                     their share of total assets up to almost 9%. This
sets in the region increased by EUR 1.6 trillion in                   strong liquidity preference reflects the mood of
the fourth quarter, meaning that they were able                       uncertainty among investors. What is more, the
to make up for any losses incurred over the year                      low interest rates are prompting more and more
as a whole.                                                           people to put their money in short-term, as op-
                                                                      posed to long-term, investments. In the long run,
                                                                      this change in investor behavior is likely to have
                                                                      a negative impact on economic development.


Share of securities in North America above HWC average
Asset classes as % of gross financial assets

North America                                               HWC

100


         30          28     27     29     29     29         30            31      31    32     32     32
  75


  50
                                                            41            42      37    38     38     37
                                   54     54     53
         57          58     55


  25                                                                                                               Other
                                                                                                               Insurance
                                                                                  29    28     27     28
                                                            26            25
                                   15     15     16                                                            Securities
         11          12     16
   0                                                                                                        Bank deposits
       	 ’00	        ’07	   ’08	   ’09	   ’10	   ’11      	 ’00	          ’07	   ’08	   ’09	   ’10	   ’11


Source: National Central Banks and Statistical Offices, Allianz SE.
Foreword . Summary . Development of global financial assets . How global financial assets are distributed . Regional differences . Literature . Appendix
	                                                                                                           North America


52                       US citizens remain committed to debt reduction                     US households is bearing fruit. Since the end of
                         In a regional comparison, North America not                        2007, they have reduced their liabilities for what
                         only claimed the largest share of global financial                 is now the fourth year running – also thanks to
                         assets. Almost 37% of the world’s debt burden,                     considerable payment defaults and write-downs
                         more than in any other region, was also sitting                    on property loans. All in all, this corresponds to
                         on the other side of the Atlantic. This share has,                 a volume of almost EUR 590bn, or EUR 3,130 per
                         however, already been falling considerably in re-                  capita. As encouraging as this development is,
                         cent years. In 2007, it stood at no less than 41%.                 the speed at which debt was accumulated prior
                         For one, households in the emerging markets                        to the crisis was much higher: in the four years
                         have been accumulating increasing liabilities as                   leading up to 2007, liabilities increased to the
                         their financial sectors continue to develop. For                   tune of a good EUR 3,400bn, almost six times
                         another, the increasing debt discipline shown by                   the volume of debt reduction since 2007. In a
                                                                                            global comparison, the country came in ninth
                                                                                            in the list of the most indebted households, with
                                                                                            debt of EUR 33,170 per capita. Places one to seven
                                                                                            were all occupied by western Europeans. Cana-
                                                                                            da came in eighth, with per capita debt of EUR
                                                                                            35,620.


                         US-Americans successfully reining in debt
                         Liabilities per capita in EUR (lhs) and as percent of disposable income (rhs)


                         40,000                                                                                        160

                         35,000                                                                                        150

                         30,000
                                                                                                                       140

                         25,000
                                                                                                                       130             Liabilities per
                                                                                                                                         capita, USA
                         20,000
                                                                                                                       120             Liabilities per
                                                                                                                                      capita, Canada
                         15,000
                                                                                                                                        Liabilities as
                                                                                                                       110     percent of disposable
                         10,000
                                                                                                                                       income, USA

                           5,000                                                                                       100              Liabilities as
                                                                                                                               percent of disposable
                                                                                                                                    income, Canada
                               0                                                                                       90
                  	                ’00	   ’01	   ’02	   ’03	   ’04	   ’05	   ’06	   ’07	   ’08	   ’09	    ’10	   ’11


                         Source: Board of Governors of the Federal Reserve System, Datastream, OECD, Statistics Canada, UN, Allianz SE.
Allianz Global Wealth Report 2012


         US and Canadian households have been                                        53

going their separate ways as far as personal debt
is concerned for years now. The latter, for exam-
ple, upped their liabilities by a further 6% last
year, the debt ratio climbed to over 94% and the
ratio of debt to disposable income reached a new
record high touching on 155%. This means that,
for the first time, per capita debt in Canada was
higher than in the US. The only indicator that
slowed was the rate of debt accumulation. In the
four years following the outbreak of the crisis, li-
abilities grew by an average of almost 7% per an-
num, whereas the rate seen between 2004 and
2007 had still been sitting at 9.2%. In an environ-
ment of historically low interest rates, there is a
risk that private households, and young families
in particular, will end up biting off more debt
than they can chew. Many of them have no ex-
perience of higher interest rates, meaning that
they have never had any chance to develop a feel
for the sort of burden that rising interest rates
could create. The Bank of Canada also sees the
personal debt situation as cause for considerable
concern. In its quarterly monetary policy report
published in April 2012, it actually singled out
the rising household debt levels as the biggest
domestic risk facing the Canadian economy.
Foreword . Summary . Development of global financial assets . How global financial assets are distributed . Regional differences . Literature . Appendix


54
Western Europe

Population
Total  ·  ·  ·  ·  ·  ·  ·  ·  ·  ·  ·  ·  ·  ·  ·  ·  ·  ·  ·  ·  ·  ·  ·  ·  ·  ·  ·  ·  ·  ·  ·  ·  ·  ·  ·  ·  ·  ·  ·  ·  ·  ·  ·  ·  ·  ·  ·  ·  ·  ·  ·  ·  ·  ·  ·  ·  ·  ·  ·  ·  ·  ·  ·  ·  ·  ·  ·  ·  ·  ·  ·  ·  ·  ·  · 410 m
Proportion of the global population · ·  ·  ·  ·  ·  ·  ·  ·  ·  ·  ·  ·  ·  ·  ·  ·  ·  ·  ·  ·  ·  ·  ·  ·  ·  ·  ·  ·  ·  ·  ·  ·  ·  ·  ·  ·  ·  ·  ·  ·  ·  ·  ·  ·  · 6.0%

GDP
Total  ·  ·  ·  ·  ·  ·  ·  ·  ·  ·  ·  ·  ·  ·  ·  ·  ·  ·  ·  ·  ·  ·  ·  ·  ·  ·  ·  ·  ·  ·  ·  ·  ·  ·  ·  ·  ·  ·  ·  ·  ·  ·  ·  ·  ·  ·  ·  ·  ·  ·  ·  ·  ·  ·  ·  ·  ·  ·  ·  ·  ·  ·  ·  ·  ·  ·  · EUR 12,480bn
Proportion of global GDP ·  ·  ·  ·  ·  ·  ·  ·  ·  ·  ·  ·  ·  ·  ·  ·  ·  ·  ·  ·  ·  ·  ·  ·  ·  ·  ·  ·  ·  ·  ·  ·  ·  ·  ·  ·  ·  ·  ·  ·  ·  ·  ·  ·  ·  ·  ·  ·  ·  ·  ·  ·  ·  ·  ·  ·  · 25%

Gross financial assets of private households
Total  ·  ·  ·  ·  ·  ·  ·  ·  ·  ·  ·  ·  ·  ·  ·  ·  ·  ·  ·  ·  ·  ·  ·  ·  ·  ·  ·  ·  ·  ·  ·  ·  ·  ·  ·  ·  ·  ·  ·  ·  ·  ·  ·  ·  ·  ·  ·  ·  ·  ·  ·  ·  ·  ·  ·  ·  ·  ·  ·  ·  ·  ·  ·  ·  ·  ·  · EUR 26,930bn
Average ·  ·  ·  ·  ·  ·  ·  ·  ·  ·  ·  ·  ·  ·  ·  ·  ·  ·  ·  ·  ·  ·  ·  ·  ·  ·  ·  ·  ·  ·  ·  ·  ·  ·  ·  ·  ·  ·  ·  ·  ·  ·  ·  ·  ·  ·  ·  ·  ·  ·  ·  ·  ·  ·  ·  · EUR 65,620 per capita
Proportion of global financial assets ·  ·  ·  ·  ·  ·  ·  ·  ·  ·  ·  ·  ·  ·  ·  ·  ·  ·  ·  ·  ·  ·  ·  ·  ·  ·  ·  ·  ·  ·  ·  ·  ·  ·  ·  ·  ·  ·  ·  ·  ·  ·  ·  ·  · 26%

Debt of private households
Total  ·  ·  ·  ·  ·  ·  ·  ·  ·  ·  ·  ·  ·  ·  ·  ·  ·  ·  ·  ·  ·  ·  ·  ·  ·  ·  ·  ·  ·  ·  ·  ·  ·  ·  ·  ·  ·  ·  ·  ·  ·  ·  ·  ·  ·  ·  ·  ·  ·  ·  ·  ·  ·  ·  ·  ·  ·  ·  ·  ·  ·  ·  ·  ·  ·  ·  · EUR 10,010bn
Average ·  ·  ·  ·  ·  ·  ·  ·  ·  ·  ·  ·  ·  ·  ·  ·  ·  ·  ·  ·  ·  ·  ·  ·  ·  ·  ·  ·  ·  ·  ·  ·  ·  ·  ·  ·  ·  ·  ·  ·  ·  ·  ·  ·  ·  ·  ·  ·  ·  ·  ·  ·  ·  ·  ·  · EUR 24,380 per capita
As % of GDP · · · · · · · · · · · · · · · · · · · · · · · · · · · · · · · · · · · · · · · · · · · · · · · · · · · · · · · · · · · · · · · · · · · · · 80.2%
Foreword . Summary . Development of global financial assets . How global financial assets are distributed . Regional differences . Literature . Appendix
	                                                                                                           Western Europe


56                       After two years of robust growth, the accumula-                     Asset development marred
                         tion of private financial assets once again lost                    by the sovereign debt crisis

                         momentum in 2011. Overshadowed by the on-                           When the debt crisis in the peripheral EMU states
                         going debt crisis in some European Monetary                         came to a head again in the summer of last year,
                         Union (EMU) countries, the financial assets of                      dark clouds started to gather over the financial
                         western European households came under par-                         markets again. The uncertainty was stoked by
                         ticular pressure in the second half of last year.                   an onslaught of bad news from the eurozone and
                         Weak stock market performance was the main                          the US. And it was not only for Greece, Portugal
                         reason behind the slight drop on the assets side                    and Ireland that the refinancing costs started to
                         of the wealth balance sheet. Gross financial as-                    climb; investors also started to demand higher
                         sets contracted by a total of 0.2% in the course                    risk premiums for Italian and Spanish bonds.
                         of 2011 to around EUR 26.9 trillion. The liabili-                   In the US, the decision to raise the debt ceiling
                         ties side increased by 1.5%, meaning that in net                    just managed to prevent the suspension of cen-
                         terms, the drop in the asset base to EUR 16.9 tril-                 tral government payments. This did not stop one
                         lion was almost one percentage point more pro-                      rating agency from stripping US government
                         nounced than in a scenario in which liabilities                     bonds of their top AAA rating for the first time
                         are left out of the equation. All in all, however,                  in 70 years.
                         western Europe was still home to more than 26%
                         of global gross financial assets and almost 24%
                         of net financial assets.


                         Accumulation of wealth stagnates
                         Net financial assets and liabilities,                               Net financial assets and liabilities per capita,
                         in EUR bn                                                           in EUR

                         30,000                                                              70,000


                                                                                             60,000
                         25,000

                                                                                             50,000
                         20,000

                                                                                             40,000
                         15,000
                                                                                             30,000

                         10,000
                                            CAGR* 2001-2011:                                 20,000            CAGR* 2001-2011:
                                            Net financial assets: 	       +1.8% p.a.                           Net financial assets: 	       +1.3% p.a.
                          5,000             Liabilities: 	                +5.8% p.a.                           Liabilities: 	                +5.2% p.a.
                                                                                             10,000
                                            Gross financial assets: 	     +3.1% p.a.                           Gross financial assets: 	     +2.6% p.a.
                               0                                                                   0
                                	   ’00 	             ’07 	   ’08 	     ’09	   ’10	    ’11         	   ’00 	             ’07 	   ’08 	     ’09	   ’10	    ’11

                         *CAGR = Compound Annual Growth Rate                                                                                   Liabilities
                         Source: National Central Banks and Statistical Offices, UN, Allianz SE.                                     Net financial assets
Allianz Global Wealth Report 2012


Weak economic data also fueled fears of a re-                                       57

turn to recession. This triggered drastic share
price slumps on the market, with the Eurostoxx
50 losing around 24% during the third quarter
of 2011 alone. The situation eased slightly in the
last three months of the year, with confidence
bolstered by the new governments in Italy, Spain
and Greece. This was supported by the austerity
package resolved by the government led by Mario
Monti, as well as by proposals for more stringent
budgetary regulations put forward by Germany
and France. The Eurostoxx 50 had, however, only
made a slight recovery by the end of the year,
meaning that it had still lost a good 19% in the
second half of the year as a whole.
           The turbulent second half of the year on
the stock markets had a knock-on effect on the
development of private financial assets. Assets
held in securities fell by 7% as against 2010 to
around EUR 7 trillion. In a year-on-year compar-
ison, the chunk of the asset portfolio of private
households held in securities fell by almost two
percentage points to 26.1%. Despite the positive
gains for bank deposits (+3.2%) and insurance
and pensions (+1.9%), gross regional financial
assets dipped slightly on the whole to the tune
of 0.2%.
Foreword . Summary . Development of global financial assets . How global financial assets are distributed . Regional differences . Literature . Appendix
	                                                                                                           Western Europe


58                                     This means that the overall portfolio                                 (+3.4%), Denmark (+2.9%), Switzerland (+2.5%),
                         structure has shifted further towards security:                                     Germany (+1.2%) and Ireland (+0.5%) also saw
                         the proportion of bank deposits at the end of 2011                                  their assets increase overall. Households in the
                         came in at 34%, with insurance and pensions ac-                                     Netherlands, Norway and Germany found that
                         counting for a good 37%. Both asset classes were                                    their rather conservative asset structures stood
                         able to build on their positions by approximately                                   them in good stead against the backdrop of the
                         six percentage points compared with 2000.                                           financial market developments. The share of
                                                                                                             portfolios invested in securities in these coun-
                         Losses across the board                                                             tries was well below the western European aver-
                         Savers managed to continue accumulating as-                                         age in some cases.
                         sets in spite of the bleak macroeconomic situ-
                         ation and the low interest rate environment in
                         only seven out of 16 western European coun-
                         tries. Asset growth, however, was far less sub-
                         stantial than in the two previous years. Belgian
                         households led the field in this respect, with
                         an increase in gross financial assets of 4.4%.
                         Households in the Netherlands (+3.6%), Norway


                         Bumpy stock markets weigh on household financial assets
                         Change of gross financial assets,                                                   Development of individual asset classes 2011/2010,
                         2011 over 2010, in %                                                                in %

                             4                                                                                4


                             2
                                                                                                              2

                             0
                                                                                                              0

                             -2
                                                                                                              -2
                             -4

                                                                                                              -4
                             -6
                                                                                                                                                         Other
                                                                                                              -6
                                                             Western Europe


                             -8                                                                                                                      Insurance
                                                                                                                                                     Securities
                         -10                                                                                  -8                                  Bank deposits
                         	        BE	NL	NO	DK	CH	DE	IE	AT	                    FR	UK	 SE	 IT	 PT	 FI	 ES	GR


                         Source: National Central Banks and Statistical Offices, UN, Allianz SE.
Allianz Global Wealth Report 2012


           The developments proved disappoint-                                   It comes as little surprise that the hefti-                                     59

ing for savers in Finland and Sweden, who invest                        est losses were seen in Greece. The financial as-
a relatively high proportion of their financial as-                     sets of Greek households fell for the second time
sets in securities in a western European compar-                        running in 2011, sliding by 9.1%. Greece’s per
ison and were hit by losses totaling 3.5% and 2.4%                      capita assets at the end of 2011 averaged no more
respectively. Slight losses were incurred in the                        than EUR 21,380, putting them clearly at the bot-
UK (-0.4%) and France (-0.2%), whereas the asset                        tom of the western European rankings. In addi-
base in Austria remained virtually unchanged                            tion to hefty securities losses, Greece witnessed
(+0.03%). As was to be expected, the biggest as-                        a further decline in bank deposits (-3.2%) and in
set losses were reported by the central banks in                        assets held in insurance and pensions (-1.7%).
southern Europe. From Lisbon to Athens, assets                          The relatively moderate drop in bank deposits by
fell by 3.5% or EUR 215bn, which corresponds to                         “only” EUR 7bn owes itself to the fact that many
an average per capita drop of EUR 1,900 to just
under EUR 45,570. This means that last year saw
the gap separating these countries from the av-
erage per capita financial assets for the region
as a whole (EUR 65,620) widen to more than 30%.
This is the biggest differential seen since the
EMU came into being.


Development of net financial assets and liabilities per capita, in EUR …
…in the entire region…                                                  …and in southern Europe**


70,000                                                                  70,000


60,000                                                                  60,000


50,000                                                                  50,000


40,000                                                                  40,000


30,000                                                                  30,000


20,000            CAGR* 2001-2011:                                      20,000          CAGR* 2001-2011:
                  Net financial assets: 	        +1.3% p.a.                             Net financial assets: 	        -0.7% p.a.
10,000            Liabilities: 	                 +5.2% p.a.             10,000          Liabilities: 	                 +7.5% p.a.
                  Gross financial assets: 	      +2.6% p.a.                             Gross financial assets: 	      +1.6% p.a.
     0                                                                      0
       	   ’00	 ’01	 ’02	 ’03	 ’04	 ’05	 ’06	 ’07 	’08 	’09	 ’10	 ’11        	   ’00	 ’01	 ’02	 ’03	 ’04	 ’05	 ’06	 ’07 	’08 	’09	 ’10	 ’11

*CAGR = Compound Annual Growth Rate	                     **Greece, Italy, Portugal and Spain                              Liabilities
Source: National Central Banks and Statistical Offices, UN, Allianz SE.                                         Net financial assets
Foreword . Summary . Development of global financial assets . How global financial assets are distributed . Regional differences . Literature . Appendix
	                                                                                                           Western Europe


60                       Greeks (still) deemed it sufficient to merely jug-                           In the course of 2011, the savings rate of
                         gle their accounts around a bit last year. In actu-                western European households1 remained con-
                         al fact, private households withdrew more than                     stant at around 13%, putting a halt to the down-
                         EUR 28bn in demand, savings and time deposits                      ward trend seen in the previous year. Western
                         from the country’s banks in 2011 as a whole. At                    Europeans have managed to strike a balance
                         the same time, however, the deposits held by                       between their income and consumption growth
                         EMU residents with banks on the island of Cy-                      again, with the consumption growth rate slow-
                         prus for instance rose by more than 45% during                     ing from quarter to quarter and closing the year
                         the same period, following a leap of around 75%                    just under the prior-year value at 3%.
                         in 2009 and an exorbitant 402% one year later.
                         Since Cypriot banks have numerous branches in
                         Greece, this suggests that many of these trans-
                         fers were made by Greek citizens who had lost
                         confidence in their domestic banks.


                                                                                            1 Without Greece
                                                                                            and Switzerland


                         Greek bank deposits head for safer shores
                         Development of bank deposits in the GIIPS-countries since the end of 2007, indexed (January 2009=100)


                         115

                         110

                         105

                         100

                          95

                          90
                                                                                                                                                Italy
                          85                                                                                                                   Spain
                                                                                                                                             Greece
                          80
                                                                                                                                            Portugal
                          75                                                                                                                 Ireland
                          	 Dec 2007	 Jun 2008	 Dec 2008	 Jun 2009	 Dec 2009	 Jun 2010	 Dec 2010	 Jun 2011	 Dec 2011


                         Source: ECB, Allianz SE.
Allianz Global Wealth Report 2012


    Debt growth losing momentum                                         The net financial assets of western Eu-                              61
    since the outbreak of the crisis                            ropean households slid by 1.1% in total. Whereas
    If we look back on the past eleven years, debt              nominal economic output grew at a far faster
    growth has slowed considerably. Whereas in                  rate than household liabilities, namely at almost
    the four years prior to the outbreak of the global          3%, the relative debt burden, as a percentage of
    financial and economic crisis, the liabilities of           GDP, fell by 1.1 percentage points to 80.2%. The
    private households were still growing at a rate of          same development was observed to a lesser ex-
    8.2% a year, annual growth averaged 2.2% since              tent back in 2010, when the debt ratio fell by 0.4
    2007. This meant that regional net financial as-            percentage points. As far as private households
    sets had already returned to the pre-crisis level           are concerned, this means that further “delever-
    by the end of 2010. Last year, personal debt in             aging” progress has been made on the whole.
    western Europe once again rose only fairly mod-
    erately, by 1.5%. The increase was driven largely
    by mortgage loans, whereas there was actually
    a slight decline in the consumer and other loans
    segment. This decline is likely due primarily to
    supply factors: according to a survey conducted
    by the European Central Bank on credit business
    in the eurozone, more and more banks tight-
    ened up their lending guidelines, particularly
    towards the end of the year, putting a damper on
    the supply of loans.


    Savings rate bottoms out, consumption slows
    Gross savings rate (rhs) and rate of change of the components (lhs), q/q in %*


    1.0                                                                               14.5


    0.8                                                                               14.0


    0.6                                                                               13.5


    0.4                                                                               13.0


                                                                                                Disposable income
    0.2                                                                               12.5
                                                                                                     Consumption
                                                                                                     expenditures

    0.0                                                                               12.0             Savings rate

	         Q1’10	     Q2’10	      Q3’10	   Q4’10	   Q1’11	   Q2’11	   Q3’11	   Q4’11


    Source: Eurostat, Allianz SE.	                                                    *without Greece and Switzerland
Foreword . Summary . Development of global financial assets . How global financial assets are distributed . Regional differences . Literature . Appendix
	                                                                                                           Western Europe


62                                   A glance at the developments in the indi-                 tries in the region, meaning that its debt ratio
                         vidual countries, however, shows that increased                       is “only” in the upper mid segment of the rank-
                         debt discipline is not a trend that can be iden-                      ings. By contrast, any moves to push debt levels
                         tified across the board. The largest relative in-                     down tended to be seen mainly in some of the
                         crease in the liabilities side of the wealth balance                  countries on Europe’s periphery last year. Irish
                         sheet was achieved by Norwegian households,                           households worked harder than households in
                         which upped their liabilities by 7.4% last year.                      any other western European country to reduce
                         More than four-fifths of the total debt burden                        their debt between 2009 and 2011, meaning that,
                         was attributable to mortgage loans. In a regional                     by the end of 2011, the debt level was around
                         comparison, the Norwegians ranked among the                           8% lower than in 2007. Central banks in Greece
                         households with the highest levels of per capita                      (-4.4%), Portugal (-3.4%) and Spain (-2.9%) also re-
                         debt, with this figure totaling more than EUR                         ported declining personal debt levels. The weak
                         66,000 in Norway at the end of 2011, just behind                      and uncertain economic situations not only re-
                         Switzerland (at least EUR 76,700) and ahead of                        stricted the demand for loans, but also made the
                         the Danes (around EUR 64,200). With economic
                         output of more than EUR 71,000 per capita, how-
                         ever, Norway is streets ahead of all other coun-


                         Liabilities growing at a slower rate since the crisis
                         Development of liabilities and assets since 2000, indexed (2000=100)


                         200


                         180


                         160


                         140


                         120


                         100                                                                                                                Liabilities
                                                                                                                                Gross financial assets
                          80                                                                                                      Net financial assets
                            	 ’00	      ’01	    ’02	     ’03	    ’04	    ’05	     ’06	    ’07	     ’08	    ’09	   ’10	    ’11


                         Source: National Central Banks and Statistical Offices, Allianz SE.
Allianz Global Wealth Report 2012


credit ratings of potential debtors less attractive.                         EUR 26,800, putting them in the wealth upper                                  63

Finally, the unemployment rate soared to record                              class in a global context. The lower wealth class
highs in these countries, ranging from 12.9% in                              still included more than 130 million western
Portugal to 17.7% in Greece and a dizzy 21.7% in                             Europeans last year; after subtracting their li-
Spain (average annual figures).                                              abilities, they are left with less than EUR 4,500
                                                                             per capita. This means that the remaining 33%
Asset classes: almost equal distribution in net terms                        of the population were in the middle wealth
As far as their net financial assets are con-                                bracket last year.
cerned, western Europeans are spread fairly                                          Looking at the region as a whole, the av-
evenly across all three asset classes. More than                             erage western European had net financial assets
one third of the approximately 410 million peo-                              of EUR 41,240 per capita. A total of ten countries
ple who live in this region had financial assets,                            in the region belonged to the HWC group at the
after deductions for any liabilities, of at least                            end of 2011. Average per capita net financial as-
                                                                             sets came in at EUR 47,650 in this group of coun-
                                                                             tries, ranging from EUR 38,520 in Germany to
                                                                             EUR 138,060 in Switzerland. The MWC countries
                                                                             included, in net terms, Greece, Ireland, Portugal
                                                                             and Spain, as well as Finland and even Norway.


Highest indebtedness per capita in Switzerland, Norway and Denmark
Liabilities per capita in EUR (lhs) and debt-to-GDP ratio (rhs) 2011, in %


80,000                                                                                              160

70,000                                                                                              140

60,000                                                                                              120

50,000                                                                                              100

40,000                                                                                               80

30,000                                                                                              60

20,000                                                                                              40
                                            Western Europe


10,000                                                                                              20     Liabilities per capita

     0                                                                                               0       Debt-to-GDP ratio
	        CH	 NO	 DK	 NL	 IE	 SE	 UK	                         FI	   FR	 ES	 AT	 BE	 DE	 PT	 IT	 GR


Source: National Central Banks and Statistical Offices, UN, Allianz SE.
Foreword . Summary . Development of global financial assets . How global financial assets are distributed . Regional differences . Literature . Appendix
	                                                                                                           Western Europe


64                       In Norway’s case, it is the country’s high debt lev-
                         els, as mentioned above, that push net per capita
                         financial assets down to this low level, relegat-
                         ing the country to the very bottom of the western
                         European MWC league table. On average, net per
                         capita financial assets in the western European
                         MWCs totaled EUR 16,120, putting them roughly
                         on a par with the 2002 level.
                                    The global ranking based on net finan-
                         cial assets per capita is once again led by Swiss
                         households – with a clear lead over the Japanese,
                         who come in second (net per capita financial
                         assets: EUR 93,090). The top ten includes three
                         other western European countries, Belgium (4th
                         place), the Netherlands (5th place) and the UK
                         (9th place). Belgian households fare better in
                         terms of debt (EUR 18,960 per capita) than the
                         Dutch and the British, and are well below the re-
                         gional average of EUR 24,380.


                         Western Europe: Ranking by net financial assets per capita, in EUR

                         140,000


                         120,000


                         100,000


                          80,000


                          60,000
                                                                                                                                              Figures in
                                                                                                                                               brackets:
                          40,000                                                                                                                 Global
                                                                                                                                                ranking

                          20,000
                                                                                                                                               HWC
                                0                                                                                                              MWC
                  	                 CH	    BE	    NL	    UK 	 DK 	 IT	 FR	 SE	 AT	 DE	 IE	 PT	                 FI	   ES	 GR	 NO
                  	                 (1)	   (4)	   (5)	   (9)	 (11)	 (12)	 (13)	 (14)	 (15)	 (16)	 (18)	 (19)	 (20)	 (21)	 (27)	 (29)

                         Source: National Central Banks and Statistical Offices, UNU WIDER, UN, World Bank, Allianz SE.
Allianz Global Wealth Report 2012


                              65
Foreword . Summary . Development of global financial assets . How global financial assets are distributed . Regional differences . Literature . Appendix


66
Eastern Europe

Population
Total  ·  ·  ·  ·  ·  ·  ·  ·  ·  ·  ·  ·  ·  ·  ·  ·  ·  ·  ·  ·  ·  ·  ·  ·  ·  ·  ·  ·  ·  ·  ·  ·  ·  ·  ·  ·  ·  ·  ·  ·  ·  ·  ·  ·  ·  ·  ·  ·  ·  ·  ·  ·  ·  ·  ·  ·  ·  ·  ·  ·  ·  ·  ·  ·  ·  ·  ·  ·  ·  ·  ·  ·  ·  ·  · 384 m
Proportion of the global population · ·  ·  ·  ·  ·  ·  ·  ·  ·  ·  ·  ·  ·  ·  ·  ·  ·  ·  ·  ·  ·  ·  ·  ·  ·  ·  ·  ·  ·  ·  ·  ·  ·  ·  ·  ·  ·  ·  ·  ·  ·  ·  ·  ·  · 5.6%

GDP
Total  ·  ·  ·  ·  ·  ·  ·  ·  ·  ·  ·  ·  ·  ·  ·  ·  ·  ·  ·  ·  ·  ·  ·  ·  ·  ·  ·  ·  ·  ·  ·  ·  ·  ·  ·  ·  ·  ·  ·  ·  ·  ·  ·  ·  ·  ·  ·  ·  ·  ·  ·  ·  ·  ·  ·  ·  ·  ·  ·  ·  ·  ·  ·  ·  ·  ·  ·  · EUR 3,070bn
Proportion of global GDP ·  ·  ·  ·  ·  ·  ·  ·  ·  ·  ·  ·  ·  ·  ·  ·  ·  ·  ·  ·  ·  ·  ·  ·  ·  ·  ·  ·  ·  ·  ·  ·  ·  ·  ·  ·  ·  ·  ·  ·  ·  ·  ·  ·  ·  ·  ·  ·  ·  ·  ·  ·  ·  ·  ·  ·  · 6.3%

Gross financial assets of private households
Total  ·  ·  ·  ·  ·  ·  ·  ·  ·  ·  ·  ·  ·  ·  ·  ·  ·  ·  ·  ·  ·  ·  ·  ·  ·  ·  ·  ·  ·  ·  ·  ·  ·  ·  ·  ·  ·  ·  ·  ·  ·  ·  ·  ·  ·  ·  ·  ·  ·  ·  ·  ·  ·  ·  ·  ·  ·  ·  ·  ·  ·  ·  ·  ·  ·  ·  ·  · EUR 1,560bn
Average ·  ·  ·  ·  ·  ·  ·  ·  ·  ·  ·  ·  ·  ·  ·  ·  ·  ·  ·  ·  ·  ·  ·  ·  ·  ·  ·  ·  ·  ·  ·  ·  ·  ·  ·  ·  ·  ·  ·  ·  ·  ·  ·  ·  ·  ·  ·  ·  ·  ·  ·  ·  ·  ·  ·  ·  · EUR 4,060 per capita
Proportion of global financial assets ·  ·  ·  ·  ·  ·  ·  ·  ·  ·  ·  ·  ·  ·  ·  ·  ·  ·  ·  ·  ·  ·  ·  ·  ·  ·  ·  ·  ·  ·  ·  ·  ·  ·  ·  ·  ·  ·  ·  ·  ·  ·  ·  ·  · 1.5%

Debt
Total  ·  ·  ·  ·  ·  ·  ·  ·  ·  ·  ·  ·  ·  ·  ·  ·  ·  ·  ·  ·  ·  ·  ·  ·  ·  ·  ·  ·  ·  ·  ·  ·  ·  ·  ·  ·  ·  ·  ·  ·  ·  ·  ·  ·  ·  ·  ·  ·  ·  ·  ·  ·  ·  ·  ·  ·  ·  ·  ·  ·  ·  ·  ·  ·  ·  ·  ·  ·  ·  · EUR 630bn
Average ·  ·  ·  ·  ·  ·  ·  ·  ·  ·  ·  ·  ·  ·  ·  ·  ·  ·  ·  ·  ·  ·  ·  ·  ·  ·  ·  ·  ·  ·  ·  ·  ·  ·  ·  ·  ·  ·  ·  ·  ·  ·  ·  ·  ·  ·  ·  ·  ·  ·  ·  ·  ·  ·  ·  ·  · EUR 1,630 per capita
As % of GDP · · · · · · · · · · · · · · · · · · · · · · · · · · · · · · · · · · · · · · · · · · · · · · · · · · · · · · · · · · · · · · · · · · · · · 20.4%
Foreword . Summary . Development of global financial assets . How global financial assets are distributed . Regional differences . Literature . Appendix
	                                                                                                           Eastern Europe


68                       Eastern European EU members: slow growth                                         Last year’s regional leaders were Slova-
                         Despite the considerable extent to which the                          kia (8.1%) and Lithuania (11.9%), who are now
                         eastern European EU states depend on euro area                        slowly getting back on their feet again after
                         developments, the countries in this region fared                      the severe recession of 2009. Hungary is still
                         relatively well in 2011. Latvia’s economy also re-                    the region’s problem child: the gross financial
                         ported positive growth rates again, and the re-                       assets of private households slumped by 5.6%
                         gion as a whole achieved economic growth of                           year-on-year after the government national-
                         6.4% on a year earlier, compared with “only” 3.7%                     ized the obligatory private pillar of the pension
                         in 2010. The continuing effects of the crisis have,                   insurance system in an attempt to restructure
                         however, still left a visible mark on financial as-                   its budget. The country’s citizens had paid the
                         sets. Although gross financial assets increased                       equivalent of almost EUR 9.5bn into this pillar
                         by 3.5% in 2011, this is a very low rate in a long-                   since 1998, funds that are now sorely missing in
                         term comparison – average annual growth rate                          household balance sheets. And unfortunately,
                         of +11.8% since 2000.                                                 the medium-term prospects for the Hungarian
                                                                                               population are also anything but promising: the
                                                                                               country’s economy is entering another recession
                                                                                               that is expected to last until 2013, with inflation
                                                                                               set to be well above the 5% mark this year and
                                                                                               unemployment recently climbing to as much as
                                                                                               11.8%.


                         Eastern European member states: Weak growth of financial assets
                         Net financial assets and liabilities,                                 Net financial assets and liabilities 2011,
                         in EUR bn                                                             in EUR bn

                         900                                                                                   Poland

                         800                                                                            Czech Republic

                         700                                                                                 Romania

                         600                                                                                  Hungary

                         500                                                                                  Slovakia

                         400                                                                                  Slovenia

                         300                                                                                  Bulgaria
                                          CAGR* 2001-2011:
                         200              Net financial assets: 	    +8.6% p.a.                              Lithuania
                                          Liabilities: 	            +21.5% p.a.
                         100                                                                                   Estonia
                                          Gross financial assets: 	 +11.8% p.a.
                           0                                                                                    Latvia
                               	 ’00 	           ’07 	    ’08 	   ’09	     ’10	    ’11                                   0    100           200        300

                         *CAGR = Compound Annual Growth Rate                                                                                  Liabilities
                         Source: National Central Banks and Statistical Offices, Allianz SE.                                        Net financial assets
Allianz Global Wealth Report 2012


          The weak Hungarian forint is putting                      Household debt on the wane                                                         69

additional pressure on households, because                          The eastern European economic success story
many mortgage loans were granted in euros                           of the past decade also came hand-in-hand with
or Swiss francs in the past. Up until the end of                    a huge boom in the liabilities of private house-
February 2012, however, households were able to                     holds. When the financial crisis forced banks to
repay these loans at a more favorable exchange                      restrict lending in, and to, eastern Europe, this
rate, meaning that, according to preliminary                        obviously had an impact on households. Since
estimates, home loans denominated in foreign                        2009, liabilities have been growing at an average
currencies fell by 22% as against the end of 2011                   rate of only 5.2%, compared with average annu-
in the first three months of this year. Never-                      al rates of more than 28% in the years between
theless, there are still outstanding home loans                     2000 and 2008. Debt levels were actually on the
worth EUR 6.6bn.                                                    decline in most of these countries. The main
          The region as a whole is home to 1.4% of                  debt accumulation culprits are Poland, Slovakia
the people whose asset situation is analyzed in                     and the Czech Republic.
the Allianz Global Wealth Report, although the
eastern European EU states only account for 0.8%
of global gross financial assets, at EUR 849bn.


Frontrunner Slovenia
Net financial assets and liabilities per capita,                    Net financial assets and liabilities per capita 2011,
in EUR                                                              in EUR

9,000                                                                            Slovenia

8,000                                                                              Estonia

7,000                                                                      Czech Republic

6,000                                                                            Hungary

5,000                                                                             Slovakia

4,000                                                                              Poland

3,000                                                                            Lithuania
                 CAGR* 2001-2011:
2,000            Net financial assets: 	    +8.7% p.a.                           Romania
                 Liabilities: 	            +21.7% p.a.
1,000                                                                               Latvia
                 Gross financial assets: 	 +12.0% p.a.
    0                                                                             Bulgaria
     	 ’00 	            ’07 	    ’08 	   ’09	    ’10	     ’11                                0   5,000 10,000 15,000 20,000

*CAGR = Compound Annual Growth Rate                                                                               Liabilities
Source: National Central Banks and Statistical Offices, UN, Allianz SE.                                 Net financial assets
Foreword . Summary . Development of global financial assets . How global financial assets are distributed . Regional differences . Literature . Appendix
	                                                                                                           Eastern Europe


70                                 The difficult economic environment,                         Europe, the country tumbles to second-last place
                         however, meant that the growth in household                           in net terms, conferring it only LWC status. Po-
                         assets has been lagging behind the growth in li-                      land and Lithuania, with net per capita financial
                         abilities in recent years. This casts the region in                   assets of EUR 4,150 and EUR 4,090 respectively
                         a poorer light in net terms than in gross terms                       also lose their MWC ranking (net assets of more
                         in a global comparison. At EUR 516bn, only 0.72%                      than EUR 4,500 per capita).
                         of the world’s net assets are located in the re-                                Slovenia, where per capita net financial
                         gion. The most prominent example is Slovakia,                         assets total EUR 14,050, continues to lead the
                         which, with per capita assets of EUR 8,160, takes                     field here. This puts the country in 23rd place in
                         33rd place (out of 52) in the global comparison in                    our global ranking.
                         gross terms – only two places lower than in 2000.
                         In net terms, the country has slid to 41st place,
                         with assets of EUR 1,940 per capita – 9 places
                         lower than at the beginning of the millennium.
                         Private household debt soared from 13% of GDP
                         to 49% last year. While Slovakia makes it into the
                         MWC club in gross terms, putting it in the mid-
                         dle of the rankings in fifth place within eastern


                         Average income distribution in comparison
                         Share of total income by income decile, in %

                         30


                         20


                         10
                                                                                                                                               Eastern
                                                                                                                                           Europe (EU)
                                                                                                                                                World
                                                                                                                                             Emerging
                          0                                                                                                                   markets
                  	        1. decile	 2. decile	 3. decile	 4. decile	 5. decile	 6. decile	 7. decile	 8. decile	 9. decile	 10. decile


                         Source: National Central Banks and Statistical Offices, Allianz SE.
Allianz Global Wealth Report 2012


               The region is still not home to a sin-                              The asset investment structure in the                              71

    gle HWC, a status that requires average net per                       region varies greatly from country to country.
    capita assets in excess of EUR 26,800. Slovenia,                      Two trends, however, have prevailed in almost
    Estonia, Romania, the Czech Republic and Hun-                         all of the countries in this region in recent years.
    gary, however, rank among the MWCs. Within                            For one, the proportion of insurance products
    the individual countries, incomes and assets are                      and pensions has grown considerably since the
    fairly evenly distributed: only 38% of income and                     start of the century as private retirement pro-
    69% of assets are in the hands of the richest 20%                     vision structures have been established. The
    of the population. All in all, 27 million people, i.e.                only country to buck this trend last year was, of
    more than one quarter of the total population,                        course, Hungary, which opted to nationalize its
    are classed as falling into the middle wealth                         obligatory private pension insurance pillar. The
    bracket in global terms. In a global comparison,                      proportion of bank deposits also slid sharply
    3.8% of middle wealth individuals live in the                         during the course of the economic upswing, al-
    eastern European EU states.                                           though this trend has been reversed since the
                                                                          outbreak of the crisis in 2008. The most evident
                                                                          turnaround can be seen in Bulgaria, where the
                                                                          proportion of total financial assets invested in
                                                                          bank deposits slid from 55% in 2000 to 32% in
                                                                          2007, before climbing back up to 46% last year.


    Structure of financial assets: Reversion towards more bank deposits
    Asset classes as % of gross financial assets


       6                             14                                           16           15
                                                    15              16


      32

                                                    34                                         37
                                     43                             33            38


      54
                                                                                                                      Other
                                     39             45              45            41           43
                                                                                                                  Insurance
                                                                                                                  Securities
                                                                                                               Bank deposits
	    2000	                          2007	          2008	          2009	          2010	        2011


    Source: National Central Banks and Statistical Offices, Allianz SE.
Foreword . Summary . Development of global financial assets . How global financial assets are distributed . Regional differences . Literature . Appendix
	                                                                                                           Eastern Europe


72                       Eastern Europe outside of the EU                                             Since 77% of the region’s population lives
                         At EUR 712bn, only 0.7% of the world’s gross                       in Russia and Turkey, it comes as no surprise
                         financial assets are located in Croatia, Kaza-                     that the financial assets are also concentrated
                         khstan, Russia, Turkey and Ukraine, although                       in these two countries (Russia: EUR 366bn and
                         no less than 5.9% of the population included in                    Turkey: EUR 221bn). In per capita terms, however,
                         our analysis live in these countries. The region                   Croatia is the clear leader of the pack. With gross
                         with the lowest financial assets in our analysis                   financial assets of EUR 9,720 per capita, Croatia
                         is, however, the unchallenged growth leader –                      is the only country in the region to qualify as an
                         both over the past ten years and in 2011. After                    MWC, and would come in 4th place (31st place
                         average annual growth rates of more than 23%                       worldwide) if it were to be ranked alongside the
                         in the period leading up to 2010, the growth rate                  eastern European EU members – as far as assets
                         was slashed almost in half last year to 13.6% on a                 are concerned, the country has already joined
                         year earlier. The only region to achieve similarly                 the ranks of the EU.
                         strong growth in 2011 was Latin America (9.6%);
                         in a long-term analysis, however, even Latin
                         America is left well behind with average growth
                         of 14.1% (2001 – 2010).


                         Ranking Eastern Europe

                                    Gross financial assets per capita, in EUR                          Net financial assets per capita, in EUR
                                      Slovenia (26)                             20,197                   Slovenia (23)                           14,049
                                       Estonia (27)                             15,540                    Estonia (24)                            9,672
                               Czech Republic (28)                              14,353           Czech Republic (26)                              9,408
                                        Croatia (31)                             9,724                    Croatia (31)                            5,482
                                      Hungary (32)                               8,798                  Romania (32)                              5,343
                                      Slovakia (33)                              8,156                  Hungary (33)                              5,224
                                        Poland (34)                              7,434                    Poland (35)                             4,153
                                     Lithuania (35)                              7,349                 Lithuania (36)                             4,089
                                      Romania (36)                               6,856                   Bulgaria (38)                            3,191
                                         Latvia (39)                             5,290                   Slovakia (41)                            1,938
                                      Bulgaria (41)                             4,806                      Turkey (43)                            1,659
                                        Turkey (44)                              2,998                     Russia (45)                            1,549
                                        Russia (46)                              2,566                     Latvia (46)                            1,392
                                  Kazakhstan (49)                                1,355                   Ukraine (49)                              928
                                       Ukraine (50)                              1,329               Kazakhstan (51)                               539
                                           6,400 < MWC < 38,700                                              4,500 < MWC < 26,800
                         Figures in brackets: Place in the global ranking
                         Source: National Central Banks and Statistical Offices, UNU WIDER, UN, World Bank, Allianz SE.
Allianz Global Wealth Report 2012


          The country is followed, with a consider-                 of EUR 5,480 per capita, however, the country is                                    73

able gap, by Turkey with just under EUR 3,000 per                   still a MWC. All in all, the region is home to 27
capita and then Russia with EUR 2,570.                              million people in the middle wealth category –
           But it is not only as far as asset bases                 3.7% of the world’s middle class. Most of them
are concerned that the region takes the title of                    (14.3 million) live in Russia. In Croatia, high
growth champion; it also leads the rankings                         wealth (net financial assets of more than EUR
when it comes to accumulating liabilities. And                      26,800 per capita) is the reserve of only the top
yet, despite average growth rates of almost 40%                     decile of the population (0.4 million people).
since 2000, the region’s debt level is the lowest in
the world, corresponding to 13.7% of GDP or the
equivalent of EUR 1,040 per capita. Here, again,
Croatia comes in first with liabilities of EUR
4,240 per capita or 41.1% of GDP. This, however,
puts Croatia’s household debt well above the av-
erage for the eastern European EU states, which
stands at 35.9% of GDP. With net financial assets


Croatia at EU-level
Net financial assets and liabilities per capita,                    Net financial assets and liabilities per capita 2011,
in EUR                                                              in EUR

2,500
                                                                          Croatia


2,000
                                                                           Turkey


1,500

                                                                           Russia

1,000

                 CAGR* 2001-2011:                                   Kazakhstan
 500             Net financial assets: 	   +17.9% p.a.
                 Liabilities: 	            +39.6% p.a.
                 Gross financial assets: 	 +22.5% p.a.
                                                                          Ukraine
    0
     	 ’00 	            ’07 	    ’08 	   ’09	    ’10	     ’11                       0            5,000                   10,000

*CAGR = Compound Annual Growth Rate                                                                                Liabilities
Source: National Central Banks and Statistical Offices, UN, Allianz SE.                                  Net financial assets
Foreword . Summary . Development of global financial assets . How global financial assets are distributed . Regional differences . Literature . Appendix


74
Asia

Population
Total  ·  ·  ·  ·  ·  ·  ·  ·  ·  ·  ·  ·  ·  ·  ·  ·  ·  ·  ·  ·  ·  ·  ·  ·  ·  ·  ·  ·  ·  ·  ·  ·  ·  ·  ·  ·  ·  ·  ·  ·  ·  ·  ·  ·  ·  ·  ·  ·  ·  ·  ·  ·  ·  ·  ·  ·  ·  ·  ·  ·  ·  ·  ·  ·  ·  ·  ·  ·  ·  ·  ·  ·  · 3,140 m
Proportion of the region as a whole ·  ·  ·  ·  ·  ·  ·  ·  ·  ·  ·  ·  ·  ·  ·  ·  ·  ·  ·  ·  ·  ·  ·  ·  ·  ·  ·  ·  ·  ·  ·  ·  ·  ·  ·  ·  ·  ·  ·  ·  ·  ·  ·  ·  ·  · 81%
Proportion of the global population · ·  ·  ·  ·  ·  ·  ·  ·  ·  ·  ·  ·  ·  ·  ·  ·  ·  ·  ·  ·  ·  ·  ·  ·  ·  ·  ·  ·  ·  ·  ·  ·  ·  ·  ·  ·  ·  ·  ·  ·  ·  ·  ·  ·  · 46%

GDP
Total  ·  ·  ·  ·  ·  ·  ·  ·  ·  ·  ·  ·  ·  ·  ·  ·  ·  ·  ·  ·  ·  ·  ·  ·  ·  ·  ·  ·  ·  ·  ·  ·  ·  ·  ·  ·  ·  ·  ·  ·  ·  ·  ·  ·  ·  ·  ·  ·  ·  ·  ·  ·  ·  ·  ·  ·  ·  ·  ·  ·  ·  ·  ·  ·  ·  ·  · EUR 14,080bn
Proportion of the region as a whole ·  ·  ·  ·  ·  ·  ·  ·  ·  ·  ·  ·  ·  ·  ·  ·  ·  ·  ·  ·  ·  ·  ·  ·  ·  ·  ·  ·  ·  ·  ·  ·  ·  ·  ·  ·  ·  ·  ·  ·  ·  ·  ·  ·  ·  · 94%
Proportion of global GDP ·  ·  ·  ·  ·  ·  ·  ·  ·  ·  ·  ·  ·  ·  ·  ·  ·  ·  ·  ·  ·  ·  ·  ·  ·  ·  ·  ·  ·  ·  ·  ·  ·  ·  ·  ·  ·  ·  ·  ·  ·  ·  ·  ·  ·  ·  ·  ·  ·  ·  ·  ·  ·  ·  · 26.4%

Gross financial assets of private households
Total  ·  ·  ·  ·  ·  ·  ·  ·  ·  ·  ·  ·  ·  ·  ·  ·  ·  ·  ·  ·  ·  ·  ·  ·  ·  ·  ·  ·  ·  ·  ·  ·  ·  ·  ·  ·  ·  ·  ·  ·  ·  ·  ·  ·  ·  ·  ·  ·  ·  ·  ·  ·  ·  ·  ·  ·  ·  ·  ·  ·  ·  ·  ·  ·  ·  ·  · EUR 27,860bn
Average ·  ·  ·  ·  ·  ·  ·  ·  ·  ·  ·  ·  ·  ·  ·  ·  ·  ·  ·  ·  ·  ·  ·  ·  ·  ·  ·  ·  ·  ·  ·  ·  ·  ·  ·  ·  ·  ·  ·  ·  ·  ·  ·  ·  ·  ·  ·  ·  ·  ·  ·  ·  ·  ·  ·  ·  · EUR 8,870 per capita
Proportion of global financial assets ·  ·  ·  ·  ·  ·  ·  ·  ·  ·  ·  ·  ·  ·  ·  ·  ·  ·  ·  ·  ·  ·  ·  ·  ·  ·  ·  ·  ·  ·  ·  ·  ·  ·  ·  ·  ·  ·  ·  ·  ·  ·  ·  ·  · 27%

Debt
Total  ·  ·  ·  ·  ·  ·  ·  ·  ·  ·  ·  ·  ·  ·  ·  ·  ·  ·  ·  ·  ·  ·  ·  ·  ·  ·  ·  ·  ·  ·  ·  ·  ·  ·  ·  ·  ·  ·  ·  ·  ·  ·  ·  ·  ·  ·  ·  ·  ·  ·  ·  ·  ·  ·  ·  ·  ·  ·  ·  ·  ·  ·  ·  ·  ·  ·  ·  · EUR 7,080bn
Average ·  ·  ·  ·  ·  ·  ·  ·  ·  ·  ·  ·  ·  ·  ·  ·  ·  ·  ·  ·  ·  ·  ·  ·  ·  ·  ·  ·  ·  ·  ·  ·  ·  ·  ·  ·  ·  ·  ·  ·  ·  ·  ·  ·  ·  ·  ·  ·  ·  ·  ·  ·  ·  ·  ·  ·  · EUR 2,260 per capita
As % of GDP · · · · · · · · · · · · · · · · · · · · · · · · · · · · · · · · · · · · · · · · · · · · · · · · · · · · · · · · · · · · · · · · · · · · · 50.3%
Foreword . Summary . Development of global financial assets . How global financial assets are distributed . Regional differences . Literature . Appendix
	                                                                                                           Asia


76                       The financial assets of private households in                       lowed by China, where the Shanghai Stock Index
                         Asia were also dealt a blow by the financial cri-                   (A Shares) lost 21.6% after having already lost
                         sis: 2011 saw the weakest rise in total financial                   14.5% in the previous year. At the end of the year,
                         assets in the region since 2008. Compared with                      the Shanghai Stock Index was only 112 points
                         6.6% in 2010, financial assets in the countries                     higher than it had been at the end of 2000. The
                         included in our analysis grew by only 2.6% last                     Nikkei also continued on a downward spiral, not
                         year, totaling the equivalent of EUR 27,860bn at                    least due to the earthquake and devastating tsu-
                         the end of 2011.                                                    nami, losing a further 17.3% as against 2011. This
                                    The main culprit here was the poor per-                  means that the Nikkei has lost almost 40% of its
                         formance on most of Asia’s stock markets. With                      value since 2000.
                         the exception of the stock exchanges in Indo-
                         nesia and Malaysia, all of the leading indices in
                         the countries analyzed were down in 2011 in a
                         year-on-year comparison. Whereas Thailand’s
                         leading index only fell by 0.2%, the other coun-
                         tries saw rates of decline in the double digits: at
                         27%, the most marked slump was in India, fol-


                         Moderate growth of financial assets
                         Net financial assets and liabilities,                               Percentage change,
                         in EUR bn                                                           yoy

                         30,000                                                               12

                                                                                              10
                         25,000
                                                                                                8

                         20,000                                                                 6

                                                                                                4
                         15,000
                                                                                                2

                         10,000                                                                 0
                                            CAGR* 2001-2011:
                                            Net financial assets: 	       +4.7% p.a.           -2
                          5,000             Liabilities: 	                +2.8% p.a.
                                                                                               -4
                                            Gross financial assets: 	     +4.2% p.a.
                               0                                                               -6
                                	   ’00 	             ’07 	   ’08 	     ’09	   ’10	    ’11     	 ’00 	 ’01 	 ’02 	 ’03 	 ’04 	 ’05 	 ’06 	 ’07 	 ’08 	 ’09	 ’10	 ’11

                         *CAGR = Compound Annual Growth Rate                                                                                      Liabilities
                         Source: National Central Banks, Supervisory Authorities and Statistical Offices, Allianz SE                  Gross financial assets
                                                                                                                                        Net financial assets
Allianz Global Wealth Report 2012


             All in all, the value of financial assets                    58% by the end of last year. The proportion of                                   77

held in securities fell by 7.4% as a result, where-                       claims from life insurance policies and pension
as bank deposits swelled by 6.0% and claims                               schemes, on the other hand, remained virtually
from life insurance policies and pension funds                            constant at around 23%. Nevertheless, there are
climbed by 2.8%. The fact that total financial as-                        marked differences between countries in terms
sets grew by 2.6% despite the drop in share prices                        of the financial asset structure and, as a result,
is due primarily to the fact that the share of the                        also the growth in financial assets in the indi-
total portfolio taken up by securities had already                        vidual countries.
fallen since the outbreak of the financial crisis                                  In China, bank deposits have become
in most of the Asian countries in our analysis. In                        more popular again since the financial crisis,
the year before the financial crisis hit, namely in                       rising by almost 12% during the year. Claims vis-
2007, an average Asian household held 22.3% of                            à-vis life insurance policies and pension funds
its total assets in equities or fixed-income secu-                        increased by around 7%, while investments in
rities. By the end of 2011, this figure had dwin-                         securities are likely to have fallen by 11%. This
dled to only just under 17%. On the other side of                         means that, at the end of 2011, private house-
the equation, bank deposits have started gain-                            holds are likely to have held more than two-
ing ground again. After only just over half of to-                        thirds of their financial assets in bank deposits
tal financial assets (51%) had been held in bank
deposits in 2007, the proportion held in this
type of investment had bounced back to almost


Financial crisis left its mark on Asia’s stock markets
Development of most important equity indices
(2000=100)

1,000
                                                                                                                    IDX Composite
 900

 800

 700

 600

 500
                                                                                                            India BSE National 500
 400                                                                                                              Bangkok s.e.t. 50
                                                                                                       Korea SE Composite (KOSPI)
 300                                                                                                     FTSE Bursa Malaysia KLCI
                                                                                                                      Israel TA 100
 200                                                                                                          Taiwan SE Weighted
                                                                                                                 FTSE W Singapore
 100                                                                                                          Shanghai SE A Share
                                                                                                         Nikkei 225 Stock Average
    0
        	 ’00 	   ’01 	   ’02 	   ’03 	   ’04 	   ’05 	   ’06 	   ’07 	    ’08 	   ’09	   ’10	   ’11


Soruce: Datastream.
Foreword . Summary . Development of global financial assets . How global financial assets are distributed . Regional differences . Literature . Appendix
	                                                                                                           Asia


78                       and only around 14% in the form of equities and                                  In India and Indonesia, which have the
                         fixed-income securities; in 2007, securities ac-                     lowest financial assets out of the countries ana-
                         counted for 26%. Claims vis-à-vis life insurance                     lyzed, the development was once again charac-
                         policies and pension funds rose last year due to                     terized by the catch-up process in 2011. Financial
                         the growing significance of company and pri-                         assets in these two countries grew by 18.1% and
                         vate pension schemes, and are expected to have                       25.8% respectively. Securities assets, in particu-
                         accounted for around 11% of portfolios last year,                    lar, reported above-average growth last year. Not
                         in spite of the slump on the life insurance mar-                     least due to the fairly immature financial system,
                         ket. All in all, the gross financial assets of pri-                  however, Indian households still held more than
                         vate households rose by 7% to the equivalent of                      half of their financial assets, which totaled EUR
                         EUR 6,480bn, which corresponded to per capita                        895bn or EUR 720 per capita at the end of 2011,
                         financial assets of EUR 4,800. At the same time,                     in bank deposits. In Indonesia, the same figure
                         however, debt increased to 16.2% to EUR 1,665bn,                     comes in at almost two thirds. Here, financial
                         or EUR 1,230 per capita. This brought average                        assets totaled the equivalent of EUR 209bn at the
                         net financial assets in at EUR 3,570 per capita in                   end of 2011, or EUR 860 per capita. Private house-
                         2011.                                                                hold debt just outstripped the increase in finan-
                                                                                              cial assets in both countries, growing by almost
                                                                                              20% and 29.4% respectively. This explains why
                                                                                              the increase in net financial assets was slightly
                                                                                              lower than the increase in gross financial assets
                                                                                              in both countries. At the end of last year, net per
                                                                                              capita financial assets totaled EUR 640 in Indo-
                                                                                              nesia and around EUR 470 in India.


                         Bank deposits still dominate portfolios
                         Asset classes,                                         Asset classes as % of
                         percentage change yoy                                  gross financial assets

                          30                                                    100


                          20
                                                                                 80
                          10

                                                                                 60
                           0


                         -10
                                                                                 40

                         -20
                                                                                                                                                  Other
                                                                                 20
                         -30                                                                                                                  Insurance
                                                                                                                                              Securities
                         -40                                                       0                                                       Bank deposits
                               	 2008	       2009	      2010	       2011            	 ’01	 ’02	’03	 ’04	 ’05	’06 	’07 	’08 	’09	 ’10	’11


                         Source: National Central Banks, Supervisory Authorities and Statistical Offices, Allianz SE.
Allianz Global Wealth Report 2012


          In Israel, the fact that private households                           In Japan, too, private households saw                            79

hold more than half of their financial assets ei-                   their financial assets decline further last year,
ther directly or indirectly in the form of equities                 after gross financial assets had risen slightly
and fixed-income securities meant that the in-                      again in the two years prior to 2011. According to
crease in bank deposits to the tune of 11.4% and                    the Japanese central bank, these assets totaled
in life insurance and pension funds to the tune                     the equivalent of EUR 15,572bn (EUR 123,100 per
of 6.8% was not enough to compensate for the                        capita) at the end of 2011, down by 0.4% on the
9.4% loss in the value of securities, and the share                 prior year. This was fueled mainly by the decline
of total financial assets held in securities slid                   in fixed-income securities and investments held
from 61% to 57%. Total gross financial assets of                    in financial derivatives to the tune of 14.4% and
private households dropped by 2.2% as a result to                   15.0% respectively, as well as the poor perform-
the equivalent of EUR 482bn, which correspond-                      ance of the stock market, which prompted a 7.7%
ed to EUR 63,700 in per capita terms. During the
same period, however, loans increased by 9.6%,
cutting net per capita financial assets by 5.6% to
EUR 55,260 at the end of 2011.


Huge differences in asset structures
Asset classes as % of gross financial assets 2011, by country


      China

       India

  Indonesia

       Israel

      Japan

   Malaysia

  Singapore

South Korea                                                                                                      Other
                                                                                                             Insurance
     Taiwan
                                                                                                             Securities
   Thailand                                                                                               Bank deposits
                0    10       20       30       40       50       60       70       80         90   100


Source: National Central Banks, Supervisory Authorities and Statistical Offices, Allianz SE.
Foreword . Summary . Development of global financial assets . How global financial assets are distributed . Regional differences . Literature . Appendix
	                                                                                                           Asia


80                       loss in equity assets. Consequently, Japanese                                  Due to this development, the portfolio
                         households were hit by a 10.2% decline in their                     composition chosen by private households has
                         investments held in equities and fixed-income                       become more conservative: the share of bank
                         securities. Although their total value had only                     deposits has reached the highest value seen
                         accounted for a good 15% of total financial assets                  since 2001, accounting for more than 56% of to-
                         back in 2010, the 2.3% increase in bank deposits                    tal financial assets at the end of 2011. Life insur-
                         and 0.2% increase in life insurance and pension                     ance and pension funds have also continued to
                         funds were unable to compensate for this de-                        gain ground. Claims under these investment
                         cline.                                                              forms accounted for 27% of total financial assets,
                                                                                             whereas the share of portfolios held in other in-
                                                                                             vestment forms dropped to 3.0%. A glance at net
                                                                                             assets casts the situation of private households
                                                                                             in a slightly more positive light: since they con-
                                                                                             tinued to reduce their liabilities last year, name-
                                                                                             ly by 1.5%, net financial assets remained virtu-
                                                                                             ally constant overall, at the equivalent of around
                                                                                             EUR 11,755bn. In per capita terms, there was ac-
                                                                                             tually a slight increase from an average of EUR
                                                                                             93,060 to EUR 93,090.


                         Catch-up process largely intact
                         Gross financial assets, percentage change over previous year


                                  China

                                  India

                            Indonesia

                                  Israel

                                  Japan

                             Malaysia

                           Singapore

                         South Korea

                               Taiwan

                             Thailand

                                           -5             0                  5                10                15             20                25

                                                                                                                                               2011
                         Source: National Central Banks, Supervisory Authorities and Statistical Offices, Allianz SE.                          2010
Allianz Global Wealth Report 2012


        In Malaysia, the gross financial assets              Financial assets in South Korea grew                               81

of private households rose by 8.4% to the equiv-     by 5.3% – a similar rate to those in Singapore.
alent of EUR 364bn, or EUR 12,630 in per capita      Here, however, the trend was owed to the 10.4%
terms, last year. The main factor in this develop-   increase in claims under life insurance policies
ment was the fact that private households had        and pension funds and the 8.4% rise in bank de-
invested around one third of their financial as-     posits. Because the state pension system only
sets in bank deposits, securities and life insur-    provides minimal coverage, claims under life in-
ance and pension funds respectively. Equities,       surance policies and pension funds now account
on the other hand, only accounted for 50% of         for one quarter of total financial assets. Bank
the securities portfolio. This means that, while     deposits remain by far the most important as-
private households in this asset class saw much      set class, accounting for 46% of financial assets.
lower growth than in the previous year, growth       Securities investments lost 3.7% of their value
was still positive at 5%. Nevertheless, the growth   last year. Financial assets totaled the equivalent
in lending remained high: liabilities were up by     of EUR 1,504bn at the end of 2011, or EUR 31,830
12.5% to the equivalent of EUR 159bn. This put the   per capita. In net terms, however, the financial
net financial assets of private households at the    assets of private households fell due to the 8.5%
equivalent of EUR 205bn, which corresponded to       increase in debt, to an average of EUR 15,250, last
EUR 7,100 in per capita terms.                       year. This means that, at the equivalent of EUR
        In Singapore, the financial assets of pri-   16,580, average net per capita financial assets
vate households grew by a total of 5.5% thanks to    were only just over half as high as average gross
double-digit growth in bank deposits, whereas        per capita financial assets.
there was only a small increase in claims from
life insurance policies and pension funds, which
grew by 1.2% and 2.6% respectively. Total finan-
cial assets came in at the equivalent of EUR
435bn at the end of 2011, or EUR 83,910 per cap-
ita. The increase in debt was roughly the same
at 5.7%, bringing it to EUR 133bn at the end of
2011, meaning that the average Singaporean had
debt to the tune of EUR 25,700. As a result, net
financial assets amounted to EUR 302bn or EUR
58,200 per capita.
Foreword . Summary . Development of global financial assets . How global financial assets are distributed . Regional differences . Literature . Appendix
	                                                                                                           Asia


82                                  In Taiwan, equities and fixed-income                    households also slowed last year compared to
                         securities were the second most important as-                      2010: although debt rose by only 3.2%, this was
                         set class at the end of 2010, accounting for al-                   still higher than the rate of growth in finan-
                         most 33% of total financial assets, followed by                    cial assets. This put net financial assets at EUR
                         bank deposits, which accounted for 40%. As a                       1,413bn at the end of 2011, which corresponded
                         result, the 7.2% decline in securities also left its               to EUR 60,900 in per capita terms.
                         mark on overall development in 2011: although
                         bank deposits increased by 5.8% and receivables
                         from life insurance policies and pension funds
                         by as much as 9.3%, total financial assets only
                         increased by 2.1% to EUR 1,646bn or EUR 70,940
                         per capita. At the same time, the proportion of
                         bank deposits in relation to total financial as-
                         sets climbed to 41%, while the proportion of as-
                         sets held in securities dropped to less than 30%.
                         What is more, borrowing among Taiwanese


                         Japanese households are still the wealthiest in Asia
                         Gross financial assets by country, in %


                                                6    1
                                        6
                                                                       23
                                    2
                                1
                                                                                                                                               China
                                                                                                                                                India
                                                                                                                                           Indonesia
                                                                                 3                                                             Israel
                                                                                 1
                                                                                2                                                              Japan
                                                                                                                                            Malaysia
                                                                                                                                          Singapore
                                                                                                                                        South Korea
                                                                                                                                             Taiwan
                                               55
                                                                                                                                            Thailand


                         Source: National Central Banks, Supervisory Authorities and Statistical Offices, UN Population Division, World Population
                         Prospects, 2010 Revision, Allianz SE.
Allianz Global Wealth Report 2012


          Growth in Thailand was similarly sub-                             In a comparison of the different coun-                                     83

dued; here, the financial assets held in equities                 tries, Japan still has the highest financial assets
and securities slid by 2.3%. Bank deposits, how-                  in the region, with 55% of total financial assets
ever, which still account for more than 50% of                    attributable to Japanese households overall. Due
the overall portfolio of private households, in-                  to the sheer size of the population, China now
creased by 6.4%. This means that, all in all, pri-                accounts for 23%. It is followed by Taiwan and
vate households enjoyed a slight increase of 3.0%                 Singapore, each of which account for 6%. If, how-
in their gross financial assets last year. At the                 ever, we look at net per capita financial assets,
end of 2011, they came in at EUR 237bn, which                     the pecking order behind Japan changes: Japa-
corresponded to EUR 3,400 in per capita terms.                    nese households lead the field in this compari-
Private household debt, however, increased by                     son, too, with net financial assets of EUR 93,090
14.5% not least due to the devastating floods,                    per capita, making them the richest out of the
meaning that the average Thai person now has                      Asian countries analyzed. They are followed by
debt of EUR 1,060. As a result, net financial as-                 Taiwanese households with net financial assets
sets fell by 2.0% to EUR 2,390, compared with EUR                 of EUR 60,900, and then by Singapore with an av-
2,390 in 2010.                                                    erage of EUR 58,200, because debt levels are low-
                                                                  er than in Singapore. In gross terms, the order is
                                                                  precisely the other way round.


Japanese households are still the wealthiest in Asia
Net financial assets and liabilities per capita 2011, in EUR


       Japan        								                                                      (123,099)

  Singapore         							                                   (83,911)

     Taiwan         						                             (70,938)

       Israel       					                          (63,695)

South Korea         				               (31,829)

    Malaysia        			     (12,629)

      China         		 (4,809)
                                                                                                                  Liabilities
    Thailand        	 (3,405)
                                                                                                        Net financial assets
  Indonesia         (863)                                                                              Figures in brackets:
                                                                                                     Gross financial assets
       India        (721)                                                                                        per capita
                0           25,000        50,000   75,000       100,000       125,000

Source: National Central Banks, Supervisory Authorities and Statistical Offices, UN Population Division, World Population
Prospects, 2010 Revision, Allianz SE.
Foreword . Summary . Development of global financial assets . How global financial assets are distributed . Regional differences . Literature . Appendix


84
Australia and New Zealand

Population
Total  ·  ·  ·  ·  ·  ·  ·  ·  ·  ·  ·  ·  ·  ·  ·  ·  ·  ·  ·  ·  ·  ·  ·  ·  ·  ·  ·  ·  ·  ·  ·  ·  ·  ·  ·  ·  ·  ·  ·  ·  ·  ·  ·  ·  ·  ·  ·  ·  ·  ·  ·  ·  ·  ·  ·  ·  ·  ·  ·  ·  ·  ·  ·  ·  ·  ·  ·  ·  ·  ·  ·  ·  ·  ·  ·  · 27 m
Proportion of the global population · ·  ·  ·  ·  ·  ·  ·  ·  ·  ·  ·  ·  ·  ·  ·  ·  ·  ·  ·  ·  ·  ·  ·  ·  ·  ·  ·  ·  ·  ·  ·  ·  ·  ·  ·  ·  ·  ·  ·  ·  ·  ·  ·  ·  · 0.4%

GDP
Total  ·  ·  ·  ·  ·  ·  ·  ·  ·  ·  ·  ·  ·  ·  ·  ·  ·  ·  ·  ·  ·  ·  ·  ·  ·  ·  ·  ·  ·  ·  ·  ·  ·  ·  ·  ·  ·  ·  ·  ·  ·  ·  ·  ·  ·  ·  ·  ·  ·  ·  ·  ·  ·  ·  ·  ·  ·  ·  ·  ·  ·  ·  ·  ·  ·  ·  ·  · EUR 1,260bn
Proportion of global GDP ·  ·  ·  ·  ·  ·  ·  ·  ·  ·  ·  ·  ·  ·  ·  ·  ·  ·  ·  ·  ·  ·  ·  ·  ·  ·  ·  ·  ·  ·  ·  ·  ·  ·  ·  ·  ·  ·  ·  ·  ·  ·  ·  ·  ·  ·  ·  ·  ·  ·  ·  ·  ·  ·  ·  ·  · 2.4%

Gross financial assets of private households
Total  ·  ·  ·  ·  ·  ·  ·  ·  ·  ·  ·  ·  ·  ·  ·  ·  ·  ·  ·  ·  ·  ·  ·  ·  ·  ·  ·  ·  ·  ·  ·  ·  ·  ·  ·  ·  ·  ·  ·  ·  ·  ·  ·  ·  ·  ·  ·  ·  ·  ·  ·  ·  ·  ·  ·  ·  ·  ·  ·  ·  ·  ·  ·  ·  ·  ·  ·  · EUR 2,240bn
Average ·  ·  ·  ·  ·  ·  ·  ·  ·  ·  ·  ·  ·  ·  ·  ·  ·  ·  ·  ·  ·  ·  ·  ·  ·  ·  ·  ·  ·  ·  ·  ·  ·  ·  ·  ·  ·  ·  ·  ·  ·  ·  ·  ·  ·  ·  ·  ·  ·  ·  ·  ·  ·  ·  ·  · EUR 82,970 per capita
Proportion of global financial assets ·  ·  ·  ·  ·  ·  ·  ·  ·  ·  ·  ·  ·  ·  ·  ·  ·  ·  ·  ·  ·  ·  ·  ·  ·  ·  ·  ·  ·  ·  ·  ·  ·  ·  ·  ·  ·  ·  ·  ·  ·  ·  ·  ·  · 2.2%

Debt
Total  ·  ·  ·  ·  ·  ·  ·  ·  ·  ·  ·  ·  ·  ·  ·  ·  ·  ·  ·  ·  ·  ·  ·  ·  ·  ·  ·  ·  ·  ·  ·  ·  ·  ·  ·  ·  ·  ·  ·  ·  ·  ·  ·  ·  ·  ·  ·  ·  ·  ·  ·  ·  ·  ·  ·  ·  ·  ·  ·  ·  ·  ·  ·  ·  ·  ·  ·  · EUR 1,380bn
Average ·  ·  ·  ·  ·  ·  ·  ·  ·  ·  ·  ·  ·  ·  ·  ·  ·  ·  ·  ·  ·  ·  ·  ·  ·  ·  ·  ·  ·  ·  ·  ·  ·  ·  ·  ·  ·  ·  ·  ·  ·  ·  ·  ·  ·  ·  ·  ·  ·  ·  ·  ·  ·  ·  ·  · EUR 51,010 per capita
As % of GDP · · · · · · · · · · · · · · · · · · · · · · · · · · · · · · · · · · · · · · · · · · · · · · · · · · · · · · · · · · · · · · · · · · · · 109.3%
Foreword . Summary . Development of global financial assets . How global financial assets are distributed . Regional differences . Literature . Appendix
	                                                                                                           Australia and New Zealand


86                       At around EUR 2.2 trillion, Australia and New                       the world’s industrialized nations as a whole.
                         Zealand were home to 2.2% of global gross fi-                       This is due first and foremost to the weak year
                         nancial assets last year. The asset base has more                   on the stock markets, which put particular pres-
                         than doubled since 2000 thanks to the com-                          sure on Australian households. Although they
                         modities boom, with per capita assets in the                        only invest a small proportion (around 8%) of
                         region, less liabilities, climbing to almost EUR                    their financial assets in securities, the vast ma-
                         83,000. Although Australians were hit hard by                       jority of these holdings were in the form of direct
                         the slump in commodity prices in 2008 and the                       shareholdings/other equity interests (a good
                         losses on the stock markets, the country was                        85%). As a result, fixed-income securities could
                         not plunged into a recession and made a rapid                       only soften the blow to a minor extent, meaning
                         recovery in the aftermath of the crisis. Only one                   that securities assets contracted by more than
                         year later, Australia had made up for most of the                   21% overall. Nonetheless, the gross financial as-
                         asset losses again. In comparison with the rapid                    sets of Australia’s citizens increased slightly, all
                         growth seen in the first decade of this century,                    in all, growing by 0.5% thanks to robust growth
                         when the region achieved growth averaging 8.2%                      in bank deposits and a more conservative asset
                         per annum in spite of the crisis, regional asset                    structure on the whole.
                         growth in 2011 came in at a meager 0.7% – this
                         was, however, sufficient to allow the region to
                         keep pace with the development witnessed in


                         Net financial assets slip
                         Net financial assets and liabilities,                               Net financial assets and liabilities per capita,
                         in EUR bn                                                           in EUR

                         2,400                                                               90,000
                         2,200
                                                                                             80,000
                         2,000
                                                                                             70,000
                         1,800
                         1,600                                                               60,000
                         1,400
                                                                                             50,000
                         1,200
                                                                                             40,000
                         1,000
                           800                                                               30,000
                                             CAGR* 2001-2011:                                                  CAGR* 2001-2011:
                           600
                                             Net financial assets: 	    +3.9% p.a.           20,000            Net financial assets: 	       +2.4% p.a.
                           400               Liabilities: 	            +10.8% p.a.                             Liabilities: 	                +9.2% p.a.
                                                                                             10,000
                           200               Gross financial assets: 	 +7.5% p.a.                              Gross financial assets: 	     +6.0% p.a.
                             0                                                                     0
                                 	   ’00 	            ’07 	   ’08 	   ’09	   ’10	    ’11           	   ’00 	             ’07 	   ’08 	     ’09	   ’10	    ’11

                         *CAGR = Compound Annual Growth Rate                                                                                   Liabilities
                         Source: National Central Banks and Statistical Offices, UN, Allianz SE.                                     Net financial assets
Allianz Global Wealth Report 2012


Citizens in neighboring New Zealand fared bet-                                 There is still a marked prosperity and                         87

ter, actually outperforming the global average.                    asset gap between the two countries: whereas
Their asset base grew by 3.9%. The positive devel-                 per capita economic output in Australia stood
opment in bank deposits and insurance, which,                      at EUR 50,370 at the end of 2011, the same figure
taken together, accounted for almost 68% of the                    for New Zealand was around half this amount.
asset portfolio, more than compensated for the                     The discrepancy in financial assets is even more
losses affecting securities assets (-3.8%). In net                 evident: in gross terms, Australians had assets
terms, i.e. taking personal liabilities into ac-                   worth EUR 93,360 per capita, while their neigh-
count, financial assets in the region dropped by                   bors in New Zealand did not even have one third
5.6% in total – debt grew at a rate of more than                   of this amount. Taking the liabilities into ac-
5%, more than seven times faster than assets.                      count, the financial assets of households in New
                                                                   Zealand actually equated to only 12% of the net
                                                                   financial assets of Australian households, aver-
                                                                   aging EUR 4,440 per capita. Admittedly, at EUR
                                                                   25,310, the absolute debt levels of New Zealand
                                                                   households were far lower than in Australia (EUR
                                                                   56,030). If, however, we compare both countries
                                                                   based on the relative debt burden, New Zealand
                                                                   is carrying far more weight on its shoulders: for
                                                                   each euro borrowed, households in New Zealand


Conservative asset structure cushions losses of asset class securities
Asset classes as % of gross financial assets

Australia                                                 New Zealand

100


                                                                        16            15
                                                           25                  14            16     17
  75
         54          60     57     59     62
                                                 62
                                                                                24    26            23
                                                                        30                   25
  50
                                                           33

         21                 12     13     10     8
  25                 17
                                                                                52           50     51
                                                                        46            49
                            26     25     25     27        36
         20          19
   0
       	 ’00	        ’07	   ’08	   ’09	   ’10	   ’11    	 ’00	          ’07	   ’08	   ’09	   ’10	   ’11


Source: Australian Bureau of Statistics, Reserve Bank of New Zealand, Allianz SE.
Foreword . Summary . Development of global financial assets . How global financial assets are distributed . Regional differences . Literature . Appendix
	                                                                                                           Australia and New Zealand


88                       only have EUR 1.20 in assets, while the Austral-                      Debt growth continues to slow
                         ians have over 41% more to offer in assets, at EUR                    A continuous upward trend in personal liabili-
                         1.70. Finally, in net terms New Zealand only nar-                     ties has been a hallmark of both countries over
                         rowly lost its status as a MWC – a gap of only EUR                    the past ten years. Growth rates reached their
                         60 prevented the country from jumping into the                        peak in the years leading up to the financial and
                         middle wealth class. In contrast, Australia quali-                    economic crisis, averaging more than 13% a year.
                         fied without any problems as a HWC – both in                          It is, however, not so much to finance consump-
                         net and gross terms. In the global rankings (net                      tion that Australians and New Zealanders have
                         per capita financial assets), New Zealand took                        been accumulating debt, but rather to finance
                         34th place at the end of 2011, which is, at least,                    their homes: mortgage loans accounted for just
                         one place better than in the previous year. In a                      under 91% of total loans in Australia, and as
                         longer-term analysis, however, the country has                        much as over 93% of total loans in New Zealand,
                         slid ten places down the rankings, widening the                       in 2011. House prices were on a dizzying ascent
                         gap separating it from Australia from twelve                          up until 2007, forcing new buyers to take out
                         places in 2000 to 17 in 2011.                                         ever larger loans. The annual growth in personal
                                                                                               debt has been slowing in recent years, bringing
                                                                                               it down to 5.5% in Australia and 0.9% in New Zea-
                                                                                               land in 2011.


                         Net financial assets and liabilities per capita, in EUR
                         Australia	                                                            New Zealand


                         100,000                                                               100,000

                          90,000                                                                90,000

                          80,000                                                                80,000
                                                                                                                 CAGR* 2001-2011:
                          70,000                                                                70,000
                                                                                                                 Net financial assets: 	       -5.1% p.a.
                          60,000                                                                60,000           Liabilities: 	                +7.3% p.a.
                                                                                                                 Gross financial assets: 	     +3.9% p.a.
                          50,000                                                                50,000

                          40,000                                                                40,000

                          30,000                                                                30,000
                                              CAGR* 2001-2011:
                          20,000              Net financial assets: 	       +2.7% p.a.          20,000
                                              Liabilities: 	                +9.4% p.a.
                          10,000              Gross financial assets: 	     +6.1% p.a.          10,000

                                0                                                                   0
                                	     ’00 	             ’07 	   ’08 	     ’09	   ’10	    ’11        	    ’00 	             ’07 	   ’08 	     ’09	   ’10	    ’11

                         *CAGR = Compound Annual Growth Rate                                                                                     Liabilities
                         Source: Australian Bureau of Statistics, Reserve Bank of New Zealand, UN, Allianz SE.                         Net financial assets
Allianz Global Wealth Report 2012


    This stabilized the debt burden as a proportion                      with low interest rates, to make early repay-                                         89

    of GDP. Households in Australia used the phase                       ments. Finally, insurance benefits paid out in
    between August 2008 and August 2009 in partic-                       the aftermath of the earthquake in Canterbury
    ular to push debt growth back down to below the                      also helped to slow credit growth, at least tem-
    level of economic growth as a whole. During this                     porarily: an estimated EUR 1.8bn in insurance
    period, average variable interest rates on mort-                     payments entered the banking system, with
    gage loans fell by almost 4 percentage points.                       some of these payments presumably being used
              In New Zealand, the personal debt ratio                    to reduce outstanding mortgage loans before
    at the end of last year was down by 3.5 percent-                     the start of reconstruction work.
    age points in a year-on-year comparison. House-
    holds benefited from ongoing income growth –                                   	
    partially bolstered by tax relief measures – and
    from a relatively steady rise in consumer prices
    thanks to lower import costs. Households used
    at least some of the resulting savings, coupled


    Liabilities’ growth rate declines
    Debt-to-GDP ratio (lhs) and debt growth (rhs), in %


    120                                                                                             18.0


                                                                                                    15.0
     90
                                                                                                    12.0


     60                                                                                             9.0
                                                                                                                    Liabilities as %
                                                                                                                 of GDP, Australia
                                                                                                    6.0            Liabilities as %
                                                                                                            of GDP, New Zealand
     30
                                                                                                    3.0             Growth rate of
                                                                                                               liabilities, Australia

                                                                                                                      Growth rate of
      0                                                                                             0      liabilities, New Zealand
	         ’01	    ’02	    ’03	    ’04	    ’05	     ’06	   ’07	    ’08	      ’09	       ’10	   ’11


    Source: Australian Bureau of Statistics, Reserve Bank of New Zealand, Allianz SE.
Allianz Global Wealth Report 2012


Literature
                                                                                                                                 91

Aron, Janine; Muellbauer, John; Prinsloo, Johan: “Estimating the Balance Sheet of the Personal Sec-
tor in an Emerging Market Country. South Africa 1975 – 2003”, United Nations University, UN-Wider,
Research Paper No. 2006/99, 2006

Ariyapruchaya, Kiatipong: “Thailand’s household sector balance sheet dynamics: evidence from
microeconomic and macroeconomic data”, IFC Bulletin, No. 25, p. 91-100, 2007

Attanasio, Orazio and Székely, Miguel: “Household Saving in Developing Countries – Inequality,
Demographics and All That: How Different are Latin America and South East Asia?”, Inter-American
Development Bank, Working Paper No. 427, 2000

Bricker, Jesse; Bucks, Brian, Kennickell, Arthur; Mach, Traci; Moore, Kevin: “Surveying the Aftermath of
the Storm: Changes in Family Finances from 2007 to 2009”, Finance and Economics Discussion Series,
Division of Research & Statistics and Monetary Affairs, Federal Reserve Board, Washington, D.C.

Davies, James B.; Sandstrom, Susanna; Shorrocks, Anthony; Wolff, Edward N.:
“The Level and Distribution of Global Household Wealth”, November 2009.

Jalava, Jukka and Kavonius, Ilja Kristian: “Durable Goods and their Effect on Household Saving
Ratios in the Euro Area”, European Central Bank, Working Paper Series, No 755, May 2007

Reinhart, Carmen and Plies, William: “Saving in Latin America and Lessons from Europe: An Over-
view”. Published in: Carmen M. Reinhart, ed., Accounting for Saving: Financial Liberalization, Capital
Flows, and Growth in Latin America and Europe (Washington DC: John Hopkins University Press for
the Inter-American Development Bank, 1999) : pp. 3-47

Roxburgh, Charles; Lund, Susan; Wimmer, Tony; Amar, Eric; Atkins, Charles; Kwek, Ju-Hon;
Dobbs, Richard; Manyika, James: “Debt and Deleveraging: The Global Credit Bubble and its Economic
Consequences”, McKinsey Global Institute, January 2010

Schmitt-Hebbel, Webb, and Corsetti: “Household Saving in Developing Countries:
First Class-Cross Country Evidence”, The World Bank Economic Review, Vol. 6, No. 3, 1992

Shanghai Stock Exchange: Factbook 2010.

Thorne, Susie and Cropp, Jill: “Household Saving in Australia”, Australian Treasury,
Domestic Economy Division, 2008

Thorp, Clive and Ung, Bun: “Recent Trends in Household Financial Assets and Liabilities”,
Reserve Bank of New Zealand: Bulletin Vol. 64 No. 2, 2000

Tiongson, Erwin R.; Sugawara, Naotaka; Sulla, Victor; Taylor, Ashley; Gueorguieva, Anna I.;
Levin, Victoria; Subbarao, Kalanidhi: “The Crisis hits Home: Stress-Testing Households in Europe and
Central Asia”, The International Bank for Reconstruction and Development / The World Bank, 2010

Torche, Florencia and Spilerman, Seymour: “Household Wealth in Latin America”,
United Nations University, UN-Wider, Research Paper No. 2006/114, October 2006

United Nations, ECLAC: “Social Panorama of Latin America 2010 · Briefing Paper”

Wieland, Dr. Carsten: “Kolumbien auf dem Weg zur Sozialen Marktwirtschaft?”,
Konrad Adenauer Stiftung, April 2008.
Foreword . Summary . Development of global financial assets . How global financial assets are distributed . Regional differences . Literature . Appendix


                         Appendix A: Methodological comments
92

                         General assumptions
                         The Allianz Global Wealth Report is based on data from 52 countries. This group of countries covers
                         almost 93% of global GDP and around 69% of the global population. In 41 countries, we had access to
                         statistics from national wealth balance sheets. In the other countries, we were able to estimate the vol-
                         ume of total financial assets based on information from household surveys, bank statistics, statistics
                         on assets held in equities and bonds, and technical reserves.


                         In many countries, it is still extremely difficult to find data on the financial assets of private house-
                         holds. Let’s take the Latin American countries as an example. For many of these countries, the only
                         information that can be found relates to the entire private sector or the economy as a whole, which
                         is often of only limited use as far as the situation of private households is concerned. In addition to
                         Mexico, other countries with fairly good data that can be used to analyze the financial structure of
                         private household assets are Chile and Colombia. In Argentina, for example, we were able to estimate
                         financial assets with the help of data on bank deposits and insurance reserves.


                         In order to rule out exchange rate distortions over time, the financial assets were converted into the
                         national currency based on the fixed exchange rate at the end of 2011.


                         Determination of wealth bands for middle wealth countries (MWC)
                         Lower wealth threshold: there is a close link between financial assets and the incomes of private house-
                         holds. According to Davies et al., private individuals with below-average income tend to have no assets
                         at all, or only very few. It is only when individuals move into middle and higher income groups that they
                         start to accumulate any assets to speak of.


                         We have applied this link to our country analysis. Countries in the upper-middle income bracket (based
                         on the World Bank’s country classification system) therefore form the group in which the average as-
                         sets of private households has reached a relevant volume for the first time. This value marks the lower
                         threshold for middle wealth countries. How high should this value be?
Allianz Global Wealth Report 2012


                                                                                                                                  93


In terms of income, households with incomes that correspond to between 75% and 150% of average net
income are generally considered to constitute the middle class. According to Davies et al., households
with income corresponding to 75% of the average income have assets that correspond to 30% of the
average assets. As far as the upper threshold is concerned, 150% of average income corresponds to 180%
of average assets. Consequently, we have set the threshold values for the wealth middle class at 30%
and 180% of average per capital assets. If we use net financial assets to calculate the two thresholds, we
arrive at an asset range of between EUR 4,500 and EUR 26,800 for 2011. The gross thresholds lie at EUR
6,400 and EUR 38,700.


Countries with higher per capita financial assets are then classed as HWCs (high wealth countries).
Countries with lower per capita financial assets are the LWCs (low wealth countries).


HWC                                     MWC                                      LWC
Australia*                              Chile*                                   Argentina***
Austria*                                Croatia**                                Brazil***
Belgium*                                Czech Republic*                          Bulgaria**
Canada*                                 Estonia**                                China**
Denmark*                                Finland*                                 Colombia***
France*                                 Greece*                                  India***
Germany*                                Hungary*                                 Indonesia***
Israel**                                Ireland*                                 Kazakhstan***
Italy*                                  Malaysia**                               Latvia*
Japan*                                  Mexico**                                 Lithuania*
Netherlands*                            Norway*                                  New Zealand*
Singapore**                             Portugal*                                Peru**
Sweden*                                 Romania**                                Poland*
Switzerland**                           Slovenia*                                Russia***
Taiwan**                                South Korea*                             Slovakia*
United Kingdom*                         Spain*                                   South Africa***
USA*                                                                             Thailand***
                                                                                 Turkey***
                                                                                 Ukraine***


*2011 asset balance sheet	   **Extrapolation based on 2010 asset balance sheet
***Approximated based on other statistics
Foreword . Summary . Development of global financial assets . How global financial assets are distributed . Regional differences . Literature . Appendix


94
Gross financial                                  Net financialGlobal Wealth Report 2012
                                                                                                   Allianz
  Appendix B:                                   assets                                              assets                  GDP
Financial assets
    by country     Global share, in %   in EUR bn         2011, yoy in %   EUR per capita   EUR per capita        EUR per capita

           USA                 37.46      38,693                     1.7         123,586           90,417                 37,093
          Japan                15.07      15,572                   -0.4          123,099           93,087                 37,075
                                                                                                                                95
          China                 6.27       6,480                     7.0           4,809            3,573                  4,047
United Kingdom                  4.96        5,128                  -0.4           82,162           52,600                 28,916
      Germany                   4.56        4,715                   1.2           57,384           38,521                 31,289
         France                 3.87       4,002                   -0.2           63,392           42,643                 31,620
           Italy                3.44       3,549                    -3.1          58,380           42,875                 25,995
        Canada                  3.18       3,281                   -0.5           95,530           59,913                 37,852
       Australia                2.04        2,110                   0.5           93,359           37,330                 50,371
   Netherlands                  1.77       1,832                    3.6          109,943           61,315                 36,130
          Spain                 1.66        1,716                   -3.5          36,944           16,875                 23,106
    Switzerland                 1.60       1,654                    2.5          214,794          138,062                 60,417
        Taiwan                  1.59       1,646                    2.1           70,938           60,893                 15,086
   South Korea                  1.49       1,540                    5.3           31,829           16,581                 17,095
          Brazil                1.25       1,287                   12.7            6,545            2,981                  8,701
       Belgium                  0.91         940                    4.4           87,455           68,491                 34,310
          India                 0.87         895                   18.1              721              643                  1,041
        Mexico                  0.74         768                    4.7            6,688            5,753                  6,895
       Sweden                   0.71         736                    -2.4          77,962           42,104                 41,600
      Denmark                   0.61         632                    2.9          113,463           49,220                 43,133
        Austria                 0.49         509                    0.0           60,509           40,648                 35,813
          Israel                0.47         482                    -2.2          63,695           51,562                 23,184
     Singapore                  0.42         435                    5.5           83,911           58,215                 37,427
       Portugal                 0.37         384                    -3.3          35,953           19,572                 15,998
         Russia                 0.35         366                   17.9            2,566            1,549                  9,164
       Malaysia                 0.35         364                    8.4           12,629             7,130                 7,180
       Norway                   0.35         357                    3.4           72,589            6,508                 71,045
        Ireland                 0.29         300                    0.5           66,252           25,461                 34,566
        Poland                  0.28         285                     5.7           7,434            4,153                  8,919
        Greece                  0.24         244                    -9.1          21,379            8,830                 18,884
       Thailand                 0.23         237                    3.0            3,405            2,340                  3,702
        Finland                 0.22         232                    -3.5          43,042           19,105                 35,576
          Chile                 0.22         228                    5.2           13,197            9,459                 10,325
         Turkey                 0.21         221                   13.0            2,998            1,659                  7,172
      Indonesia                 0.20         209                   25.8              863              467                  2,604
   South Africa                 0.17         176                     7.3           3,486            1,260                  5,605
    Czech Rep.                  0.15         151                    6.0           14,353            9,408                 14,179
      Romania                   0.14         147                    2.4            6,856            5,343                  6,240
      Colombia                  0.13         132                   14.6            2,808            1,558                  5,025
  New Zealand                   0.13         131                    3.9           29,745            4,437                 27,838
       Hungary                  0.08          88                    -5.6           8,798            5,224                  8,975
     Argentina                  0.07          70                   24.4            1,722             1,167                 8,087
           Peru                 0.07          70                    0.9            2,375            1,931                  4,295
        Ukraine                 0.06          60                    6.0            1,329              928                  2,802
       Slovakia                 0.04          45                    8.1            8,156            1,938                 12,621
        Croatia                 0.04          43                   -6.4            9,724            5,482                 10,323
       Slovenia                 0.04          41                    -1.7          20,197           14,049                 17,519
       Bulgaria                 0.03          36                    0.0            4,806             3,191                 5,168
      Lithuania                 0.02          24                   11.9            7,349            4,089                  9,285
    Kazakhstan                  0.02          22                   20.9            1,355              539                  8,594
        Estonia                 0.02          21                    5.4           15,540            9,672                 11,919
         Latvia                 0.01          12                    3.9            5,290            1,392                  9,025

         World                           103,299                                  21,493           14,881
Imprint
Publisher
Allianz SE
Economic Research & Corporate Development
Königinstraße 28
80802 Munich
www.allianz.com


Chief Economist
Dr. Michael Heise

Authors
Kathrin Brandmeir
Dr. Michaela Grimm
Dr. Arne Holzhausen
Gabriele Steck

Editors
Heike Bähr
Alexander Maisner
Dr. Lorenz Weimann

Photos
Helge Mundt

Design
Schmitt. Kommunikation, Hamburg

Closing date
31. July 2012

Legal disclaimer
The information contained in this publication has
been carefully researched and checked by Allianz
SE or reliable third parties. However, Allianz Group
and any third party do not assume liability for the
accuracy, completeness and up-to-dateness of the
contents. The authors’ opinions are not necessarily
those of Allianz SE. Statements do not constitute any
offer or recommendation of certain investments, even
if individual issuers and securities are mentioned.
Information given in this issue is no substitute for
specific investment advice based on the situation of
the individual investor. For personalized investment
advice please contact Allianz SE.
Foreword . Summary . Development of global financial assets . How global financial assets are distributed . Regional differences . Literature . Appendix


98

Allianz Global Wealth Report

  • 1.
    Economic Research & CorporateDevelopment Allianz Global Wealth Report 2012
  • 3.
    Allianz Global Wealth Report 2012 KathrinBrandmeir Dr. Michaela Grimm Dr. Michael Heise Dr. Arne Holzhausen Gabriele Steck
  • 5.
    Allianz Global WealthReport 2012 Preface 5 At first glance, global wealth development paints an impressive picture: last year, the finan- cial assets of private households worldwide topped the 100 trillion mark. This is a staggering amount, enough to allow savers to buy the outstanding government bonds of every country in the world three times over. If we scratch beneath the surface, however, the development proves to be anything but spec- tacular. Since 2000, per capita financial assets have been growing at an average rate of 3% a year – roughly on a par with the global rate of inflation during this period. In other words: over the past eleven years, savers have not, on average, managed to achieve any real value gains. The reason behind this development is obvious: any attempts by households to save have been scuppered by the recurring crises on the financial markets; wealth development in the US and Europe has been particularly disappointing of late. In 2011, western Europe was actually the only region in the world in which assets contracted overall. The trend definitely provides food for thought. The longer it takes to restructure the financial markets and find a sustainable solution to the eurozone debt crisis, in particular, the greater the risk of “losing” a whole generation of savers because the idea of long-term investment is eyed with deep mistrust. But given the major challenges that lie ahead, from the shifts in the global economic and political weights, to climate change and demographic change, we cannot afford to take the short-sighted approach. Confidence in the financial markets, which serve to balance out risks and returns in the long term, is a must if we want to achieve sustainable growth and prosperity. But there is another aspect of global wealth development that harbors risks. This time, it is the other side of the coin; private household debt. Although debt growth has slowed consider- ably across the globe over the past few years – in the US, debt actually declined for the fourth year running in 2011 – the pace of debt growth is still too fast, particularly on the emerging markets, which, even today, are still reporting annual growth rates of 20%. So the third issue of the “Allianz Global Wealth Report“, which takes another detailed look at the global wealth and debt situation of private households based on international data, provides not only a cornucopia of information and comparisons, but also leaves readers with plenty to chew over in their minds. I am convinced that, in doing so, the report makes an im- portant contribution by looking at current problems from a different perspective, namely the perspective of savers, who are, unfortunately, all too often overlooked in the political debate, although they are essential to our long-term prosperity. Michael Diekmann Chairman of the Board of Management of Allianz SE
  • 7.
    Table of contents 9 Summary 13 Development of global financial assets: Personal assets in the shadow of the crisis 29 How global financial assets are distributed: How big is the world’s middle class in terms of wealth? 37 Regional differences: Financial assets in individual regions 91 Literature 92 Appendix A: Methodological comments 95 Appendix B: Financial assets by country
  • 8.
  • 9.
    Allianz Global WealthReport 2012 The development in global gross financial Global prosperity gap and different catch-up assets of private households in 2011 was processes 9 largely disappointing. The growth rate In order to paint a more sophisticated pic- slowed to 1.6%, the lowest level seen since ture of global wealth distribution by country, the crisis-ridden year of 2008. Not least due the Allianz Global Wealth Report has split to the weaker euro, financial assets in the 52 the countries evaluated into three wealth countries included in our analysis neverthe- classes, similar to the income classes used less surpassed the EUR 100 trillion mark for by the World Bank: high wealth countries the first time, coming in at EUR 103.3 trillion (HWC) with average net per capita finan- at the end of 2011. Global financial assets cial assets of more than EUR 26,800; mid- have been growing at an average rate of 4.0% dle wealth countries (MWC), net per capita a year since 2000, slower than the growth in financial assets of between EUR 4,500 and nominal economic output. At a good 3%, per EUR 26,800; and low wealth countries (LWC), capita growth in financial assets has only net per capita financial assets of less than been on a par with average global inflation EUR 4,500. during the same period. This means that sav- ers worldwide have not been able to achieve Wealth is distributed very unevenly through- any real asset growth over the past eleven out the world. Even today, around 85% of glo- years. bal net financial assets are still in the hands of private households in HWCs, although 2011 also saw private household debt climb these countries are home to less than 20% of to a new record high of EUR 31.8 trillion. The the global population. The global prosperity pace of debt growth has, however, slackened gap is immense from a per capita perspec- considerably since the financial crisis of tive, too: net per capita financial assets in the 2007/08, coming in at “only” 2.2% last year. HWCs totaled EUR 70,590 at the end of 2011, This resulted in an improvement in the glo- several times higher than in the LWCs, where bal debt ratio (liability of private households the same figure came in at only EUR 2,040 as percent of global GDP) to 67.0%, a far cry per capita. People in MWCs had average net from the pre-crisis high of 2007 (71.4%). financial assets worth EUR 10,240. Global net financial assets (gross financial The considerable variance in the levels also assets less liabilities) reached EUR 71.5 tril- implies marked differences in growth. Net lion at the end of 2011. Over the past decade, per capita financial assets in the LWCs has the growth in net financial assets has lagged been growing by almost 16% a year since significantly behind the growth in gross 2000, eight times faster than in the HWCs. financial assets at 3.4% a year, a side effect of At the beginning of the decade, per capita the rapid debt growth prior to the outbreak of financial assets in the HWCs were still 141 the financial crisis. At EUR 14,880 per capita, times as high as in the LWCs, a factor that net financial assets at the end of 2011 were has since been reduced to 35. also still slightly down on the historical high reached in 2007.
  • 10.
    Foreword . Summary. Development of global financial assets . How global financial assets are distributed . Regional differences . Literature . Appendix These marked differences in growth also Although eastern European households 10 mirror the varying impact of the latest still have the lowest net per capita financial financial crises. The world’s poorer coun- assets as a region, they topped the growth tries have escaped these slumps virtually charts both last year and looking at the last unscathed: average per capita net financial decade as a whole: net per capita financial assets in the LWCs, for example, are already assets have increased by almost 12% a year almost 38% higher than they were in 2007, on average since 2000, with developments whereas in the HWCs, financial assets are in Latin America and the Asian emerging still lingering at a level that is 3.2% lower markets looking similarly dynamic. The than the pre-crisis level. financial crisis has, however, triggered a considerable reduction in the annual growth Compared with the LWCs, the MWCs have rate in all three regions. The crisis has dealt been much slower in playing catch-up since an even greater blow to the richer parts of 2000. The annual growth in net per capita fi- the world: in these regions (North America, nancial assets in this group of countries was western Europe and Oceania), net per capita “only” twice as high as in their richer coun- financial assets are still down on the level terparts. This can be explained by a combi- seen in 2007. Both over the entire decade nation of a relatively high debt level to begin starting in 2000 (+1.3% a year) and in 2011 with and considerable debt momentum in (-1.5%), western Europe reported the poorest these countries: as with gross financial as- growth performance. The euro crisis is tak- sets, debt also grew more than twice as fast ing its toll. as in the HWCs over the same period. World seeks refuge in security Households in eastern Europe remain the In addition to the level of assets and asset “growth champions” growth, there are also very marked differ- A regional analysis returns the expected ences in asset structures worldwide. In the result: on the one hand, we have the rich HWCs, financial assets are distributed more regions of North America, western Europe or less evenly among the three major asset and Oceania, with average net per capita fi- classes: bank deposits, insurance policies/ nancial assets of between almost EUR 32,000 pensions and securities, although the latter and EUR 87,400, and on the other, there are still dominate with a share of more than the poorer countries of Asia, Latin America 37%. In the LWCs, by far the majority of as- and eastern Europe, where the same figure sets (63%) are held in bank deposits – as was comes in at only somewhere between EUR already the case before the outbreak of the 2,430 and EUR 6,620; without the four HWCs financial crisis – and in MWCs, too, bank of Israel, Japan, Taiwan and Singapore, the deposits still account for more than 40% of corresponding value for Asia’s emerging all financial assets. markets actually comes in at only EUR 2,320.
  • 11.
    Allianz Global WealthReport 2012 Nevertheless, more security-focused than 723 million people fall into the wealth middle return-oriented investment strategies have class 11 since become something of a global trend. The analysis of wealth distribution by coun- Bank deposits have upped their share of glo- try neglects to take account of differences bal financial assets by almost five percent- within individual countries. Consequently, age points over the past decade and, in some the Allianz Global Wealth Report has also cases, have been reaping above-average ben- calculated the average net per capita fi- efits in richer regions like Australia, western nancial assets per population decile within Europe and North America. But as far as the the countries analyzed. According to this need for long-term wealth accumulation is calculation, 723 million people worldwide concerned, the tendency to “flee” to low-risk belonged to the global wealth middle class investments appears counterproductive. in 2011 (net per capita financial assets of be- This is why a fast solution to the debt crises is tween EUR 4,500 and EUR 26,800). This figure an absolute must if investor confidence is to has more than doubled since 2000. The new make a comeback. wealth middle class is being recruited al- most exclusively from the emerging markets, Debt reduction making slow but sure progress which now account for just under 55% of the As with savings habits, the differences middle class (2000: a good 16%). in borrowing behavior are similarly pro- nounced. The lion’s share of personal debt 428 million people in the world can be has been accumulated in the HWCs: they ac- deemed to belong to the wealth upper class; count for just under 80% of global debt. This unlike the middle class, this figure has is also, however, where debt growth is the dipped slightly since 2000. While the propor- lowest, especially since the financial crisis: tion of people who fall into the high-wealth over the past four years, the average growth category and do not live in the industrialized rate in the HWCs was only 0.6% a year, where- nations fell in both absolute (+15 million) as the MWCs and LWCs achieved rates of 3.9% and relative (+3.5 percentage points) terms, and 21.0% a year respectively. This means the number of “rich people” in the industrial- that the debt ratio has been reduced, at least ized nations has fallen by around 32 million. in the HWCs, compared with 2007. Follow- Financial crisis and debt excesses leave a ing a further increase in the rate in 2008 and distinct mark. 2009, it has finally fallen, also in the MWCs, by a total of around two percentage points Not least given the above, it proves revealing over the past two years. In the LWCs, on the to adopt an approach that allows country- other hand, the rate has continued to climb specific factors to be assessed and analyzed over the years, reaching 26.2% at the end of in a regional context. This is why, after pro- 2011. This still, however, leaves it a long way viding an overview of the development and off the global rate of 67.0%. distribution of financial assets in a global context, the second part of the Allianz Global Wealth Report addresses these issues at regional level.
  • 13.
    Development of global financialassets Personal assets in the shadow of the crisis
  • 14.
    Foreword . Summary. Development of global financial assets . How global financial assets are distributed . Regional differences . Literature . Appendix 14 Two years of strong growth, in which the asset ing and sustainable political solution to the euro losses inflicted by the financial crisis 2007/2008 crisis failed to emerge. This sort of situation can were compensated for, at least at global level, spur marked changes in savings behavior that were followed by a 2011 that came as a disap- is then reflected in corresponding investment pointment, especially for savers in the industri- portfolio shifts: a preference for liquidity and alized nations. the need for security tend to be higher up on The escalation of the euro crisis and the the list of priorities than returns and yields in stock market crash in the summer of last year left uncertain times. Given the emerging “pensions a real mark on the assets of private households. crisis” fueled by demographic change, this trend Especially in the south of Europe, households can only be viewed with mixed feelings. There is have been forced to digest sometimes substan- a risk that, in the long run, these savings efforts tial losses. In these countries, savers have been will prove insufficient to guarantee financial se- feeling the impact of the euro crisis in their wal- curity in old age. lets for some time now. But it is not only in the But for all of the shadows cast on as- crisis-ridden countries that the impact is being set development in the industrialized nations, clearly felt. In many countries, the historically 2011 shed light on the other side of the story: the low interest rates spelled negative real returns catch-up process in the emerging economies and made it increasingly difficult for savers to continued virtually unrelentingly. find investment opportunities that would at least guarantee the preservation of their assets in real terms. At the same time, volatility has remained high throughout all asset classes as a convinc- Global financial assets: Catch-up process loses momentum Net financial assets and liabilities, in EUR bn Net financial assets and liabilities per capita, in EUR 100,000 22,000 90,000 20,000 80,000 18,000 16,000 70,000 14,000 60,000 12,000 50,000 10,000 40,000 8,000 30,000 CAGR* 2001-2011: 6,000 CAGR* 2001-2011: 20,000 Net financial assets: +3.4% p.a. Net financial assets: +2.5% p.a. 4,000 Liabilities: +5.5% p.a. Liabilities: +4.6% p.a. 10,000 Gross financial assets: +4.0% p.a. 2,000 Gross financial assets: +3.1% p.a. 0 0 ’00 ’01 ’02 ’03 ’04 ’05 ’06 ’07 ’08 ’09 ’10 ’11 ’00 ’01 ’02 ’03 ’04 ’05 ’06 ’07 ’08 ’09 ’10 ’11 *CAGR = Compound Annual Growth Rate Liabilities Source: National Central Banks and Statistical Offices, UN, Allianz SE. Net financial assets
  • 15.
    Allianz Global WealthReport 2012 This also, however, implies a different The disappointing development is all 15 debt trend, as well. Whereas many of the world’s the more evident if we look at private financial industrialized nations focused more on delev- assets in per capita terms. In 2011, just under eraging, personal debt levels on the emerging EUR 21,500 could be attributed to each global markets continued on an upward trajectory. As citizen, a figure that was up by 0.8% on 2010. This a result, many of these countries have seen the means that the previous high reported in 2007 debt ratio (liabilities as percent of GDP) climb (EUR 21,180 per capita) was actually outstripped steeply in recent years, sometimes to a point by 1.5%. All in all, however, gross per capita fi- that is verging on critical. nancial assets have been increasing by only 3.1% a year since the beginning of the new millen- Global asset growth moves down a gear nium, i.e. at exactly the same pace as average Global gross financial assets grew by only 1.6% in global inflation. This means that, on average, 2011, down considerably on the average growth savers worldwide have not been able to achieve rates for the two previous years (7.3% per an- any real asset growth over the past eleven years. num). In absolute terms, the asset base reached Sobering news. a new high of EUR 103.3 trillion. All in all, global financial assets have Debt growth slowed in its tracks been growing at an average rate of 4.0% a year Gross financial assets tell only one side of the since 2000, somewhat ahead of the global infla- wealth story; the other side is about debt. Debt tion rate for the same period (3.1%) but slower also reached a new record high in 2011 at EUR than the growth in global economic output, 31.8 trillion, up by 2.2% on a year earlier and out- which has increased by around 5.1% a year in stripping growth in gross financial assets again nominal terms over the same period. So overall, for the first time in three years. Nevertheless, wealth development has been somewhat disap- the global debt trend also bears the hallmarks pointing over the past eleven years. Savers are of the crisis: whereas in the period from 2003 having to pick up the bill – in the form of lost to 2007, debt grew at a rate of 8.1% a year, post- return opportunities – for the ever faster succes- crisis growth (2008 to 2011) has only averaged sion of financial crises – from the stock market 2.4%. This has resulted in an improvement in the slump at the start of the decade when the dot- global debt ratio (liability of private households com bubble burst to the Lehman shock and the as percent of global GDP) to 67.0% of late, after current euro crisis. In a sustainable world, assets touching a high of 71.8% in 2006. In this sense, should be achieving returns that are roughly in the deleveraging of private households is cer- line with nominal growth; then there would be tainly progressing, with the relative debt burden annual wealth formation, i.e. savings, of around slowly but surely becoming lighter. 2% of the global economic output. Based on these rather conservative assumptions, today’s global financial assets would be around EUR 26 trillion or a good quarter higher.
  • 16.
    Foreword . Summary. Development of global financial assets . How global financial assets are distributed . Regional differences . Literature . Appendix 16 If we subtract debt from the gross fi- Analyses based on wealth classes nancial assets, we are left with the net financial In order to paint a more sophisticated picture of assets. Net financial assets had climbed to EUR global wealth distribution by country, the Alli- 71.5 trillion by the end of 2011 (+1.4%). Given the anz Global Wealth Report has split the countries debt momentum in the past, it comes as little evaluated into three wealth classes, similar to surprise that the growth in net financial assets the income classes used by the World Bank: high has lagged behind the growth in gross financial wealth countries (HWC) with average net per assets (4.0%) at an average rate of 3.4% a year over capita financial assets of more than EUR 26,800; the entire period starting in 2000. In per capita middle wealth countries (MWC), net per capita terms, the annual growth rate drops back to financial assets of between EUR 4,500 and EUR 2.5%, far lower than the rate of inflation. At EUR 26,800; and low wealth countries (LWC), net per 14,880 per capita, net financial assets at the end capita financial assets of less than EUR 4,500 of 2011 were also still slightly down on the his- (for information on how the wealth classes are torical high reached in 2007. So despite the fact determined, see Appendix A). that debt growth has at least been contained in recent years, the efforts made in this respect still appear to be far from sufficient, given the weak development in gross financial assets, to achieve any sustainable asset growth. Power shift Share of global net financial assets by country groups, in % 100 90 80 70 60 LWC MWC 50 HWC ’00 ’01 ’02 ’03 ’04 ’05 ’06 ’07 ’08 ’09 ’10 ’11 Source: National Central Banks and Statistical Offices, UNU WIDER, World Bank, Allianz SE.
  • 17.
    Allianz Global WealthReport 2012 Huge global prosperity gap Different catch-up processes 17 The result is anything but surprising. Wealth is Despite these vast differences, however, the last distributed very unevenly throughout the world. eleven years have not been a lost decade for the It is still the case that around 85% of global net world’s poorer countries. Net per capita financial financial assets are in the hands of private assets in the LWCs has been growing by almost households in the HWCs – although these coun- 16% a year since 2000, a good eight times faster tries only account for 18% of the total population than in the HWCs. These sizeable differences in and around 60% of global economic output. The growth are closely linked to the varying impact trend is, nevertheless, moving in the “right” di- of the financial crises. The assets of poorer coun- rection: the HWCs’ share of the global wealth tries managed to escape these crashes virtually cake has shrunk by a good 8 percentage points unscathed. This becomes particularly clear if since 2000, meaning that poorer countries are we compare the development in financial assets gaining ground. in the HWCs since the financial crisis directly The global prosperity gap is huge from with the development in the LWCs: while net per a per capita perspective, too. At EUR 70,590, net capita financial assets in the poorer countries per capita financial assets in the HWCs at the have risen by almost 38% since the end of 2007, end of 2011 were several times greater than in average per capita financial assets in the HWCs the LWCs, where they averaged only EUR 2,040. were still 3.2% lower than the pre-crisis level at People in MWCs had average financial assets the end of 2011. worth EUR 10,240. Big prosperity gap Net financial assets per capita, in EUR High Wealth Countries Middle Wealth Countries Low Wealth Countries 80,000 11,000 2,200 10,000 2,000 70,000 9,000 1,800 60,000 8,000 1,600 50,000 7,000 1,400 6,000 1,200 40,000 5,000 1,000 30,000 4,000 800 20,000 3,000 600 2,000 400 10,000 1,000 200 0 0 0 ’00 ’07 ’08 ’09 ’10 ’11 ’00 ’07 ’08 ’09 ’10 ’11 ’00 ’07 ’08 ’09 ’10 ’11 Source: National Central Banks and Statistical Offices, UNU WIDER, World Bank, Allianz SE.
  • 18.
    Foreword . Summary. Development of global financial assets . How global financial assets are distributed . Regional differences . Literature . Appendix 18 This uneven development means that The catch-up process in the MWCs, on the “inequality factor” between the world’s rich- the other hand, is much slower. Growth in net per er and poorer countries, which was still hovering capita financial assets in this group of countries at 141 in 2000, has now been pushed down to 35, has been “only” twice as high as in their richer a development that is, without a doubt, impres- counterparts since 2000. This is due less to asset sive and highlights some degree of convergence growth itself – after all, gross per capita financial of financial assets, at least in relative terms. Af- assets have also grown at twice the rate – than ter all, if we look at the flip side of the coin, the to the higher rate of debt growth, which was 2.5 absolute gap in net per capita financial assets times faster than in the HWCs. A glance at the has widened from EUR 57,000 to EUR 68,550 – countries to which the relevant wealth groups in spite of the signs of narrowing that emerged belong sheds light on these differences. during some phases of the financial crisis. Even Most HWCs are located in North America if the difference in growth momentum seen over and western Europe. As far as the other regions the past ten years were to persist in the future – of the world are concerned, only Australia, Israel, uninterrupted catch-up trend on the one hand Japan, Singapore and Taiwan have made it into and financial crises at periodic intervals on the other – it would be the mid-2020s before the ab- solute differences would start to become less pronounced. Development of net financial assets per capita Index (2000=100) 500 2011, in EUR 70,590 450 400 350 10,243 2,036 300 250 200 150 LWC 100 MWC 50 HWC ’00 ’01 ’02 ’03 ’04 ’05 ’06 ’07 ’08 ’09 ’10 Source: National Central Banks and Statistical Offices, UNU WIDER, World Bank, Allianz SE.
  • 19.
    Allianz Global WealthReport 2012 the club of rich countries. The MWCs include not rael, Japan, Taiwan and Singapore, however, net 19 only Chile and Mexico from Latin America, and financial assets in Asia’s emerging markets only Malaysia and South Korea from Asia, but also, in come in at EUR 2,320. On the other hand, eastern particular, eastern European countries and eu- Europe achieves a value of EUR 5,070, provided rozone crisis countries such as Greece, Ireland, that we include only the EU member states. The Portugal and Spain. Some of these countries are average per capita assets of EUR 3,560 in Latin characterized by high debt levels and high debt America reflect the progress that this region has growth; so the subdued increase in net financial made in recent years (2000: EUR 1,130). assets over the past decade comes as no surprise. The relative wealth situation, i.e. the The LWCs also witnessed rapid debt growth as a analysis of net financial assets in relation to group during this period, but they started at a economic output, is slightly different. Although far lower level. North America leads the field in this compari- On the whole, however, the global son, too, Asia is now ahead of western Europe wealth map paints a predictable picture; on the and Oceania. Without Israel, Japan, Taiwan and one hand, we have the rich countries of North Singapore, however, Asia would drop back to America, western Europe and Oceania, with av- well behind western Europe again, although it erage regional per capita wealth of between EUR would still be in front of Oceania. The develop- 31,960 (Oceania) and EUR 87,400 (North Ameri- ment witnessed since 2000 is similarly striking: ca) in net terms, and on the other, there are the there is only one region that has managed to poorer countries of Asia, Latin America and improve this indicator over the last eleven years: eastern Europe, where the same figure comes in at only between EUR 2,430 (eastern Europe) and EUR 6,620 (Asia). Without the four HWCs of Is- Global imbalances Net financial assets 2011, in EUR Eastern Europe Western Europe North America 100,000 87,401 2,434 41,241 ’07 ’08 ’09 ’10 ’11 50,000 Asia 0 ’07 ’08 ’09 ’10 ’11 ’07 ’08 ’09 ’10 ’11 6,615 ’07 ’08 ’09 ’10 ’11 Latin America Oceania 3,561 31,956 ’07 ’08 ’09 ’10 ’11 ’07 ’08 ’09 ’10 ’11 Source: National Central Banks and Statistical Offices, UN, Allianz SE.
  • 20.
    Foreword . Summary. Development of global financial assets . How global financial assets are distributed . Regional differences . Literature . Appendix 20 Latin America. All other regions, on the other under 10% (average annual growth in the period hand, have suffered partially drastic setbacks, from 2007 to 2011). The decline in Latin America most notably so in Oceania. All in all, this de- is even more pronounced: since 2007, the aver- velopment is an impressive affirmation of how age growth in net per capita financial assets has growth and prosperity gains have been based been 6.5 percentage points slower than before. primarily on debt in the past. This appears surprising at first glance, because one would have certainly imagined the impact Households in eastern Europe remain the “growth of the euro crisis on neighboring eastern Europe champions“ to have been more pronounced than on far-off Nonetheless, assets have, of course, grown over Latin America. Once again, it pays to look at the the past few years, in some cases markedly debt trend: in Latin America, the crisis has not so. Eastern European households (region as a put a damper on personal debt. On the contrary, whole) have witnessed the strongest growth in personal debt growth has continued to pick up net per capita financial assets since 2000, with speed over the past few years. This is not the case an average annual growth rate of almost 12%. in eastern Europe; debt momentum has tailed off Eastern Europe also fared well on average in the considerably, especially in the eastern European face of the financial crisis and by the end of 2011, EU countries: whereas in the years prior to the per capita assets were already up by around crisis, annual growth rates around the 30% mark 44% on the pre-crisis level. Nevertheless, the fi- were the norm, the growth rate has amounted to nancial crisis has left a visible scar. The annual a “mere” 5% of late. growth rate has fallen during this period from almost 13% before the crisis (average annual growth in the period from 2000 to 2007) to just Net financial assets trailing behind economic output Net financial assets, as % of GDP North America Asia Western Europe Asia ex HWC Oceania Latin America 2000 Eastern Europe 2011 0 50 100 150 200 250 Source: National Central Banks and Statistical Offices, Allianz SE.
  • 21.
    Allianz Global WealthReport 2012 Asia’s emerging markets (Asia excl. the financial crisis was also much heftier: at the 21 HWCs) have not escaped entirely unscathed ei- end of 2011, all three regions were still lurking ther. At 7.9%, the average annual growth rates below the high achieved in 2007. And yet, despite in the period since 2007 are still well down on having things in common, all three regions tell the pre-crisis level. If we look at developments an entirely different story. In Oceania, where the in the entire Asian region, this value is actually decline is the most substantial at around 15%, decisively lower, at 1.8% per annum on average. the trend has been caused primarily by high The low value for Asia as a whole over the past debt growth that exceeds the global average. In four years is solely attributable to the standstill North America, net per capita financial assets in Japan, by far the richest country in the region, at the end of 2011 were still down by 6.4% on the where net per capita financial assets are actu- 2007 level. The main culprit here lies in gross fi- ally down by 0.6% on 2007. nancial assets: the slump of 2008 hit this region All in all, the regional analysis also like no other (-17.2%); the recovery witnessed in shows that it is precisely the poorer countries the years that followed was unable to make up that have been witnessing a vast increase in for this shock, which is why North America is the wealth over the past decade. The situation in only region in which total gross financial assets the rich regions tells the very opposite story. Not are still lower than the high witnessed in 2007. only has the growth in per capita financial assets been far slower over the past eleven years, par- ticularly in North America and western Europe, where growth comes in at 2.1% and 1.3% respec- tively, the setback inflicted on these regions by Comparison of growth: Champion Eastern Europe Average annual growth of net financial assets per capita, in % Western Europe North America Oceania Asia Latin America since 2000 Eastern Europe since 2007 -4 0 4 8 12 Source: National Central Banks and Statistical Offices, UN, Allianz SE.
  • 22.
    Foreword . Summary. Development of global financial assets . How global financial assets are distributed . Regional differences . Literature . Appendix 22 The fact that North America is, at the same time, crisis once again brought western European the only region in which personal debt has been households to their knees: this region was the cut, year after year, since the crisis is not enough only region in the world that had to witness a to pull net financial assets back up to above the drop in its gross financial assets. Consequently, 2007 level. In western Europe, the situation is a at the end of 2011, net per capita financial assets combination of both factors. Debt continued to had only managed to exceed the 2007 record grow, albeit at a far slower pace than before the high in nine out of western Europe’s 16 countries; crisis, and gross financial assets also showed looking at the region as a whole, too, net per cap- weak development. Although the direct asset ita financial assets slipped back into negative shock of 2008 was less seismic than in North territory last year, down by 1.1% on 2007. America and Oceania, the recovery that followed was also far slower. Last year, the ongoing euro Conservative wealth structure in poorer countries The reasons why the impact on financial assets has been so varied lie, for one, in the nature of the crisis itself – the financial crisis is a crisis that affects developed markets, initially the US, and now Europe. For another, differences in sav- ings habits before the crisis also explain the radical differences in asset structures and debt dynamics. Conservative asset structure in poorer countries Asset classes as % of gross financial assets by country groups, 2011 100 14 22 30 32 75 19 34 50 35 37 63 25 Other 41 33 Insurance 28 Securities 0 Bank deposits World HWC MWC LWC Source: National Central Banks and Statistical Offices, UNU WIDER, World Bank, Allianz SE.
  • 23.
    Allianz Global WealthReport 2012 It is relatively easy to see the link be- There are significant differences be- 23 tween asset structures and susceptibility to cri- tween the country groups on the whole as far as sis. The higher the proportion of volatile capital asset structures are concerned. In the HWCs, fi- market instruments in a portfolio, the greater nancial assets are distributed more or less even- the negative impact of losses in the value of these ly among the three major asset classes: bank securities on overall performance. This is why deposits, insurance policies/pensions and secu- private households in the US and Greece, for ex- rities, although the latter dominate with a share ample, were hit so hard in 2008: before the crisis of 37%. In the LWCs, by far the majority of assets (late 2007), securities accounted for almost 60% (63%) are held in bank deposits – as was already and more than 40% of financial assets in these the case before the outbreak of the financial two countries respectively. crisis – and in MWCs, too, bank deposits still ac- count for more than 40% of all financial assets. There is no doubt that this extremely risk-averse asset structure has helped the world’s poorer countries – even though it was not, of course, a conscious investment decision or a direct con- sequence of the financial crisis, but rather the result of the prevailing circumstances, i.e. the maturity of the individual financial systems, in the majority of cases. Increasing risk aversion Asset classes as % of global gross financial assets 100 29 29 29 30 30 30 75 50 35 36 35 41 41 36 25 Other 33 32 33 Insurance 28 27 31 Securities 0 Bank deposits 2000 2007 2008 2009 2010 2011 Source: National Central Banks and Statistical Offices, Allianz SE.
  • 24.
    Foreword . Summary. Development of global financial assets . How global financial assets are distributed . Regional differences . Literature . Appendix 24 Increase in risk aversion across the globe Securities are the biggest victims of The financial and debt crisis has meant that the this trend: they are losing ground in almost all increased investor focus on security as opposed global regions, even in the poorer ones. It is only to on returns is by no means a characteristic that in Latin America that investors have remained describes only the world’s poorer countries. This faithful to this asset class, largely due to the im- trend is now being observed across the globe. proved performance on stock exchanges in the While securities have become much less popu- region. lar among investors, bank deposits have upped By contrast, insurance policies and pen- their share of global financial assets by almost sions have gained asset share, reaping the ben- 5 percentage points since the start of the new efits from the trend towards more secure invest- millennium. This reflects the increasing mood ment products. There is no region in which this is of risk aversion among investors globally. This more pronounced than in (western and eastern) does not, however, apply equally to all regions Europe, where this asset class has been given an and countries. In actual fact, the global figures additional boost by the sometimes far-reaching hide some very striking regional differences. pension reforms implemented in recent years. It Bank deposits, for example, have start- would appear that a large number of savers are ed to account for an increasing proportion of as- now aware of the possible impact of demograph- set portfolios in richer regions such as Oceania, ic change on prosperity in old age. The story in western Europe and North America, in particu- Latin America is a similar one, whereas in Asia lar. Here, where many households already have developments are being overshadowed mainly substantial assets, the fear of loss is acute; at the by the widespread stagnation in Japan. same time, these regions are (or were) in the fir- The fact that insurance and pension ing line during the recent crises. This has fueled products are only gaining relatively minimal considerable uncertainty surrounding what is market share in a global comparison is due pri- in store for the capital markets, luring investors marily to the climate on the world’s two biggest into assuming a wait-and-see stance and stick- markets for these products, Japan and the US. ing by a preference for liquidity. Although insurance and pension products have formed a key component of retirement provision for some time now, they have been unable to fur- ther expand their position in recent years. What is more, these products are not necessarily seen as a safe haven for turbulent times, because many, such as variable annuities, are explicitly tied to the capital market.
  • 25.
    Allianz Global WealthReport 2012 Looking at the sovereign debt crisis and ly) low-risk investments, such as bank deposits, 25 the dramatic changes in the age structure of witnessed in many countries is counterproduc- many European countries, however, it remains tive. The fact that savers are shying away from to be seen whether the reforms and the reac- investments that offer the sort of returns they tions in terms of savings habits will prove suf- need means that they have to save even harder ficient. Our calculations definitely suggest that in order to create a sufficiently comfortable fi- the “pension gap” is still very much present. If no nancial cushion. A responsible approach to pro- further changes are made to the overall (tax) en- vision ultimately involves a certain degree of vironment, there is a real danger that many pri- risk-taking. vate households will fail to accumulate the level Winning back savers’ trust in the fi- of savings that they need for the future. As far as nancial markets and long-term investment is the need for long-term wealth accumulation is crucial. After all, the longer it takes to restruc- concerned, the tendency to “flee” to (supposed- ture the financial markets and find a sustain- able solution to the euro crisis, in particular, the greater the risk of “losing” a whole generation of savers because the idea of long-term investment is eyed with deep mistrust. Asset classes benefit differently Change of asset classes’ share of gross financial assets between 2000 and 2011, in percentage points Bank deposits Securities Insurance 7 5 8 6 6 0 5 4 4 -5 2 2 -10 1 0 0 -15 -2 Latin America Asia Eastern Europe North America Western Europe Oceania World Oceania Western Europe Eastern Europe North America Asia Latin America World North America Asia Latin America Western Europe Eastern Europe Oceania World Source: National Central Banks and Statistical Offices, Allianz SE.
  • 26.
    Foreword . Summary. Development of global financial assets . How global financial assets are distributed . Regional differences . Literature . Appendix 26 Start of deleveraging in the rich countries around 73% if we compare the four years prior to The differences in borrowing behavior are simi- the financial crisis with the four years that fol- larly pronounced to those affecting asset struc- lowed. The ratio of liabilities to economic output tures. Not surprisingly, the lion’s share of per- had fallen to 67.3% at the end of last year, putting sonal debt has been accumulated in the HWCs: it 2.1 percentage points short of the record value they account for just under 80% of global debt. seen in 2009. In the LWCs, on the other hand, the An analysis of debt development, however, is debt ratio has continued to climb over the years, more interesting. Since 2000, personal debt in reaching 26.2% at the end of 2011. This still, how- the HWCs has been growing at an average rate ever, puts it well below the global figure: global of 4.3% a year, whereas in the MWCs and LWCs, private household debt came in at 67.0% of eco- the rate of growth comes in at 10.0% and 18.3% nomic output at the end of 2011. respectively. The differences over the past four Nowhere were the debt levels of private years are even more striking, however: the aver- households higher than in Australia and New age growth rate in the HWCs was only 0.6% a year, Zealand, where this sort of debt corresponded to whereas the MWCs and LWCs achieved rates of around 109% of GDP. Oceania is the only richer 3.9% and 21.0% respectively. Since nominal eco- region in the world where debt has been growing nomic output in HWCs grew twice as fast as the at double-digit rates on average since the turn of liabilities in the same period (+1.2% per year on the millennium. By far the biggest debt culprits, average), 2.1 percentage points could be sliced however, are eastern European households, with off the debt ratio. But private households in the MWCs also made progress as far as deleverag- ing is concerned: the pace of debt growth fell by Dynamic of indebtedness stopped in the HWC and MWC Development of global debt burden, Development of global debt burden, in EUR bn as % of GDP 35,000 100 90 30,000 80 25,000 70 60 20,000 World 50 LWC 15,000 40 MWC HWC 10,000 30 20 5,000 10 0 0 ’00 ’01 ’02 ’03 ’04 ’05 ’06 ’07 ’08 ’09 ’10 ’11 ’00 ’01 ’02 ’03 ’04 ’05 ’06 ’07 ’08 ’09 ’10 ’11 Source: National Central Banks and Statistical Offices, UNU WIDER, World Bank, Allianz SE.
  • 27.
    Allianz Global WealthReport 2012 average debt growth to the tune of almost 27% a Eastern Europe is by no means an iso- 27 year. This breathtaking growth is due to two fac- lated case when it comes to the slowdown in debt tors: first, the debt level is still relatively low, while accumulation in the aftermath of the financial second, the opening of the banking markets as a crisis. This phenomenon is being observed in result of accession to the EU and the low-interest almost all regions across the globe. In the US, loans in foreign currencies (Swiss francs or eu- which is still the world’s largest “debt market“, ros) has made it far easier for private households households have actually reduced their debt on to access loans. The financial crisis, however, the whole over the past four years – also thanks has changed this situation profoundly; after to payment defaults and write-downs on prop- virtual stagnation in 2009, debt grew by “only” erty loans: their debt levels are now sitting at around 13% in total last year – with increasing 5.4% below the pre-crisis level. In addition to the differences emerging between individual coun- US, there are six other countries in which loans tries in the region: at present, only Russia, Tur- have been reduced in absolute terms during key and, to a lesser extent, Poland are witnessing this period: Japan, Ireland, Spain, Estonia, Latvia rapid growth in personal debt, whereas in other and Kazakhstan. This means that, thanks to the countries such as the Baltic states, Bulgaria or turnaround in debt momentum, the debt ratio Hungary, debt is already headed south. was reduced in all regions last year – with one sole exception: at the end of 2011, Latin America had reached a record high in relative debt; every- where else, deleveraging would appear to be the order of the day. Development of liabilities by region Liabilities, indexed (2000=100) Liabilities as % of GDP 1,300 Per capita in EUR, 2011 120 110 40.000 1,100 100 20.000 90 900 0 80 70 Eastern Europe 700 60 Latin America 50 Oceania 500 40 North America 30 Western Europe 300 20 Asia 10 Asia ex HWC 100 0 World ’ 00 ’01 ’02 ’03 ’04 ’05 ’06 ’07 ’08 ’09 ’10 ’11 ’00 ’01 ’02 ’03 ’04 ’05 ’06 ’07 ’08 ’09 ’10 ’11 Source: National Central Banks and Statistical Offices, UN, Allianz SE.
  • 29.
    How global financial assetsare distributed How big is the world’s middle class in terms of wealth?
  • 30.
    Foreword . Summary. Development of global financial assets . How global financial assets are distributed . Regional differences . Literature . Appendix 30 Social classes are normally identified in terms Consequently, our definition of the of income, meaning that the middle class is de- global wealth middle class is based not on the fined by how much it earns. By contrast, there standard income classes, but on global average is no system that divides society into “wealth per capita wealth. This year, however, we will classes”. also be focusing on the net figures when we But there is certainly a link between dis- put the various wealth classes under the micro- posable income and wealth. Households have to scope. Average net per capita assets came in at exceed a certain income level before accumulat- EUR 14,880 in 2011. We have defined the middle ing wealth is even an option. wealth countries (MWCs) as those countries that As a general rule, people in lower in- own between 30% and 180% of average global per come groups and some of the (income) middle capita wealth. In terms of the average income class have either no, or only very few assets. This threshold for the MWCs, the lower threshold means that the terms “income middle class” for net per capita assets in 2011 stands at EUR and “wealth middle class” do not refer to the 4,500. The HWCs include countries with average same group of people; rather, the distribution per capita assets of EUR 26,800 or more. In gross of income and wealth vary considerably: while terms, the thresholds are EUR 6,400 and EUR around one third of the population earns half 38,700 (see Appendix A for information on how of the population’s total income, only 10% of the the wealth thresholds are determined). population owns half of its assets on average. Strong correlation between economic output and wealth Net financial assets of households and GDP per capita 2011, in EUR 100,000 USA Japan 80,000 Belgium Net financial assets per capita Netherlands 60,000 Singapore Canada Denmark France Italy Sweden 40,000 Germany Austria Mexico Ireland Malaysia 20,000 Portugal Finland Romania South Korea Spain Thailand Chile Greece Indonesia Czech Republic New Zealand Peru Hungary 0 Kazakhstan Brazil 0 5,000 10,000 15,000 20,000 25,000 30,000 35,000 40,000 45,000 GDP per capita Source: National Central Banks and Statistical Offices, UN, Allianz SE.
  • 31.
    Allianz Global WealthReport 2012 The new wealth middle class In gross terms, 20 out of the 52 countries 31 Government debt levels in many industrialized in our analysis fall into the HWC category. The nations are the hot topic on everyone’s minds at category consists almost exclusively of estab- the moment, but what sort of shape are private lished industrialized nations (plus Singapore households in? We want to delve further into and Taiwan). But it is precisely in those industri- this issue in our analysis of the global wealth alized nations with highly developed financial middle class. If we include liabilities in our systems that household debt is also at its high- analysis, which countries still make it into the est. Average per capita debt in these countries high or middle wealth group? Have countries amounts to EUR 27,670, compared with only been forced out of the group of HWCs or MWCs EUR 970 on the emerging markets. While it goes in recent years due to their liabilities and how without saying that this debt is often offset by has the distribution of wealth in these countries real assets, capital and interest payments still changed since 2000? have to be made using current income. The cri- sis in particular – which sent house prices tum- bling in some places – has left no doubt as to one fact: debt is still debt, i.e. liabilities that have to be paid back no matter what. Uneven distribution Share of global net financial assets (52 countries, 4.8bn people), by population deciles in % Decile with lowest wealth Decile with highest wealth 55 17 10 7 5 2 3 0 0 1 1. 2. 3. 4. 5. 6. 7. 8. 9. 10. Source: National Central Banks and Statistical Offices, UNU WIDER, World Bank, Allianz SE.
  • 32.
    Foreword . Summary. Development of global financial assets . How global financial assets are distributed . Regional differences . Literature . Appendix 32 In Finland, Norway and Ireland, house- asset growth (11.7% a year) unable to keep step hold debt levels mean that these countries are with these rates. The crisis then put incomes still only classed as MWCs in net terms. Finn- under pressure, making the process involved ish households have debt averaging EUR 23,940 in reducing these liabilities a slower one. Since per capita, with Irish per capita debt coming in 2009, however, liabilities have been falling and at EUR 40,790 and the Norwegians sitting on as financial assets gradually rising again, mean- much as EUR 66,080 of debt each. This explains ing that in 2011, Ireland was only a whisker away why, at EUR 6,510 net, Norway’s households also from making it back into the HWC group, with have the lowest per capita assets in Europe. average net assets to the tune of EUR 25,460 per Whereas Finland (EUR 19,100 per capita) and capita. In the other European countries marred Norway have been members of the MWCs for by the crisis, on the other hand, there is no in- some time now in net terms, Ireland was not dication of a turnaround yet: net per capita as- relegated to this group until 2007. Private house- sets in Greece, Portugal and Spain continued on hold debt in Ireland swelled by more than 22% a downward trajectory last year. Nevertheless, a year between 2000 and 2007, with financial these three countries were not HWC members in terms of net assets even before the crisis hit; while Portugal and Spain could be counted as HWCs in gross terms, they lost this status in 2010 and 2011 respectively. Classification of countries by net financial assets per capita HWC MWC LWC Australia Chile Argentina Austria Croatia Brazil Belgium Czech Republic Bulgaria Canada Estonia China Denmark Finland Colombia France Greece India Germany Hungary Indonesia Israel Ireland Kazakhstan Italy Malaysia Latvia Japan Mexico Lithuania Netherlands Norway New Zealand Singapore Portugal Peru Sweden Romania Poland Switzerland Slovenia Russia Taiwan South Korea Slovakia UK Spain South Africa USA Thailand Turkey Ukraine Source: National Central Banks and Statistical Offices, UNU WIDER, World Bank, Allianz SE.
  • 33.
    Allianz Global WealthReport 2012 Personal debt is not, however, a “privi- Obviously, a long development process 33 lege” of the European crisis states. Brazil had lies ahead before the average per capita assets just made it into the MWC club in gross terms, of a country’s entire population can surpass the but remains a LWC with net per capita assets middle or even high wealth threshold. This is of EUR 2,980. Other countries that lost their net why we have opted to look at wealth distribution MWC status are Lithuania, New Zealand, Poland within a country in terms of deciles. In order to and Slovakia, where the credit boom had taken do so, we have to make assumptions as to how on huge proportions in recent years. wealth is distributed within a country. In their studies, Davies et al. (2009) showed that, despite the differences, there is a stable link between income and wealth distribution. We have used this link to draw conclusions as to wealth distri- bution in the countries we have analyzed based on income distribution levels in these countries. This involved “converting” income deciles into wealth deciles to calculate the average wealth per population decile.
  • 34.
    Foreword . Summary. Development of global financial assets . How global financial assets are distributed . Regional differences . Literature . Appendix 34 Based on this breakdown, 723 million But the growth of the middle class is people with medium net assets currently live not a success story for everyone, because it does in the countries included in our analysis. This not spell a scenario in which there are only win- equates to a respectable 15% of the total popu- ners. Particularly in those countries that have lation. The momentum driving the rise of the set the stage for a massive increase in debt in global middle class is astounding: over the past recent years and whose financial assets have eleven years, the emerging markets, in particu- been hit hard by the crisis, there are now fewer lar, have been witnessing an economic boom people of “high wealth” than there were at the that has also had a very positive impact on the start of the millennium. These countries include wealth of the population at large. In 2000, only New Zealand, Belgium, Finland, Ireland, Nether- just under 8% (340 million) of the world’s popu- lands, Spain and the UK. But it is not only higher lation was classed as falling into the middle debt levels that have slashed the number of rich wealth category. Almost 50% of people in the people in the HWCs: in Japan, the US, Germany, middle wealth bracket come from countries that Greece and Switzerland the number of high- are considered to be low wealth countries on av- wealth individuals, based on gross assets, is also erage (355 million). In 2000, only 10% of middle lower than in 2000. wealth individuals were from the LWCs, with al- most 70% coming from the HWCs (2011: 37%). Over 1bn people around the globe own more than EUR 4,500 net Population (52 countries analyzed), in million 3,656 723 428 HWC MWC LWC <4,500 4,500 - 26,800 >26,800 Net financial assets per capita, in EUR Source: National Central Banks and Statistical Offices, UNU WIDER, World Bank, Allianz SE.
  • 35.
    Allianz Global WealthReport 2012 This means that around 50 million peo- 35 ple who we used to classify as “rich” are now members of the wealth middle class (net assets). Consequently, 13% of the growth in the mid- dle class is attributable to the reduction in the wealth upper class. In total, only 428 million people fall into the high-wealth category today, 18 million, or 4%, down on 2000. As in the past, the vast major- ity (383 million) come from HWCs (89%). As with the wealth middle class, however, this propor- tion is shrinking. As many as 11% or 45 million of the high-wealth individuals come from poorer countries. Eleven years ago, this group made up no more than 7% (31 million) of the high-wealth group. This means that economic success and population growth in these countries – which, particularly in the MWCs, are higher than in the HWCs – have not been sufficient to make up for the decline in the number of high net wealth in- dividuals. Growing wealth middle class mainly comes from LWC Population (52 countries analyzed) by wealth classes, in million 270 98 237 355 HWC 65 MWC 38 LWC 2000 2011 Source: National Central Banks and Statistical Offices, UNU WIDER, World Bank, Allianz SE.
  • 37.
    Regional differences Financial assetsin individual regions 38 Latin America 46 North America 54 Western Europe 66 Eastern Europe 74 Asia 84 Australia and New Zealand
  • 38.
    Foreword . Summary. Development of global financial assets . How global financial assets are distributed . Regional differences . Literature . Appendix 38
  • 39.
    Latin America Population Total · · · · · · · · · · · · · · · · · · · · · · · · · · · · · · · · · · · · · · · · · · · · · · · · · · · · · · · · · · · · · · · · · · · · · · · · · · · 446 m Proportion of the region as a whole · · · · · · · · · · · · · · · · · · · · · · · · · · · · · · · · · · · · · · · · · · · · · · 77% Proportion of the global population · · · · · · · · · · · · · · · · · · · · · · · · · · · · · · · · · · · · · · · · · · · · · · 6.5% GDP Total · · · · · · · · · · · · · · · · · · · · · · · · · · · · · · · · · · · · · · · · · · · · · · · · · · · · · · · · · · · · · · · · · · · · EUR 3,370bn Proportion of the region as a whole · · · · · · · · · · · · · · · · · · · · · · · · · · · · · · · · · · · · · · · · · · · · · · 86% Proportion of global GDP · · · · · · · · · · · · · · · · · · · · · · · · · · · · · · · · · · · · · · · · · · · · · · · · · · · · · · · · · 7.0% Gross financial assets of private households Total · · · · · · · · · · · · · · · · · · · · · · · · · · · · · · · · · · · · · · · · · · · · · · · · · · · · · · · · · · · · · · · · · · · · EUR 2,550bn Average · · · · · · · · · · · · · · · · · · · · · · · · · · · · · · · · · · · · · · · · · · · · · · · · · · · · · · · · · EUR 5,730 per capita Proportion of global financial assets · · · · · · · · · · · · · · · · · · · · · · · · · · · · · · · · · · · · · · · · · · · · · 2.5% Debt of private households Total · · · · · · · · · · · · · · · · · · · · · · · · · · · · · · · · · · · · · · · · · · · · · · · · · · · · · · · · · · · · · · · · · · · · · · EUR 970bn Average · · · · · · · · · · · · · · · · · · · · · · · · · · · · · · · · · · · · · · · · · · · · · · · · · · · · · · · · · EUR 2,170 per capita As % of GDP · · · · · · · · · · · · · · · · · · · · · · · · · · · · · · · · · · · · · · · · · · · · · · · · · · · · · · · · · · · · · · · · · · · · · 28.7%
  • 40.
    Foreword . Summary. Development of global financial assets . How global financial assets are distributed . Regional differences . Literature . Appendix Latin America 40 This region is making headway in the race to did nothing to change Argentina’s status as the catch up. Whereas not even 1% of the world’s country with the lowest net per capita assets gross financial assets could be found in Latin in the region. Argentina’s households are also America at the start of the millennium, the re- grappling with very high inflation: while official gion accounted for no less than 2.5% of these as- statistics put the rate of inflation at 9.8% in 2011, sets, or more than EUR 2.5 trillion, last year. Half independent observers suspect that the real fig- of these assets were concentrated in the region’s ure is well in excess of 20%. Despite the fact that largest economy, Brazil. The renewed flare-up in ten years have passed since the last sovereign the international economic crisis, which dealt a default, many citizens are still finding it difficult particularly hefty blow to household financial to shake off the painful memories of the severe assets in Europe and North America, left Latin devaluation of the peso and the freezing of bank American households unscathed again in 2011: deposits. The fact that inflation has reared its as in the previous year, gross financial assets ugly head again is only serving to exacerbate the climbed by 9.6%, growth that, in a global com- capital flight from Argentina, which was already parison, came second only to the non-EU east- chronic. Many of the country’s citizens have no ern European countries, which reported growth faith in their peso or their government anymore. to the tune of 13.6%. Argentina led the regional Anyone who has the choice opts to invest abroad pack with growth of around 24% – although this or stash his dollars or euros under his mattress. In circumstances like these, it is, of course, ex- tremely difficult to put a figure on the financial assets of private households. Indebtedness is increasing Net financial assets and liabilities, in EUR bn Net financial assets and liabilities 2011, in EUR bn 2,500 Brazil 2,000 Mexico 1,500 Chile 1,000 Colombia CAGR* 2001-2011: 500 Net financial assets: +12.3% p.a. Argentina Liabilities: +16.7% p.a. Gross financial assets: +13.7% p.a. Peru 0 ’00 ’07 ’08 ’09 ’10 ’11 0 200 400 600 800 1,000 1,200 *CAGR = Compound Annual Growth Rate Liabilities Source: National Central Banks and Statistical Offices, Allianz SE. Net financial assets
  • 41.
    Allianz Global WealthReport 2012 The region’s number two when it comes as almost 21% last year. Nevertheless, there is no 41 to gross financial asset growth – also if we look need for too much concern here. In Brazil, the at the decade as a whole – is Colombia, with av- rise in loans granted to private households can erage growth of 17.7% a year. Despite this sub- be explained by the fact that more people now stantial growth over a prolonged period, how- have access to the banking system. There has ever, Colombia is only just ahead of Argentina been no deterioration in the ratio of loan repay- and Peru and has a long catch-up process ahead ments to incomes. At 28.7% of GDP, household of it if it wants to join the ranks of its neighbors, debt in the region as a whole is only a fraction Brazil, Mexico and Chile. higher than the LWC average (26.2%). In Brazil, In net terms, only 2.2% of the world’s fi- however, this figure is already at 41%, roughly on nancial assets are at home in this region, with a par with South Africa (40%) or the average for Latin American liabilities having grown at an the eastern European EU countries (35.9%). average rate of almost 17% a year over the past eleven years, clearly outpacing the rest of the world (average of 5.5% a year). The biggest in- crease in liabilities over the past eleven years has been in Brazil, with a liability growth rate averaging 18.4% a year and coming in at as much Indebtedness Liabilities of households and GDP per capita 2011, in EUR 6,000 Slovakia Slovenia Estonia 5,000 Czech Republic 4,000 Croatia Chile Brazil Hungary Liabilities per capita Poland 3,000 2,000 Bulgaria Romania China Turkey 1,000 Colombia Russia Ukraine Mexico Peru Argentina 0 India 0 2,000 4,000 6,000 8,000 10,000 12,000 14,000 16,000 18,000 GDP per capita Source: National Central Banks and Statistical Offices, UN, Allianz SE.
  • 42.
    Foreword . Summary. Development of global financial assets . How global financial assets are distributed . Regional differences . Literature . Appendix Latin America 42 The entire region falls into the LWC cat- Chile and Mexico are already home to egory, not only in terms of liabilities, but also as a far from insignificant 13 million people in the far as net financial assets (EUR 3,560 per capita) high wealth bracket (per capita net financial as- are concerned. At country level, however, two sets in excess of EUR 26,800). In each of the six of the region’s countries make it into the MWC countries included in our analysis, at least 10% of bracket: Chile with EUR 9,460 (net) per capita, the population are in the middle wealth bracket, which means that the country is ranked 25th out with as many as 20% falling into this category in of 52 in a global comparison, and Mexico with Chile and Mexico. This makes around 58 million EUR 5,750 (net) per capita (no. 30 in the ranking Latin Americans members of the global wealth list). With net financial assets of EUR 2,980 per middle class, i.e. 8% of the global middle class capita, Brazil comes in below the middle wealth lives in Latin America. threshold of EUR 4,500 (net) per capita due to its relatively high debt levels, which is why it is clas- sified as a LWC. In an international comparison, Brazil comes in 39th place, with the other coun- tries of the region also ranked in the bottom third: Colombia (44), Peru (42) – a country that has been included in our analysis for the first time this year – and Argentina (48). Frontrunner Chile Net financial assets and liabilities per capita, Net financial assets and liabilities per capita 2011, in EUR in EUR 6,000 Chile 5,000 Mexico 4,000 Brazil 3,000 Colombia 2,000 CAGR* 2001-2011: Net financial assets: +11.0% p.a. Peru 1,000 Liabilities: +15.4% p.a. Gross financial assets: +12.4% p.a. Argentina 0 ’00 ’07 ’08 ’09 ’10 ’11 0 3,000 6,000 9,000 12,000 *CAGR = Compound Annual Growth Rate Liabilities Source: National Central Banks and Statistical Offices, UN, Allianz SE. Net financial assets
  • 43.
    Allianz Global WealthReport 2012 The main problem facing Latin America, One characteristic of the region is the 43 however, remains the uneven distribution of in- high proportion of financial assets invested in come and wealth. The richest 20% of the popula- insurance and retirement provision, namely tion earn more than 55% of the total income and 26.7% – well above the LWC average of 14.4% and hold more than 80% of the overall wealth. Moves just shy of the global average of almost 30%. The to combat poverty in these countries are, howev- differences between the individual countries, er, making at least slow progress. Although the however, are considerable. Some countries in the proportion of income that goes to the poorest region were very quick to supplement the state 20% of the population has remained more or less social security systems with private retirement stable over the past decade (3.8% of incomes as provision. The frontrunner and model in Latin against 3.4% ten years ago), the richest 20% now America in this respect is, of course, Chile, where “only” receive a share of 55%, compared to 58% at the Pinochet-led government took the decision the start of the new millennium. This shows that to privatize the pay-as-you-go pension system the middle class is growing slowly but surely. back in 1980 when it was facing bankruptcy. In Mexico is the only country in which income dis- the new contribution-based system, individuals tribution has become even more polarized. All pay contributions into a personal pension ac- in all, however, Latin America is still in very poor count that is managed and invested by private shape compared with the rest of the world’s up- institutions. This explains why almost 60% of the and-coming economies: the poorest 20% of the country’s total financial assets are invested in emerging market population receive 6.2% of the retirement provision today. The Chilean pension income, with the richest quintile taking 46.6%. insurance system has already been a source of inspiration for many countries across the globe. Latin America’s population catching up slowly Population by country groups, in % 3 7 13 92 84 HWC MWC LWC 2000 2011 Source: National Central Banks and Statistical Offices, UNU WIDER, World Bank, Allianz SE.
  • 44.
    Foreword . Summary. Development of global financial assets . How global financial assets are distributed . Regional differences . Literature . Appendix Latin America 44 Colombia also has an obligatory unemployment Peru also has a contribution-based sys- and pension insurance system financed by sav- tem with individual accounts, meaning that a ings contributions made by employers in favor respectable 33% of financial assets are invested of their employees. Consequently, almost 47% of in pension funds. The country’s capital market, Colombia’s financial assets are tied up in pen- however, is still in the early stages of develop- sions and insurance. In Brazil, the contribution- ment, meaning that Peruvians tend hardly to based pension system has been truly booming invest anything on the stock or bond market out- since the introduction of the VGBL (Vida Gerador side of pension funds. The vast majority of per- de Beneficio Livre) and PGBL (Plano Gerador de sonal assets (57%) are still invested with banks. Beneficio Livre) retirement provision products. Finally, in Argentina, in the wake of the Both models are tax-incentivized, contribution- nationalization of the private pension funds, the based products; PGBL is designed purely for re- private retirement provision market is now vir- tirement provision, similar to the 401(k) in the tually non-existent, meaning that the propor- US. VGBL and PGBL products offer individuals a tion of financial assets invested in this area has good way of saving for retirement, especially for fallen from 14.5% (2000) to 5% last year. people working in Brazil’s very large informal Mexicans traditionally invest the lion’s sector, who do not contribute to the pay-as-you- share of their assets (around 70%) in shares and go government pension system. securities. Share of old-age provision partly on HWC-level Asset classes as % of gross financial assets 5 14 11 33 27 59 47 7 70 81 43 57 17 26 Other Insurance 20 23 Securities 15 13 Bank deposits Argentina Peru Mexico Brazil Colombia Chile Source: National Central Banks and Statistical Offices, Allianz SE.
  • 45.
    Allianz Global WealthReport 2012 45
  • 46.
    Foreword . Summary. Development of global financial assets . How global financial assets are distributed . Regional differences . Literature . Appendix 46
  • 47.
    North America Population Total · · · · · · · · · · · · · · · · · · · · · · · · · · · · · · · · · · · · · · · · · · · · · · · · · · · · · · · · · · · · · · · · · · · · · · · · · · · 347 m Proportion of the global population · · · · · · · · · · · · · · · · · · · · · · · · · · · · · · · · · · · · · · · · · · · · · · 5.1% GDP Total · · · · · · · · · · · · · · · · · · · · · · · · · · · · · · · · · · · · · · · · · · · · · · · · · · · · · · · · · · · · · · · · · · · EUR 12,910bn Proportion of global GDP · · · · · · · · · · · · · · · · · · · · · · · · · · · · · · · · · · · · · · · · · · · · · · · · · · · · · · · · · 24% Gross financial assets of private households Total · · · · · · · · · · · · · · · · · · · · · · · · · · · · · · · · · · · · · · · · · · · · · · · · · · · · · · · · · · · · · · · · · · · EUR 41,970bn Average · · · · · · · · · · · · · · · · · · · · · · · · · · · · · · · · · · · · · · · · · · · · · · · · · · · · · · EUR 120,810 per capita Proportion of global financial assets · · · · · · · · · · · · · · · · · · · · · · · · · · · · · · · · · · · · · · · · · · · · · 41% Debt of private households Total · · · · · · · · · · · · · · · · · · · · · · · · · · · · · · · · · · · · · · · · · · · · · · · · · · · · · · · · · · · · · · · · · · · EUR 11,610bn Average · · · · · · · · · · · · · · · · · · · · · · · · · · · · · · · · · · · · · · · · · · · · · · · · · · · · · · · · EUR 33,410 per capita As % of GDP · · · · · · · · · · · · · · · · · · · · · · · · · · · · · · · · · · · · · · · · · · · · · · · · · · · · · · · · · · · · · · · · · · · · · 89.9%
  • 48.
    Foreword . Summary. Development of global financial assets . How global financial assets are distributed . Regional differences . Literature . Appendix North America 48 At the end of 2011, almost 41% of the world’s gross ance. Thanks to the recovery witnessed in the financial assets were concentrated on the conti- closing quarter of the year, the gross financial nent of North America. Taken together, Canadian assets of US households nevertheless grew ever and US households had assets worth nearly EUR so slightly by 1.7% over the year as a whole. By 42 trillion, with the US alone home to around contrast, Canadians were unable to make up for 92% of them. In the two years following the out- the losses they incurred in Q2 and Q3. By the end break of the financial crisis, which had burned a of 2011, their financial assets were down by 0.5% hole of more than EUR 7.4 trillion in the pockets on the prior-year figure. This produces growth of of North American households, gross financial 1.5% for the region as a whole. assets in the region started to recover again. The average growth rate of 7.5% seen in 2009 and 2010, however, still lagged well behind the sort of growth rates that were the order of the day prior to the crisis (average of 10.8% from 2003 to 2007). In the spring and summer of last year, asset growth came to a complete standstill, mainly on the back of disappointing stock market perform- North America: Upward trend comes to a halt Net financial assets and liabilities, Net financial assets and liabilities per capita, in EUR bn in EUR 45,000 140,000 40,000 120,000 35,000 100,000 30,000 25,000 80,000 20,000 60,000 15,000 CAGR* 2001-2011: 40,000 CAGR* 2001-2011: 10,000 Net financial assets: +3.1% p.a. Net financial assets: +2.1% p.a. Liabilities: +5.2% p.a. 20,000 Liabilities: +4.9% p.a. 5,000 Gross financial assets: +3.6% p.a. Gross financial assets: +2.7% p.a. 0 0 ’00 ’07 ’08 ’09 ’10 ’11 ’00 ’07 ’08 ’09 ’10 ’11 *CAGR = Compound Annual Growth Rate Liabilities Source: Board of Governors of the Federal Reserve System, OECD, Statistics Canada, UN, Allianz SE. Net financial assets
  • 49.
    Allianz Global WealthReport 2012 Liabilities in these two countries also EUR 90,420. All in all, regional net per capita fi- 49 moved in opposite directions last year. Whereas nancial assets were higher than in any other re- US households managed to reduce their debt gion of the world, at EUR 87,400. More than 70% of burden (-1.5%), Canada’s private households re- the North American population were members mained on the personal debt path, increasing of the wealth middle and upper class. In global their liabilities by 6%. Looking at the region as a terms, this means that every third high wealth whole, this produces a reduction in debt of 0.8%, individual lives in this region. At country level, meaning that net financial assets grew faster however, US citizens have “only” been sitting in than their gross counterparts at 2.4%. third place in the rankings for the highest net A significant difference emerged be- per capita financial assets since 2000, behind tween the two neighbors as far as per capita as- their Swiss and Japanese counterparts. Whereas sets are concerned. At EUR 123,590, the financial the Canadians were still in 5th place in 2000, assets of US citizens were almost 30% higher their growing debt burden, in particular, pushed than those of their northern neighbors (EUR them down to 7th place last year. 95,530) in gross terms. If we deduct the liabilities from these figures, the gap actually widens to more than 50% due to the higher per capita debt that the Canadians have. In net terms, the aver- age Canadian had assets worth EUR 59,910 at the end of 2011, whereas the average US citizen had Net financial assets and liabilities per capita, in EUR USA Canada 140,000 140,000 120,000 120,000 100,000 100,000 80,000 80,000 60,000 60,000 40,000 CAGR* 2001-2011: 40,000 CAGR* 2001-2011: Net financial assets: +2.1% p.a. Net financial assets: +1.7% p.a. 20,000 Liabilities: +4.7% p.a. 20,000 Liabilities: +6.5% p.a. Gross financial assets: +2.7% p.a. Gross financial assets: +3.2% p.a. 0 0 ’00 ’07 ’08 ’09 ’10 ’11 ’00 ’07 ’08 ’09 ’10 ’11 *CAGR = Compound Annual Growth Rate Liabilities Source: Board of Governors of the Federal Reserve System, OECD, Statistics Canada, UN, Allianz SE. Net financial assets
  • 50.
    Foreword . Summary. Development of global financial assets . How global financial assets are distributed . Regional differences . Literature . Appendix North America 50 Weak equity markets put a damper on asset growth still lost more than 14% in the three months be- The devastating earthquake that hit Japan in tween July and September. By the end of the quar- 2011, coupled with the political tension in North ter, Canada’s S&P/TSX was also trading almost Africa and the Middle East, meant that the spring 13% lower than it had been at the end of June. The of 2011 signaled the end of the upward trend on losses on the stock markets ultimately also had the stock markets that had been ongoing since a negative impact on household financial assets. the fall of 2010. One of the leading rating agencies In the period from April to September, the gross stripped the US of its top credit rating in early financial assets of US and Canadian households August in the wake of a lengthy debate on an in- dwindled by around EUR 2,390bn, which corre- crease in the national debt ceiling. With the debt sponds to per capita losses of almost EUR 6,900. crisis in Europe coming to a head, this fueled The region’s asset structure also had its part to even more uncertainty among market partici- play in this development: at 53%, the proportion pants, accelerating the downward trend on the of North American assets invested in securi- stock markets in the third quarter of the year. Al- ties is well in excess of the average for all HWCs though the slump was far less pronounced than worldwide (37%). With 55% securities in their as- in Europe, the epicenter of the crisis, the S&P 500 set portfolios, US households have even more of a risk appetite than their neighbors in Canada (36%), although a trend away from securities Weak stock markets take their toll Important equity indices, Development of gross financial assets indexed (04. Jan ’11=100) during the year, q/q in % 110 4 105 100 2 95 0 90 EURO STOXX 50 85 S&P 500 USA S&P/TSX -2 Canada 80 75 -4 70 65 -6 Q1 2011 Q2 2011 Q3 2011 Q4 2011 31.1. 28.2. 31.3. 29.4. 31.5. 30.6. 29.7. 31.8. 30.9. 31.10. 30.11. 30.12. Source: Board of Governors of the Federal Reserve System, Datastream, OECD, Statistics Canada, Allianz SE.
  • 51.
    Allianz Global WealthReport 2012 and towards more bank deposits and insurance Assets held in bank deposits proved to 51 products has been emerging in recent years. The be the winner among the various asset classes situation on the markets eased in the last three in 2011. In Canada, these assets had gained more months of the year, so that, by the time the year than 5% year-on-year by the end of 2011, with had come to a close, the S&P 500 had bounced gains of as much as more than 10% in the US. US back to almost the same level that it started households increased their assets held in time out at in 2011. The recovery made by the S&P/ and savings deposits, which account for the ma- TSX was not quite as positive, and it closed the jority of bank accounts, by around 6%. Demand stock market year down by a good 11% in total. In deposits, which only accounted for a good 5% of North America, private households also benefit- assets in 2010, soared by almost 90%, pushing ted from the market recovery. Gross financial as- their share of total assets up to almost 9%. This sets in the region increased by EUR 1.6 trillion in strong liquidity preference reflects the mood of the fourth quarter, meaning that they were able uncertainty among investors. What is more, the to make up for any losses incurred over the year low interest rates are prompting more and more as a whole. people to put their money in short-term, as op- posed to long-term, investments. In the long run, this change in investor behavior is likely to have a negative impact on economic development. Share of securities in North America above HWC average Asset classes as % of gross financial assets North America HWC 100 30 28 27 29 29 29 30 31 31 32 32 32 75 50 41 42 37 38 38 37 54 54 53 57 58 55 25 Other Insurance 29 28 27 28 26 25 15 15 16 Securities 11 12 16 0 Bank deposits ’00 ’07 ’08 ’09 ’10 ’11 ’00 ’07 ’08 ’09 ’10 ’11 Source: National Central Banks and Statistical Offices, Allianz SE.
  • 52.
    Foreword . Summary. Development of global financial assets . How global financial assets are distributed . Regional differences . Literature . Appendix North America 52 US citizens remain committed to debt reduction US households is bearing fruit. Since the end of In a regional comparison, North America not 2007, they have reduced their liabilities for what only claimed the largest share of global financial is now the fourth year running – also thanks to assets. Almost 37% of the world’s debt burden, considerable payment defaults and write-downs more than in any other region, was also sitting on property loans. All in all, this corresponds to on the other side of the Atlantic. This share has, a volume of almost EUR 590bn, or EUR 3,130 per however, already been falling considerably in re- capita. As encouraging as this development is, cent years. In 2007, it stood at no less than 41%. the speed at which debt was accumulated prior For one, households in the emerging markets to the crisis was much higher: in the four years have been accumulating increasing liabilities as leading up to 2007, liabilities increased to the their financial sectors continue to develop. For tune of a good EUR 3,400bn, almost six times another, the increasing debt discipline shown by the volume of debt reduction since 2007. In a global comparison, the country came in ninth in the list of the most indebted households, with debt of EUR 33,170 per capita. Places one to seven were all occupied by western Europeans. Cana- da came in eighth, with per capita debt of EUR 35,620. US-Americans successfully reining in debt Liabilities per capita in EUR (lhs) and as percent of disposable income (rhs) 40,000 160 35,000 150 30,000 140 25,000 130 Liabilities per capita, USA 20,000 120 Liabilities per capita, Canada 15,000 Liabilities as 110 percent of disposable 10,000 income, USA 5,000 100 Liabilities as percent of disposable income, Canada 0 90 ’00 ’01 ’02 ’03 ’04 ’05 ’06 ’07 ’08 ’09 ’10 ’11 Source: Board of Governors of the Federal Reserve System, Datastream, OECD, Statistics Canada, UN, Allianz SE.
  • 53.
    Allianz Global WealthReport 2012 US and Canadian households have been 53 going their separate ways as far as personal debt is concerned for years now. The latter, for exam- ple, upped their liabilities by a further 6% last year, the debt ratio climbed to over 94% and the ratio of debt to disposable income reached a new record high touching on 155%. This means that, for the first time, per capita debt in Canada was higher than in the US. The only indicator that slowed was the rate of debt accumulation. In the four years following the outbreak of the crisis, li- abilities grew by an average of almost 7% per an- num, whereas the rate seen between 2004 and 2007 had still been sitting at 9.2%. In an environ- ment of historically low interest rates, there is a risk that private households, and young families in particular, will end up biting off more debt than they can chew. Many of them have no ex- perience of higher interest rates, meaning that they have never had any chance to develop a feel for the sort of burden that rising interest rates could create. The Bank of Canada also sees the personal debt situation as cause for considerable concern. In its quarterly monetary policy report published in April 2012, it actually singled out the rising household debt levels as the biggest domestic risk facing the Canadian economy.
  • 54.
    Foreword . Summary. Development of global financial assets . How global financial assets are distributed . Regional differences . Literature . Appendix 54
  • 55.
    Western Europe Population Total · · · · · · · · · · · · · · · · · · · · · · · · · · · · · · · · · · · · · · · · · · · · · · · · · · · · · · · · · · · · · · · · · · · · · · · · · · · 410 m Proportion of the global population · · · · · · · · · · · · · · · · · · · · · · · · · · · · · · · · · · · · · · · · · · · · · · 6.0% GDP Total · · · · · · · · · · · · · · · · · · · · · · · · · · · · · · · · · · · · · · · · · · · · · · · · · · · · · · · · · · · · · · · · · · · EUR 12,480bn Proportion of global GDP · · · · · · · · · · · · · · · · · · · · · · · · · · · · · · · · · · · · · · · · · · · · · · · · · · · · · · · · · 25% Gross financial assets of private households Total · · · · · · · · · · · · · · · · · · · · · · · · · · · · · · · · · · · · · · · · · · · · · · · · · · · · · · · · · · · · · · · · · · · EUR 26,930bn Average · · · · · · · · · · · · · · · · · · · · · · · · · · · · · · · · · · · · · · · · · · · · · · · · · · · · · · · · EUR 65,620 per capita Proportion of global financial assets · · · · · · · · · · · · · · · · · · · · · · · · · · · · · · · · · · · · · · · · · · · · · 26% Debt of private households Total · · · · · · · · · · · · · · · · · · · · · · · · · · · · · · · · · · · · · · · · · · · · · · · · · · · · · · · · · · · · · · · · · · · EUR 10,010bn Average · · · · · · · · · · · · · · · · · · · · · · · · · · · · · · · · · · · · · · · · · · · · · · · · · · · · · · · · EUR 24,380 per capita As % of GDP · · · · · · · · · · · · · · · · · · · · · · · · · · · · · · · · · · · · · · · · · · · · · · · · · · · · · · · · · · · · · · · · · · · · · 80.2%
  • 56.
    Foreword . Summary. Development of global financial assets . How global financial assets are distributed . Regional differences . Literature . Appendix Western Europe 56 After two years of robust growth, the accumula- Asset development marred tion of private financial assets once again lost by the sovereign debt crisis momentum in 2011. Overshadowed by the on- When the debt crisis in the peripheral EMU states going debt crisis in some European Monetary came to a head again in the summer of last year, Union (EMU) countries, the financial assets of dark clouds started to gather over the financial western European households came under par- markets again. The uncertainty was stoked by ticular pressure in the second half of last year. an onslaught of bad news from the eurozone and Weak stock market performance was the main the US. And it was not only for Greece, Portugal reason behind the slight drop on the assets side and Ireland that the refinancing costs started to of the wealth balance sheet. Gross financial as- climb; investors also started to demand higher sets contracted by a total of 0.2% in the course risk premiums for Italian and Spanish bonds. of 2011 to around EUR 26.9 trillion. The liabili- In the US, the decision to raise the debt ceiling ties side increased by 1.5%, meaning that in net just managed to prevent the suspension of cen- terms, the drop in the asset base to EUR 16.9 tril- tral government payments. This did not stop one lion was almost one percentage point more pro- rating agency from stripping US government nounced than in a scenario in which liabilities bonds of their top AAA rating for the first time are left out of the equation. All in all, however, in 70 years. western Europe was still home to more than 26% of global gross financial assets and almost 24% of net financial assets. Accumulation of wealth stagnates Net financial assets and liabilities, Net financial assets and liabilities per capita, in EUR bn in EUR 30,000 70,000 60,000 25,000 50,000 20,000 40,000 15,000 30,000 10,000 CAGR* 2001-2011: 20,000 CAGR* 2001-2011: Net financial assets: +1.8% p.a. Net financial assets: +1.3% p.a. 5,000 Liabilities: +5.8% p.a. Liabilities: +5.2% p.a. 10,000 Gross financial assets: +3.1% p.a. Gross financial assets: +2.6% p.a. 0 0 ’00 ’07 ’08 ’09 ’10 ’11 ’00 ’07 ’08 ’09 ’10 ’11 *CAGR = Compound Annual Growth Rate Liabilities Source: National Central Banks and Statistical Offices, UN, Allianz SE. Net financial assets
  • 57.
    Allianz Global WealthReport 2012 Weak economic data also fueled fears of a re- 57 turn to recession. This triggered drastic share price slumps on the market, with the Eurostoxx 50 losing around 24% during the third quarter of 2011 alone. The situation eased slightly in the last three months of the year, with confidence bolstered by the new governments in Italy, Spain and Greece. This was supported by the austerity package resolved by the government led by Mario Monti, as well as by proposals for more stringent budgetary regulations put forward by Germany and France. The Eurostoxx 50 had, however, only made a slight recovery by the end of the year, meaning that it had still lost a good 19% in the second half of the year as a whole. The turbulent second half of the year on the stock markets had a knock-on effect on the development of private financial assets. Assets held in securities fell by 7% as against 2010 to around EUR 7 trillion. In a year-on-year compar- ison, the chunk of the asset portfolio of private households held in securities fell by almost two percentage points to 26.1%. Despite the positive gains for bank deposits (+3.2%) and insurance and pensions (+1.9%), gross regional financial assets dipped slightly on the whole to the tune of 0.2%.
  • 58.
    Foreword . Summary. Development of global financial assets . How global financial assets are distributed . Regional differences . Literature . Appendix Western Europe 58 This means that the overall portfolio (+3.4%), Denmark (+2.9%), Switzerland (+2.5%), structure has shifted further towards security: Germany (+1.2%) and Ireland (+0.5%) also saw the proportion of bank deposits at the end of 2011 their assets increase overall. Households in the came in at 34%, with insurance and pensions ac- Netherlands, Norway and Germany found that counting for a good 37%. Both asset classes were their rather conservative asset structures stood able to build on their positions by approximately them in good stead against the backdrop of the six percentage points compared with 2000. financial market developments. The share of portfolios invested in securities in these coun- Losses across the board tries was well below the western European aver- Savers managed to continue accumulating as- age in some cases. sets in spite of the bleak macroeconomic situ- ation and the low interest rate environment in only seven out of 16 western European coun- tries. Asset growth, however, was far less sub- stantial than in the two previous years. Belgian households led the field in this respect, with an increase in gross financial assets of 4.4%. Households in the Netherlands (+3.6%), Norway Bumpy stock markets weigh on household financial assets Change of gross financial assets, Development of individual asset classes 2011/2010, 2011 over 2010, in % in % 4 4 2 2 0 0 -2 -2 -4 -4 -6 Other -6 Western Europe -8 Insurance Securities -10 -8 Bank deposits BE NL NO DK CH DE IE AT FR UK SE IT PT FI ES GR Source: National Central Banks and Statistical Offices, UN, Allianz SE.
  • 59.
    Allianz Global WealthReport 2012 The developments proved disappoint- It comes as little surprise that the hefti- 59 ing for savers in Finland and Sweden, who invest est losses were seen in Greece. The financial as- a relatively high proportion of their financial as- sets of Greek households fell for the second time sets in securities in a western European compar- running in 2011, sliding by 9.1%. Greece’s per ison and were hit by losses totaling 3.5% and 2.4% capita assets at the end of 2011 averaged no more respectively. Slight losses were incurred in the than EUR 21,380, putting them clearly at the bot- UK (-0.4%) and France (-0.2%), whereas the asset tom of the western European rankings. In addi- base in Austria remained virtually unchanged tion to hefty securities losses, Greece witnessed (+0.03%). As was to be expected, the biggest as- a further decline in bank deposits (-3.2%) and in set losses were reported by the central banks in assets held in insurance and pensions (-1.7%). southern Europe. From Lisbon to Athens, assets The relatively moderate drop in bank deposits by fell by 3.5% or EUR 215bn, which corresponds to “only” EUR 7bn owes itself to the fact that many an average per capita drop of EUR 1,900 to just under EUR 45,570. This means that last year saw the gap separating these countries from the av- erage per capita financial assets for the region as a whole (EUR 65,620) widen to more than 30%. This is the biggest differential seen since the EMU came into being. Development of net financial assets and liabilities per capita, in EUR … …in the entire region… …and in southern Europe** 70,000 70,000 60,000 60,000 50,000 50,000 40,000 40,000 30,000 30,000 20,000 CAGR* 2001-2011: 20,000 CAGR* 2001-2011: Net financial assets: +1.3% p.a. Net financial assets: -0.7% p.a. 10,000 Liabilities: +5.2% p.a. 10,000 Liabilities: +7.5% p.a. Gross financial assets: +2.6% p.a. Gross financial assets: +1.6% p.a. 0 0 ’00 ’01 ’02 ’03 ’04 ’05 ’06 ’07 ’08 ’09 ’10 ’11 ’00 ’01 ’02 ’03 ’04 ’05 ’06 ’07 ’08 ’09 ’10 ’11 *CAGR = Compound Annual Growth Rate **Greece, Italy, Portugal and Spain Liabilities Source: National Central Banks and Statistical Offices, UN, Allianz SE. Net financial assets
  • 60.
    Foreword . Summary. Development of global financial assets . How global financial assets are distributed . Regional differences . Literature . Appendix Western Europe 60 Greeks (still) deemed it sufficient to merely jug- In the course of 2011, the savings rate of gle their accounts around a bit last year. In actu- western European households1 remained con- al fact, private households withdrew more than stant at around 13%, putting a halt to the down- EUR 28bn in demand, savings and time deposits ward trend seen in the previous year. Western from the country’s banks in 2011 as a whole. At Europeans have managed to strike a balance the same time, however, the deposits held by between their income and consumption growth EMU residents with banks on the island of Cy- again, with the consumption growth rate slow- prus for instance rose by more than 45% during ing from quarter to quarter and closing the year the same period, following a leap of around 75% just under the prior-year value at 3%. in 2009 and an exorbitant 402% one year later. Since Cypriot banks have numerous branches in Greece, this suggests that many of these trans- fers were made by Greek citizens who had lost confidence in their domestic banks. 1 Without Greece and Switzerland Greek bank deposits head for safer shores Development of bank deposits in the GIIPS-countries since the end of 2007, indexed (January 2009=100) 115 110 105 100 95 90 Italy 85 Spain Greece 80 Portugal 75 Ireland Dec 2007 Jun 2008 Dec 2008 Jun 2009 Dec 2009 Jun 2010 Dec 2010 Jun 2011 Dec 2011 Source: ECB, Allianz SE.
  • 61.
    Allianz Global WealthReport 2012 Debt growth losing momentum The net financial assets of western Eu- 61 since the outbreak of the crisis ropean households slid by 1.1% in total. Whereas If we look back on the past eleven years, debt nominal economic output grew at a far faster growth has slowed considerably. Whereas in rate than household liabilities, namely at almost the four years prior to the outbreak of the global 3%, the relative debt burden, as a percentage of financial and economic crisis, the liabilities of GDP, fell by 1.1 percentage points to 80.2%. The private households were still growing at a rate of same development was observed to a lesser ex- 8.2% a year, annual growth averaged 2.2% since tent back in 2010, when the debt ratio fell by 0.4 2007. This meant that regional net financial as- percentage points. As far as private households sets had already returned to the pre-crisis level are concerned, this means that further “delever- by the end of 2010. Last year, personal debt in aging” progress has been made on the whole. western Europe once again rose only fairly mod- erately, by 1.5%. The increase was driven largely by mortgage loans, whereas there was actually a slight decline in the consumer and other loans segment. This decline is likely due primarily to supply factors: according to a survey conducted by the European Central Bank on credit business in the eurozone, more and more banks tight- ened up their lending guidelines, particularly towards the end of the year, putting a damper on the supply of loans. Savings rate bottoms out, consumption slows Gross savings rate (rhs) and rate of change of the components (lhs), q/q in %* 1.0 14.5 0.8 14.0 0.6 13.5 0.4 13.0 Disposable income 0.2 12.5 Consumption expenditures 0.0 12.0 Savings rate Q1’10 Q2’10 Q3’10 Q4’10 Q1’11 Q2’11 Q3’11 Q4’11 Source: Eurostat, Allianz SE. *without Greece and Switzerland
  • 62.
    Foreword . Summary. Development of global financial assets . How global financial assets are distributed . Regional differences . Literature . Appendix Western Europe 62 A glance at the developments in the indi- tries in the region, meaning that its debt ratio vidual countries, however, shows that increased is “only” in the upper mid segment of the rank- debt discipline is not a trend that can be iden- ings. By contrast, any moves to push debt levels tified across the board. The largest relative in- down tended to be seen mainly in some of the crease in the liabilities side of the wealth balance countries on Europe’s periphery last year. Irish sheet was achieved by Norwegian households, households worked harder than households in which upped their liabilities by 7.4% last year. any other western European country to reduce More than four-fifths of the total debt burden their debt between 2009 and 2011, meaning that, was attributable to mortgage loans. In a regional by the end of 2011, the debt level was around comparison, the Norwegians ranked among the 8% lower than in 2007. Central banks in Greece households with the highest levels of per capita (-4.4%), Portugal (-3.4%) and Spain (-2.9%) also re- debt, with this figure totaling more than EUR ported declining personal debt levels. The weak 66,000 in Norway at the end of 2011, just behind and uncertain economic situations not only re- Switzerland (at least EUR 76,700) and ahead of stricted the demand for loans, but also made the the Danes (around EUR 64,200). With economic output of more than EUR 71,000 per capita, how- ever, Norway is streets ahead of all other coun- Liabilities growing at a slower rate since the crisis Development of liabilities and assets since 2000, indexed (2000=100) 200 180 160 140 120 100 Liabilities Gross financial assets 80 Net financial assets ’00 ’01 ’02 ’03 ’04 ’05 ’06 ’07 ’08 ’09 ’10 ’11 Source: National Central Banks and Statistical Offices, Allianz SE.
  • 63.
    Allianz Global WealthReport 2012 credit ratings of potential debtors less attractive. EUR 26,800, putting them in the wealth upper 63 Finally, the unemployment rate soared to record class in a global context. The lower wealth class highs in these countries, ranging from 12.9% in still included more than 130 million western Portugal to 17.7% in Greece and a dizzy 21.7% in Europeans last year; after subtracting their li- Spain (average annual figures). abilities, they are left with less than EUR 4,500 per capita. This means that the remaining 33% Asset classes: almost equal distribution in net terms of the population were in the middle wealth As far as their net financial assets are con- bracket last year. cerned, western Europeans are spread fairly Looking at the region as a whole, the av- evenly across all three asset classes. More than erage western European had net financial assets one third of the approximately 410 million peo- of EUR 41,240 per capita. A total of ten countries ple who live in this region had financial assets, in the region belonged to the HWC group at the after deductions for any liabilities, of at least end of 2011. Average per capita net financial as- sets came in at EUR 47,650 in this group of coun- tries, ranging from EUR 38,520 in Germany to EUR 138,060 in Switzerland. The MWC countries included, in net terms, Greece, Ireland, Portugal and Spain, as well as Finland and even Norway. Highest indebtedness per capita in Switzerland, Norway and Denmark Liabilities per capita in EUR (lhs) and debt-to-GDP ratio (rhs) 2011, in % 80,000 160 70,000 140 60,000 120 50,000 100 40,000 80 30,000 60 20,000 40 Western Europe 10,000 20 Liabilities per capita 0 0 Debt-to-GDP ratio CH NO DK NL IE SE UK FI FR ES AT BE DE PT IT GR Source: National Central Banks and Statistical Offices, UN, Allianz SE.
  • 64.
    Foreword . Summary. Development of global financial assets . How global financial assets are distributed . Regional differences . Literature . Appendix Western Europe 64 In Norway’s case, it is the country’s high debt lev- els, as mentioned above, that push net per capita financial assets down to this low level, relegat- ing the country to the very bottom of the western European MWC league table. On average, net per capita financial assets in the western European MWCs totaled EUR 16,120, putting them roughly on a par with the 2002 level. The global ranking based on net finan- cial assets per capita is once again led by Swiss households – with a clear lead over the Japanese, who come in second (net per capita financial assets: EUR 93,090). The top ten includes three other western European countries, Belgium (4th place), the Netherlands (5th place) and the UK (9th place). Belgian households fare better in terms of debt (EUR 18,960 per capita) than the Dutch and the British, and are well below the re- gional average of EUR 24,380. Western Europe: Ranking by net financial assets per capita, in EUR 140,000 120,000 100,000 80,000 60,000 Figures in brackets: 40,000 Global ranking 20,000 HWC 0 MWC CH BE NL UK DK IT FR SE AT DE IE PT FI ES GR NO (1) (4) (5) (9) (11) (12) (13) (14) (15) (16) (18) (19) (20) (21) (27) (29) Source: National Central Banks and Statistical Offices, UNU WIDER, UN, World Bank, Allianz SE.
  • 65.
    Allianz Global WealthReport 2012 65
  • 66.
    Foreword . Summary. Development of global financial assets . How global financial assets are distributed . Regional differences . Literature . Appendix 66
  • 67.
    Eastern Europe Population Total · · · · · · · · · · · · · · · · · · · · · · · · · · · · · · · · · · · · · · · · · · · · · · · · · · · · · · · · · · · · · · · · · · · · · · · · · · · 384 m Proportion of the global population · · · · · · · · · · · · · · · · · · · · · · · · · · · · · · · · · · · · · · · · · · · · · · 5.6% GDP Total · · · · · · · · · · · · · · · · · · · · · · · · · · · · · · · · · · · · · · · · · · · · · · · · · · · · · · · · · · · · · · · · · · · · EUR 3,070bn Proportion of global GDP · · · · · · · · · · · · · · · · · · · · · · · · · · · · · · · · · · · · · · · · · · · · · · · · · · · · · · · · · 6.3% Gross financial assets of private households Total · · · · · · · · · · · · · · · · · · · · · · · · · · · · · · · · · · · · · · · · · · · · · · · · · · · · · · · · · · · · · · · · · · · · EUR 1,560bn Average · · · · · · · · · · · · · · · · · · · · · · · · · · · · · · · · · · · · · · · · · · · · · · · · · · · · · · · · · EUR 4,060 per capita Proportion of global financial assets · · · · · · · · · · · · · · · · · · · · · · · · · · · · · · · · · · · · · · · · · · · · · 1.5% Debt Total · · · · · · · · · · · · · · · · · · · · · · · · · · · · · · · · · · · · · · · · · · · · · · · · · · · · · · · · · · · · · · · · · · · · · · EUR 630bn Average · · · · · · · · · · · · · · · · · · · · · · · · · · · · · · · · · · · · · · · · · · · · · · · · · · · · · · · · · EUR 1,630 per capita As % of GDP · · · · · · · · · · · · · · · · · · · · · · · · · · · · · · · · · · · · · · · · · · · · · · · · · · · · · · · · · · · · · · · · · · · · · 20.4%
  • 68.
    Foreword . Summary. Development of global financial assets . How global financial assets are distributed . Regional differences . Literature . Appendix Eastern Europe 68 Eastern European EU members: slow growth Last year’s regional leaders were Slova- Despite the considerable extent to which the kia (8.1%) and Lithuania (11.9%), who are now eastern European EU states depend on euro area slowly getting back on their feet again after developments, the countries in this region fared the severe recession of 2009. Hungary is still relatively well in 2011. Latvia’s economy also re- the region’s problem child: the gross financial ported positive growth rates again, and the re- assets of private households slumped by 5.6% gion as a whole achieved economic growth of year-on-year after the government national- 6.4% on a year earlier, compared with “only” 3.7% ized the obligatory private pillar of the pension in 2010. The continuing effects of the crisis have, insurance system in an attempt to restructure however, still left a visible mark on financial as- its budget. The country’s citizens had paid the sets. Although gross financial assets increased equivalent of almost EUR 9.5bn into this pillar by 3.5% in 2011, this is a very low rate in a long- since 1998, funds that are now sorely missing in term comparison – average annual growth rate household balance sheets. And unfortunately, of +11.8% since 2000. the medium-term prospects for the Hungarian population are also anything but promising: the country’s economy is entering another recession that is expected to last until 2013, with inflation set to be well above the 5% mark this year and unemployment recently climbing to as much as 11.8%. Eastern European member states: Weak growth of financial assets Net financial assets and liabilities, Net financial assets and liabilities 2011, in EUR bn in EUR bn 900 Poland 800 Czech Republic 700 Romania 600 Hungary 500 Slovakia 400 Slovenia 300 Bulgaria CAGR* 2001-2011: 200 Net financial assets: +8.6% p.a. Lithuania Liabilities: +21.5% p.a. 100 Estonia Gross financial assets: +11.8% p.a. 0 Latvia ’00 ’07 ’08 ’09 ’10 ’11 0 100 200 300 *CAGR = Compound Annual Growth Rate Liabilities Source: National Central Banks and Statistical Offices, Allianz SE. Net financial assets
  • 69.
    Allianz Global WealthReport 2012 The weak Hungarian forint is putting Household debt on the wane 69 additional pressure on households, because The eastern European economic success story many mortgage loans were granted in euros of the past decade also came hand-in-hand with or Swiss francs in the past. Up until the end of a huge boom in the liabilities of private house- February 2012, however, households were able to holds. When the financial crisis forced banks to repay these loans at a more favorable exchange restrict lending in, and to, eastern Europe, this rate, meaning that, according to preliminary obviously had an impact on households. Since estimates, home loans denominated in foreign 2009, liabilities have been growing at an average currencies fell by 22% as against the end of 2011 rate of only 5.2%, compared with average annu- in the first three months of this year. Never- al rates of more than 28% in the years between theless, there are still outstanding home loans 2000 and 2008. Debt levels were actually on the worth EUR 6.6bn. decline in most of these countries. The main The region as a whole is home to 1.4% of debt accumulation culprits are Poland, Slovakia the people whose asset situation is analyzed in and the Czech Republic. the Allianz Global Wealth Report, although the eastern European EU states only account for 0.8% of global gross financial assets, at EUR 849bn. Frontrunner Slovenia Net financial assets and liabilities per capita, Net financial assets and liabilities per capita 2011, in EUR in EUR 9,000 Slovenia 8,000 Estonia 7,000 Czech Republic 6,000 Hungary 5,000 Slovakia 4,000 Poland 3,000 Lithuania CAGR* 2001-2011: 2,000 Net financial assets: +8.7% p.a. Romania Liabilities: +21.7% p.a. 1,000 Latvia Gross financial assets: +12.0% p.a. 0 Bulgaria ’00 ’07 ’08 ’09 ’10 ’11 0 5,000 10,000 15,000 20,000 *CAGR = Compound Annual Growth Rate Liabilities Source: National Central Banks and Statistical Offices, UN, Allianz SE. Net financial assets
  • 70.
    Foreword . Summary. Development of global financial assets . How global financial assets are distributed . Regional differences . Literature . Appendix Eastern Europe 70 The difficult economic environment, Europe, the country tumbles to second-last place however, meant that the growth in household in net terms, conferring it only LWC status. Po- assets has been lagging behind the growth in li- land and Lithuania, with net per capita financial abilities in recent years. This casts the region in assets of EUR 4,150 and EUR 4,090 respectively a poorer light in net terms than in gross terms also lose their MWC ranking (net assets of more in a global comparison. At EUR 516bn, only 0.72% than EUR 4,500 per capita). of the world’s net assets are located in the re- Slovenia, where per capita net financial gion. The most prominent example is Slovakia, assets total EUR 14,050, continues to lead the which, with per capita assets of EUR 8,160, takes field here. This puts the country in 23rd place in 33rd place (out of 52) in the global comparison in our global ranking. gross terms – only two places lower than in 2000. In net terms, the country has slid to 41st place, with assets of EUR 1,940 per capita – 9 places lower than at the beginning of the millennium. Private household debt soared from 13% of GDP to 49% last year. While Slovakia makes it into the MWC club in gross terms, putting it in the mid- dle of the rankings in fifth place within eastern Average income distribution in comparison Share of total income by income decile, in % 30 20 10 Eastern Europe (EU) World Emerging 0 markets 1. decile 2. decile 3. decile 4. decile 5. decile 6. decile 7. decile 8. decile 9. decile 10. decile Source: National Central Banks and Statistical Offices, Allianz SE.
  • 71.
    Allianz Global WealthReport 2012 The region is still not home to a sin- The asset investment structure in the 71 gle HWC, a status that requires average net per region varies greatly from country to country. capita assets in excess of EUR 26,800. Slovenia, Two trends, however, have prevailed in almost Estonia, Romania, the Czech Republic and Hun- all of the countries in this region in recent years. gary, however, rank among the MWCs. Within For one, the proportion of insurance products the individual countries, incomes and assets are and pensions has grown considerably since the fairly evenly distributed: only 38% of income and start of the century as private retirement pro- 69% of assets are in the hands of the richest 20% vision structures have been established. The of the population. All in all, 27 million people, i.e. only country to buck this trend last year was, of more than one quarter of the total population, course, Hungary, which opted to nationalize its are classed as falling into the middle wealth obligatory private pension insurance pillar. The bracket in global terms. In a global comparison, proportion of bank deposits also slid sharply 3.8% of middle wealth individuals live in the during the course of the economic upswing, al- eastern European EU states. though this trend has been reversed since the outbreak of the crisis in 2008. The most evident turnaround can be seen in Bulgaria, where the proportion of total financial assets invested in bank deposits slid from 55% in 2000 to 32% in 2007, before climbing back up to 46% last year. Structure of financial assets: Reversion towards more bank deposits Asset classes as % of gross financial assets 6 14 16 15 15 16 32 34 37 43 33 38 54 Other 39 45 45 41 43 Insurance Securities Bank deposits 2000 2007 2008 2009 2010 2011 Source: National Central Banks and Statistical Offices, Allianz SE.
  • 72.
    Foreword . Summary. Development of global financial assets . How global financial assets are distributed . Regional differences . Literature . Appendix Eastern Europe 72 Eastern Europe outside of the EU Since 77% of the region’s population lives At EUR 712bn, only 0.7% of the world’s gross in Russia and Turkey, it comes as no surprise financial assets are located in Croatia, Kaza- that the financial assets are also concentrated khstan, Russia, Turkey and Ukraine, although in these two countries (Russia: EUR 366bn and no less than 5.9% of the population included in Turkey: EUR 221bn). In per capita terms, however, our analysis live in these countries. The region Croatia is the clear leader of the pack. With gross with the lowest financial assets in our analysis financial assets of EUR 9,720 per capita, Croatia is, however, the unchallenged growth leader – is the only country in the region to qualify as an both over the past ten years and in 2011. After MWC, and would come in 4th place (31st place average annual growth rates of more than 23% worldwide) if it were to be ranked alongside the in the period leading up to 2010, the growth rate eastern European EU members – as far as assets was slashed almost in half last year to 13.6% on a are concerned, the country has already joined year earlier. The only region to achieve similarly the ranks of the EU. strong growth in 2011 was Latin America (9.6%); in a long-term analysis, however, even Latin America is left well behind with average growth of 14.1% (2001 – 2010). Ranking Eastern Europe Gross financial assets per capita, in EUR Net financial assets per capita, in EUR Slovenia (26) 20,197 Slovenia (23) 14,049 Estonia (27) 15,540 Estonia (24) 9,672 Czech Republic (28) 14,353 Czech Republic (26) 9,408 Croatia (31) 9,724 Croatia (31) 5,482 Hungary (32) 8,798 Romania (32) 5,343 Slovakia (33) 8,156 Hungary (33) 5,224 Poland (34) 7,434 Poland (35) 4,153 Lithuania (35) 7,349 Lithuania (36) 4,089 Romania (36) 6,856 Bulgaria (38) 3,191 Latvia (39) 5,290 Slovakia (41) 1,938 Bulgaria (41) 4,806 Turkey (43) 1,659 Turkey (44) 2,998 Russia (45) 1,549 Russia (46) 2,566 Latvia (46) 1,392 Kazakhstan (49) 1,355 Ukraine (49) 928 Ukraine (50) 1,329 Kazakhstan (51) 539 6,400 < MWC < 38,700 4,500 < MWC < 26,800 Figures in brackets: Place in the global ranking Source: National Central Banks and Statistical Offices, UNU WIDER, UN, World Bank, Allianz SE.
  • 73.
    Allianz Global WealthReport 2012 The country is followed, with a consider- of EUR 5,480 per capita, however, the country is 73 able gap, by Turkey with just under EUR 3,000 per still a MWC. All in all, the region is home to 27 capita and then Russia with EUR 2,570. million people in the middle wealth category – But it is not only as far as asset bases 3.7% of the world’s middle class. Most of them are concerned that the region takes the title of (14.3 million) live in Russia. In Croatia, high growth champion; it also leads the rankings wealth (net financial assets of more than EUR when it comes to accumulating liabilities. And 26,800 per capita) is the reserve of only the top yet, despite average growth rates of almost 40% decile of the population (0.4 million people). since 2000, the region’s debt level is the lowest in the world, corresponding to 13.7% of GDP or the equivalent of EUR 1,040 per capita. Here, again, Croatia comes in first with liabilities of EUR 4,240 per capita or 41.1% of GDP. This, however, puts Croatia’s household debt well above the av- erage for the eastern European EU states, which stands at 35.9% of GDP. With net financial assets Croatia at EU-level Net financial assets and liabilities per capita, Net financial assets and liabilities per capita 2011, in EUR in EUR 2,500 Croatia 2,000 Turkey 1,500 Russia 1,000 CAGR* 2001-2011: Kazakhstan 500 Net financial assets: +17.9% p.a. Liabilities: +39.6% p.a. Gross financial assets: +22.5% p.a. Ukraine 0 ’00 ’07 ’08 ’09 ’10 ’11 0 5,000 10,000 *CAGR = Compound Annual Growth Rate Liabilities Source: National Central Banks and Statistical Offices, UN, Allianz SE. Net financial assets
  • 74.
    Foreword . Summary. Development of global financial assets . How global financial assets are distributed . Regional differences . Literature . Appendix 74
  • 75.
    Asia Population Total · · · · · · · · · · · · · · · · · · · · · · · · · · · · · · · · · · · · · · · · · · · · · · · · · · · · · · · · · · · · · · · · · · · · · · · · · 3,140 m Proportion of the region as a whole · · · · · · · · · · · · · · · · · · · · · · · · · · · · · · · · · · · · · · · · · · · · · · 81% Proportion of the global population · · · · · · · · · · · · · · · · · · · · · · · · · · · · · · · · · · · · · · · · · · · · · · 46% GDP Total · · · · · · · · · · · · · · · · · · · · · · · · · · · · · · · · · · · · · · · · · · · · · · · · · · · · · · · · · · · · · · · · · · · EUR 14,080bn Proportion of the region as a whole · · · · · · · · · · · · · · · · · · · · · · · · · · · · · · · · · · · · · · · · · · · · · · 94% Proportion of global GDP · · · · · · · · · · · · · · · · · · · · · · · · · · · · · · · · · · · · · · · · · · · · · · · · · · · · · · · 26.4% Gross financial assets of private households Total · · · · · · · · · · · · · · · · · · · · · · · · · · · · · · · · · · · · · · · · · · · · · · · · · · · · · · · · · · · · · · · · · · · EUR 27,860bn Average · · · · · · · · · · · · · · · · · · · · · · · · · · · · · · · · · · · · · · · · · · · · · · · · · · · · · · · · · EUR 8,870 per capita Proportion of global financial assets · · · · · · · · · · · · · · · · · · · · · · · · · · · · · · · · · · · · · · · · · · · · · 27% Debt Total · · · · · · · · · · · · · · · · · · · · · · · · · · · · · · · · · · · · · · · · · · · · · · · · · · · · · · · · · · · · · · · · · · · · EUR 7,080bn Average · · · · · · · · · · · · · · · · · · · · · · · · · · · · · · · · · · · · · · · · · · · · · · · · · · · · · · · · · EUR 2,260 per capita As % of GDP · · · · · · · · · · · · · · · · · · · · · · · · · · · · · · · · · · · · · · · · · · · · · · · · · · · · · · · · · · · · · · · · · · · · · 50.3%
  • 76.
    Foreword . Summary. Development of global financial assets . How global financial assets are distributed . Regional differences . Literature . Appendix Asia 76 The financial assets of private households in lowed by China, where the Shanghai Stock Index Asia were also dealt a blow by the financial cri- (A Shares) lost 21.6% after having already lost sis: 2011 saw the weakest rise in total financial 14.5% in the previous year. At the end of the year, assets in the region since 2008. Compared with the Shanghai Stock Index was only 112 points 6.6% in 2010, financial assets in the countries higher than it had been at the end of 2000. The included in our analysis grew by only 2.6% last Nikkei also continued on a downward spiral, not year, totaling the equivalent of EUR 27,860bn at least due to the earthquake and devastating tsu- the end of 2011. nami, losing a further 17.3% as against 2011. This The main culprit here was the poor per- means that the Nikkei has lost almost 40% of its formance on most of Asia’s stock markets. With value since 2000. the exception of the stock exchanges in Indo- nesia and Malaysia, all of the leading indices in the countries analyzed were down in 2011 in a year-on-year comparison. Whereas Thailand’s leading index only fell by 0.2%, the other coun- tries saw rates of decline in the double digits: at 27%, the most marked slump was in India, fol- Moderate growth of financial assets Net financial assets and liabilities, Percentage change, in EUR bn yoy 30,000 12 10 25,000 8 20,000 6 4 15,000 2 10,000 0 CAGR* 2001-2011: Net financial assets: +4.7% p.a. -2 5,000 Liabilities: +2.8% p.a. -4 Gross financial assets: +4.2% p.a. 0 -6 ’00 ’07 ’08 ’09 ’10 ’11 ’00 ’01 ’02 ’03 ’04 ’05 ’06 ’07 ’08 ’09 ’10 ’11 *CAGR = Compound Annual Growth Rate Liabilities Source: National Central Banks, Supervisory Authorities and Statistical Offices, Allianz SE Gross financial assets Net financial assets
  • 77.
    Allianz Global WealthReport 2012 All in all, the value of financial assets 58% by the end of last year. The proportion of 77 held in securities fell by 7.4% as a result, where- claims from life insurance policies and pension as bank deposits swelled by 6.0% and claims schemes, on the other hand, remained virtually from life insurance policies and pension funds constant at around 23%. Nevertheless, there are climbed by 2.8%. The fact that total financial as- marked differences between countries in terms sets grew by 2.6% despite the drop in share prices of the financial asset structure and, as a result, is due primarily to the fact that the share of the also the growth in financial assets in the indi- total portfolio taken up by securities had already vidual countries. fallen since the outbreak of the financial crisis In China, bank deposits have become in most of the Asian countries in our analysis. In more popular again since the financial crisis, the year before the financial crisis hit, namely in rising by almost 12% during the year. Claims vis- 2007, an average Asian household held 22.3% of à-vis life insurance policies and pension funds its total assets in equities or fixed-income secu- increased by around 7%, while investments in rities. By the end of 2011, this figure had dwin- securities are likely to have fallen by 11%. This dled to only just under 17%. On the other side of means that, at the end of 2011, private house- the equation, bank deposits have started gain- holds are likely to have held more than two- ing ground again. After only just over half of to- thirds of their financial assets in bank deposits tal financial assets (51%) had been held in bank deposits in 2007, the proportion held in this type of investment had bounced back to almost Financial crisis left its mark on Asia’s stock markets Development of most important equity indices (2000=100) 1,000 IDX Composite 900 800 700 600 500 India BSE National 500 400 Bangkok s.e.t. 50 Korea SE Composite (KOSPI) 300 FTSE Bursa Malaysia KLCI Israel TA 100 200 Taiwan SE Weighted FTSE W Singapore 100 Shanghai SE A Share Nikkei 225 Stock Average 0 ’00 ’01 ’02 ’03 ’04 ’05 ’06 ’07 ’08 ’09 ’10 ’11 Soruce: Datastream.
  • 78.
    Foreword . Summary. Development of global financial assets . How global financial assets are distributed . Regional differences . Literature . Appendix Asia 78 and only around 14% in the form of equities and In India and Indonesia, which have the fixed-income securities; in 2007, securities ac- lowest financial assets out of the countries ana- counted for 26%. Claims vis-à-vis life insurance lyzed, the development was once again charac- policies and pension funds rose last year due to terized by the catch-up process in 2011. Financial the growing significance of company and pri- assets in these two countries grew by 18.1% and vate pension schemes, and are expected to have 25.8% respectively. Securities assets, in particu- accounted for around 11% of portfolios last year, lar, reported above-average growth last year. Not in spite of the slump on the life insurance mar- least due to the fairly immature financial system, ket. All in all, the gross financial assets of pri- however, Indian households still held more than vate households rose by 7% to the equivalent of half of their financial assets, which totaled EUR EUR 6,480bn, which corresponded to per capita 895bn or EUR 720 per capita at the end of 2011, financial assets of EUR 4,800. At the same time, in bank deposits. In Indonesia, the same figure however, debt increased to 16.2% to EUR 1,665bn, comes in at almost two thirds. Here, financial or EUR 1,230 per capita. This brought average assets totaled the equivalent of EUR 209bn at the net financial assets in at EUR 3,570 per capita in end of 2011, or EUR 860 per capita. Private house- 2011. hold debt just outstripped the increase in finan- cial assets in both countries, growing by almost 20% and 29.4% respectively. This explains why the increase in net financial assets was slightly lower than the increase in gross financial assets in both countries. At the end of last year, net per capita financial assets totaled EUR 640 in Indo- nesia and around EUR 470 in India. Bank deposits still dominate portfolios Asset classes, Asset classes as % of percentage change yoy gross financial assets 30 100 20 80 10 60 0 -10 40 -20 Other 20 -30 Insurance Securities -40 0 Bank deposits 2008 2009 2010 2011 ’01 ’02 ’03 ’04 ’05 ’06 ’07 ’08 ’09 ’10 ’11 Source: National Central Banks, Supervisory Authorities and Statistical Offices, Allianz SE.
  • 79.
    Allianz Global WealthReport 2012 In Israel, the fact that private households In Japan, too, private households saw 79 hold more than half of their financial assets ei- their financial assets decline further last year, ther directly or indirectly in the form of equities after gross financial assets had risen slightly and fixed-income securities meant that the in- again in the two years prior to 2011. According to crease in bank deposits to the tune of 11.4% and the Japanese central bank, these assets totaled in life insurance and pension funds to the tune the equivalent of EUR 15,572bn (EUR 123,100 per of 6.8% was not enough to compensate for the capita) at the end of 2011, down by 0.4% on the 9.4% loss in the value of securities, and the share prior year. This was fueled mainly by the decline of total financial assets held in securities slid in fixed-income securities and investments held from 61% to 57%. Total gross financial assets of in financial derivatives to the tune of 14.4% and private households dropped by 2.2% as a result to 15.0% respectively, as well as the poor perform- the equivalent of EUR 482bn, which correspond- ance of the stock market, which prompted a 7.7% ed to EUR 63,700 in per capita terms. During the same period, however, loans increased by 9.6%, cutting net per capita financial assets by 5.6% to EUR 55,260 at the end of 2011. Huge differences in asset structures Asset classes as % of gross financial assets 2011, by country China India Indonesia Israel Japan Malaysia Singapore South Korea Other Insurance Taiwan Securities Thailand Bank deposits 0 10 20 30 40 50 60 70 80 90 100 Source: National Central Banks, Supervisory Authorities and Statistical Offices, Allianz SE.
  • 80.
    Foreword . Summary. Development of global financial assets . How global financial assets are distributed . Regional differences . Literature . Appendix Asia 80 loss in equity assets. Consequently, Japanese Due to this development, the portfolio households were hit by a 10.2% decline in their composition chosen by private households has investments held in equities and fixed-income become more conservative: the share of bank securities. Although their total value had only deposits has reached the highest value seen accounted for a good 15% of total financial assets since 2001, accounting for more than 56% of to- back in 2010, the 2.3% increase in bank deposits tal financial assets at the end of 2011. Life insur- and 0.2% increase in life insurance and pension ance and pension funds have also continued to funds were unable to compensate for this de- gain ground. Claims under these investment cline. forms accounted for 27% of total financial assets, whereas the share of portfolios held in other in- vestment forms dropped to 3.0%. A glance at net assets casts the situation of private households in a slightly more positive light: since they con- tinued to reduce their liabilities last year, name- ly by 1.5%, net financial assets remained virtu- ally constant overall, at the equivalent of around EUR 11,755bn. In per capita terms, there was ac- tually a slight increase from an average of EUR 93,060 to EUR 93,090. Catch-up process largely intact Gross financial assets, percentage change over previous year China India Indonesia Israel Japan Malaysia Singapore South Korea Taiwan Thailand -5 0 5 10 15 20 25 2011 Source: National Central Banks, Supervisory Authorities and Statistical Offices, Allianz SE. 2010
  • 81.
    Allianz Global WealthReport 2012 In Malaysia, the gross financial assets Financial assets in South Korea grew 81 of private households rose by 8.4% to the equiv- by 5.3% – a similar rate to those in Singapore. alent of EUR 364bn, or EUR 12,630 in per capita Here, however, the trend was owed to the 10.4% terms, last year. The main factor in this develop- increase in claims under life insurance policies ment was the fact that private households had and pension funds and the 8.4% rise in bank de- invested around one third of their financial as- posits. Because the state pension system only sets in bank deposits, securities and life insur- provides minimal coverage, claims under life in- ance and pension funds respectively. Equities, surance policies and pension funds now account on the other hand, only accounted for 50% of for one quarter of total financial assets. Bank the securities portfolio. This means that, while deposits remain by far the most important as- private households in this asset class saw much set class, accounting for 46% of financial assets. lower growth than in the previous year, growth Securities investments lost 3.7% of their value was still positive at 5%. Nevertheless, the growth last year. Financial assets totaled the equivalent in lending remained high: liabilities were up by of EUR 1,504bn at the end of 2011, or EUR 31,830 12.5% to the equivalent of EUR 159bn. This put the per capita. In net terms, however, the financial net financial assets of private households at the assets of private households fell due to the 8.5% equivalent of EUR 205bn, which corresponded to increase in debt, to an average of EUR 15,250, last EUR 7,100 in per capita terms. year. This means that, at the equivalent of EUR In Singapore, the financial assets of pri- 16,580, average net per capita financial assets vate households grew by a total of 5.5% thanks to were only just over half as high as average gross double-digit growth in bank deposits, whereas per capita financial assets. there was only a small increase in claims from life insurance policies and pension funds, which grew by 1.2% and 2.6% respectively. Total finan- cial assets came in at the equivalent of EUR 435bn at the end of 2011, or EUR 83,910 per cap- ita. The increase in debt was roughly the same at 5.7%, bringing it to EUR 133bn at the end of 2011, meaning that the average Singaporean had debt to the tune of EUR 25,700. As a result, net financial assets amounted to EUR 302bn or EUR 58,200 per capita.
  • 82.
    Foreword . Summary. Development of global financial assets . How global financial assets are distributed . Regional differences . Literature . Appendix Asia 82 In Taiwan, equities and fixed-income households also slowed last year compared to securities were the second most important as- 2010: although debt rose by only 3.2%, this was set class at the end of 2010, accounting for al- still higher than the rate of growth in finan- most 33% of total financial assets, followed by cial assets. This put net financial assets at EUR bank deposits, which accounted for 40%. As a 1,413bn at the end of 2011, which corresponded result, the 7.2% decline in securities also left its to EUR 60,900 in per capita terms. mark on overall development in 2011: although bank deposits increased by 5.8% and receivables from life insurance policies and pension funds by as much as 9.3%, total financial assets only increased by 2.1% to EUR 1,646bn or EUR 70,940 per capita. At the same time, the proportion of bank deposits in relation to total financial as- sets climbed to 41%, while the proportion of as- sets held in securities dropped to less than 30%. What is more, borrowing among Taiwanese Japanese households are still the wealthiest in Asia Gross financial assets by country, in % 6 1 6 23 2 1 China India Indonesia 3 Israel 1 2 Japan Malaysia Singapore South Korea Taiwan 55 Thailand Source: National Central Banks, Supervisory Authorities and Statistical Offices, UN Population Division, World Population Prospects, 2010 Revision, Allianz SE.
  • 83.
    Allianz Global WealthReport 2012 Growth in Thailand was similarly sub- In a comparison of the different coun- 83 dued; here, the financial assets held in equities tries, Japan still has the highest financial assets and securities slid by 2.3%. Bank deposits, how- in the region, with 55% of total financial assets ever, which still account for more than 50% of attributable to Japanese households overall. Due the overall portfolio of private households, in- to the sheer size of the population, China now creased by 6.4%. This means that, all in all, pri- accounts for 23%. It is followed by Taiwan and vate households enjoyed a slight increase of 3.0% Singapore, each of which account for 6%. If, how- in their gross financial assets last year. At the ever, we look at net per capita financial assets, end of 2011, they came in at EUR 237bn, which the pecking order behind Japan changes: Japa- corresponded to EUR 3,400 in per capita terms. nese households lead the field in this compari- Private household debt, however, increased by son, too, with net financial assets of EUR 93,090 14.5% not least due to the devastating floods, per capita, making them the richest out of the meaning that the average Thai person now has Asian countries analyzed. They are followed by debt of EUR 1,060. As a result, net financial as- Taiwanese households with net financial assets sets fell by 2.0% to EUR 2,390, compared with EUR of EUR 60,900, and then by Singapore with an av- 2,390 in 2010. erage of EUR 58,200, because debt levels are low- er than in Singapore. In gross terms, the order is precisely the other way round. Japanese households are still the wealthiest in Asia Net financial assets and liabilities per capita 2011, in EUR Japan (123,099) Singapore (83,911) Taiwan (70,938) Israel (63,695) South Korea (31,829) Malaysia (12,629) China (4,809) Liabilities Thailand (3,405) Net financial assets Indonesia (863) Figures in brackets: Gross financial assets India (721) per capita 0 25,000 50,000 75,000 100,000 125,000 Source: National Central Banks, Supervisory Authorities and Statistical Offices, UN Population Division, World Population Prospects, 2010 Revision, Allianz SE.
  • 84.
    Foreword . Summary. Development of global financial assets . How global financial assets are distributed . Regional differences . Literature . Appendix 84
  • 85.
    Australia and NewZealand Population Total · · · · · · · · · · · · · · · · · · · · · · · · · · · · · · · · · · · · · · · · · · · · · · · · · · · · · · · · · · · · · · · · · · · · · · · · · · · · 27 m Proportion of the global population · · · · · · · · · · · · · · · · · · · · · · · · · · · · · · · · · · · · · · · · · · · · · · 0.4% GDP Total · · · · · · · · · · · · · · · · · · · · · · · · · · · · · · · · · · · · · · · · · · · · · · · · · · · · · · · · · · · · · · · · · · · · EUR 1,260bn Proportion of global GDP · · · · · · · · · · · · · · · · · · · · · · · · · · · · · · · · · · · · · · · · · · · · · · · · · · · · · · · · · 2.4% Gross financial assets of private households Total · · · · · · · · · · · · · · · · · · · · · · · · · · · · · · · · · · · · · · · · · · · · · · · · · · · · · · · · · · · · · · · · · · · · EUR 2,240bn Average · · · · · · · · · · · · · · · · · · · · · · · · · · · · · · · · · · · · · · · · · · · · · · · · · · · · · · · · EUR 82,970 per capita Proportion of global financial assets · · · · · · · · · · · · · · · · · · · · · · · · · · · · · · · · · · · · · · · · · · · · · 2.2% Debt Total · · · · · · · · · · · · · · · · · · · · · · · · · · · · · · · · · · · · · · · · · · · · · · · · · · · · · · · · · · · · · · · · · · · · EUR 1,380bn Average · · · · · · · · · · · · · · · · · · · · · · · · · · · · · · · · · · · · · · · · · · · · · · · · · · · · · · · · EUR 51,010 per capita As % of GDP · · · · · · · · · · · · · · · · · · · · · · · · · · · · · · · · · · · · · · · · · · · · · · · · · · · · · · · · · · · · · · · · · · · · 109.3%
  • 86.
    Foreword . Summary. Development of global financial assets . How global financial assets are distributed . Regional differences . Literature . Appendix Australia and New Zealand 86 At around EUR 2.2 trillion, Australia and New the world’s industrialized nations as a whole. Zealand were home to 2.2% of global gross fi- This is due first and foremost to the weak year nancial assets last year. The asset base has more on the stock markets, which put particular pres- than doubled since 2000 thanks to the com- sure on Australian households. Although they modities boom, with per capita assets in the only invest a small proportion (around 8%) of region, less liabilities, climbing to almost EUR their financial assets in securities, the vast ma- 83,000. Although Australians were hit hard by jority of these holdings were in the form of direct the slump in commodity prices in 2008 and the shareholdings/other equity interests (a good losses on the stock markets, the country was 85%). As a result, fixed-income securities could not plunged into a recession and made a rapid only soften the blow to a minor extent, meaning recovery in the aftermath of the crisis. Only one that securities assets contracted by more than year later, Australia had made up for most of the 21% overall. Nonetheless, the gross financial as- asset losses again. In comparison with the rapid sets of Australia’s citizens increased slightly, all growth seen in the first decade of this century, in all, growing by 0.5% thanks to robust growth when the region achieved growth averaging 8.2% in bank deposits and a more conservative asset per annum in spite of the crisis, regional asset structure on the whole. growth in 2011 came in at a meager 0.7% – this was, however, sufficient to allow the region to keep pace with the development witnessed in Net financial assets slip Net financial assets and liabilities, Net financial assets and liabilities per capita, in EUR bn in EUR 2,400 90,000 2,200 80,000 2,000 70,000 1,800 1,600 60,000 1,400 50,000 1,200 40,000 1,000 800 30,000 CAGR* 2001-2011: CAGR* 2001-2011: 600 Net financial assets: +3.9% p.a. 20,000 Net financial assets: +2.4% p.a. 400 Liabilities: +10.8% p.a. Liabilities: +9.2% p.a. 10,000 200 Gross financial assets: +7.5% p.a. Gross financial assets: +6.0% p.a. 0 0 ’00 ’07 ’08 ’09 ’10 ’11 ’00 ’07 ’08 ’09 ’10 ’11 *CAGR = Compound Annual Growth Rate Liabilities Source: National Central Banks and Statistical Offices, UN, Allianz SE. Net financial assets
  • 87.
    Allianz Global WealthReport 2012 Citizens in neighboring New Zealand fared bet- There is still a marked prosperity and 87 ter, actually outperforming the global average. asset gap between the two countries: whereas Their asset base grew by 3.9%. The positive devel- per capita economic output in Australia stood opment in bank deposits and insurance, which, at EUR 50,370 at the end of 2011, the same figure taken together, accounted for almost 68% of the for New Zealand was around half this amount. asset portfolio, more than compensated for the The discrepancy in financial assets is even more losses affecting securities assets (-3.8%). In net evident: in gross terms, Australians had assets terms, i.e. taking personal liabilities into ac- worth EUR 93,360 per capita, while their neigh- count, financial assets in the region dropped by bors in New Zealand did not even have one third 5.6% in total – debt grew at a rate of more than of this amount. Taking the liabilities into ac- 5%, more than seven times faster than assets. count, the financial assets of households in New Zealand actually equated to only 12% of the net financial assets of Australian households, aver- aging EUR 4,440 per capita. Admittedly, at EUR 25,310, the absolute debt levels of New Zealand households were far lower than in Australia (EUR 56,030). If, however, we compare both countries based on the relative debt burden, New Zealand is carrying far more weight on its shoulders: for each euro borrowed, households in New Zealand Conservative asset structure cushions losses of asset class securities Asset classes as % of gross financial assets Australia New Zealand 100 16 15 25 14 16 17 75 54 60 57 59 62 62 24 26 23 30 25 50 33 21 12 13 10 8 25 17 52 50 51 46 49 26 25 25 27 36 20 19 0 ’00 ’07 ’08 ’09 ’10 ’11 ’00 ’07 ’08 ’09 ’10 ’11 Source: Australian Bureau of Statistics, Reserve Bank of New Zealand, Allianz SE.
  • 88.
    Foreword . Summary. Development of global financial assets . How global financial assets are distributed . Regional differences . Literature . Appendix Australia and New Zealand 88 only have EUR 1.20 in assets, while the Austral- Debt growth continues to slow ians have over 41% more to offer in assets, at EUR A continuous upward trend in personal liabili- 1.70. Finally, in net terms New Zealand only nar- ties has been a hallmark of both countries over rowly lost its status as a MWC – a gap of only EUR the past ten years. Growth rates reached their 60 prevented the country from jumping into the peak in the years leading up to the financial and middle wealth class. In contrast, Australia quali- economic crisis, averaging more than 13% a year. fied without any problems as a HWC – both in It is, however, not so much to finance consump- net and gross terms. In the global rankings (net tion that Australians and New Zealanders have per capita financial assets), New Zealand took been accumulating debt, but rather to finance 34th place at the end of 2011, which is, at least, their homes: mortgage loans accounted for just one place better than in the previous year. In a under 91% of total loans in Australia, and as longer-term analysis, however, the country has much as over 93% of total loans in New Zealand, slid ten places down the rankings, widening the in 2011. House prices were on a dizzying ascent gap separating it from Australia from twelve up until 2007, forcing new buyers to take out places in 2000 to 17 in 2011. ever larger loans. The annual growth in personal debt has been slowing in recent years, bringing it down to 5.5% in Australia and 0.9% in New Zea- land in 2011. Net financial assets and liabilities per capita, in EUR Australia New Zealand 100,000 100,000 90,000 90,000 80,000 80,000 CAGR* 2001-2011: 70,000 70,000 Net financial assets: -5.1% p.a. 60,000 60,000 Liabilities: +7.3% p.a. Gross financial assets: +3.9% p.a. 50,000 50,000 40,000 40,000 30,000 30,000 CAGR* 2001-2011: 20,000 Net financial assets: +2.7% p.a. 20,000 Liabilities: +9.4% p.a. 10,000 Gross financial assets: +6.1% p.a. 10,000 0 0 ’00 ’07 ’08 ’09 ’10 ’11 ’00 ’07 ’08 ’09 ’10 ’11 *CAGR = Compound Annual Growth Rate Liabilities Source: Australian Bureau of Statistics, Reserve Bank of New Zealand, UN, Allianz SE. Net financial assets
  • 89.
    Allianz Global WealthReport 2012 This stabilized the debt burden as a proportion with low interest rates, to make early repay- 89 of GDP. Households in Australia used the phase ments. Finally, insurance benefits paid out in between August 2008 and August 2009 in partic- the aftermath of the earthquake in Canterbury ular to push debt growth back down to below the also helped to slow credit growth, at least tem- level of economic growth as a whole. During this porarily: an estimated EUR 1.8bn in insurance period, average variable interest rates on mort- payments entered the banking system, with gage loans fell by almost 4 percentage points. some of these payments presumably being used In New Zealand, the personal debt ratio to reduce outstanding mortgage loans before at the end of last year was down by 3.5 percent- the start of reconstruction work. age points in a year-on-year comparison. House- holds benefited from ongoing income growth – partially bolstered by tax relief measures – and from a relatively steady rise in consumer prices thanks to lower import costs. Households used at least some of the resulting savings, coupled Liabilities’ growth rate declines Debt-to-GDP ratio (lhs) and debt growth (rhs), in % 120 18.0 15.0 90 12.0 60 9.0 Liabilities as % of GDP, Australia 6.0 Liabilities as % of GDP, New Zealand 30 3.0 Growth rate of liabilities, Australia Growth rate of 0 0 liabilities, New Zealand ’01 ’02 ’03 ’04 ’05 ’06 ’07 ’08 ’09 ’10 ’11 Source: Australian Bureau of Statistics, Reserve Bank of New Zealand, Allianz SE.
  • 91.
    Allianz Global WealthReport 2012 Literature 91 Aron, Janine; Muellbauer, John; Prinsloo, Johan: “Estimating the Balance Sheet of the Personal Sec- tor in an Emerging Market Country. South Africa 1975 – 2003”, United Nations University, UN-Wider, Research Paper No. 2006/99, 2006 Ariyapruchaya, Kiatipong: “Thailand’s household sector balance sheet dynamics: evidence from microeconomic and macroeconomic data”, IFC Bulletin, No. 25, p. 91-100, 2007 Attanasio, Orazio and Székely, Miguel: “Household Saving in Developing Countries – Inequality, Demographics and All That: How Different are Latin America and South East Asia?”, Inter-American Development Bank, Working Paper No. 427, 2000 Bricker, Jesse; Bucks, Brian, Kennickell, Arthur; Mach, Traci; Moore, Kevin: “Surveying the Aftermath of the Storm: Changes in Family Finances from 2007 to 2009”, Finance and Economics Discussion Series, Division of Research & Statistics and Monetary Affairs, Federal Reserve Board, Washington, D.C. Davies, James B.; Sandstrom, Susanna; Shorrocks, Anthony; Wolff, Edward N.: “The Level and Distribution of Global Household Wealth”, November 2009. Jalava, Jukka and Kavonius, Ilja Kristian: “Durable Goods and their Effect on Household Saving Ratios in the Euro Area”, European Central Bank, Working Paper Series, No 755, May 2007 Reinhart, Carmen and Plies, William: “Saving in Latin America and Lessons from Europe: An Over- view”. Published in: Carmen M. Reinhart, ed., Accounting for Saving: Financial Liberalization, Capital Flows, and Growth in Latin America and Europe (Washington DC: John Hopkins University Press for the Inter-American Development Bank, 1999) : pp. 3-47 Roxburgh, Charles; Lund, Susan; Wimmer, Tony; Amar, Eric; Atkins, Charles; Kwek, Ju-Hon; Dobbs, Richard; Manyika, James: “Debt and Deleveraging: The Global Credit Bubble and its Economic Consequences”, McKinsey Global Institute, January 2010 Schmitt-Hebbel, Webb, and Corsetti: “Household Saving in Developing Countries: First Class-Cross Country Evidence”, The World Bank Economic Review, Vol. 6, No. 3, 1992 Shanghai Stock Exchange: Factbook 2010. Thorne, Susie and Cropp, Jill: “Household Saving in Australia”, Australian Treasury, Domestic Economy Division, 2008 Thorp, Clive and Ung, Bun: “Recent Trends in Household Financial Assets and Liabilities”, Reserve Bank of New Zealand: Bulletin Vol. 64 No. 2, 2000 Tiongson, Erwin R.; Sugawara, Naotaka; Sulla, Victor; Taylor, Ashley; Gueorguieva, Anna I.; Levin, Victoria; Subbarao, Kalanidhi: “The Crisis hits Home: Stress-Testing Households in Europe and Central Asia”, The International Bank for Reconstruction and Development / The World Bank, 2010 Torche, Florencia and Spilerman, Seymour: “Household Wealth in Latin America”, United Nations University, UN-Wider, Research Paper No. 2006/114, October 2006 United Nations, ECLAC: “Social Panorama of Latin America 2010 · Briefing Paper” Wieland, Dr. Carsten: “Kolumbien auf dem Weg zur Sozialen Marktwirtschaft?”, Konrad Adenauer Stiftung, April 2008.
  • 92.
    Foreword . Summary. Development of global financial assets . How global financial assets are distributed . Regional differences . Literature . Appendix Appendix A: Methodological comments 92 General assumptions The Allianz Global Wealth Report is based on data from 52 countries. This group of countries covers almost 93% of global GDP and around 69% of the global population. In 41 countries, we had access to statistics from national wealth balance sheets. In the other countries, we were able to estimate the vol- ume of total financial assets based on information from household surveys, bank statistics, statistics on assets held in equities and bonds, and technical reserves. In many countries, it is still extremely difficult to find data on the financial assets of private house- holds. Let’s take the Latin American countries as an example. For many of these countries, the only information that can be found relates to the entire private sector or the economy as a whole, which is often of only limited use as far as the situation of private households is concerned. In addition to Mexico, other countries with fairly good data that can be used to analyze the financial structure of private household assets are Chile and Colombia. In Argentina, for example, we were able to estimate financial assets with the help of data on bank deposits and insurance reserves. In order to rule out exchange rate distortions over time, the financial assets were converted into the national currency based on the fixed exchange rate at the end of 2011. Determination of wealth bands for middle wealth countries (MWC) Lower wealth threshold: there is a close link between financial assets and the incomes of private house- holds. According to Davies et al., private individuals with below-average income tend to have no assets at all, or only very few. It is only when individuals move into middle and higher income groups that they start to accumulate any assets to speak of. We have applied this link to our country analysis. Countries in the upper-middle income bracket (based on the World Bank’s country classification system) therefore form the group in which the average as- sets of private households has reached a relevant volume for the first time. This value marks the lower threshold for middle wealth countries. How high should this value be?
  • 93.
    Allianz Global WealthReport 2012 93 In terms of income, households with incomes that correspond to between 75% and 150% of average net income are generally considered to constitute the middle class. According to Davies et al., households with income corresponding to 75% of the average income have assets that correspond to 30% of the average assets. As far as the upper threshold is concerned, 150% of average income corresponds to 180% of average assets. Consequently, we have set the threshold values for the wealth middle class at 30% and 180% of average per capital assets. If we use net financial assets to calculate the two thresholds, we arrive at an asset range of between EUR 4,500 and EUR 26,800 for 2011. The gross thresholds lie at EUR 6,400 and EUR 38,700. Countries with higher per capita financial assets are then classed as HWCs (high wealth countries). Countries with lower per capita financial assets are the LWCs (low wealth countries). HWC MWC LWC Australia* Chile* Argentina*** Austria* Croatia** Brazil*** Belgium* Czech Republic* Bulgaria** Canada* Estonia** China** Denmark* Finland* Colombia*** France* Greece* India*** Germany* Hungary* Indonesia*** Israel** Ireland* Kazakhstan*** Italy* Malaysia** Latvia* Japan* Mexico** Lithuania* Netherlands* Norway* New Zealand* Singapore** Portugal* Peru** Sweden* Romania** Poland* Switzerland** Slovenia* Russia*** Taiwan** South Korea* Slovakia* United Kingdom* Spain* South Africa*** USA* Thailand*** Turkey*** Ukraine*** *2011 asset balance sheet **Extrapolation based on 2010 asset balance sheet ***Approximated based on other statistics
  • 94.
    Foreword . Summary. Development of global financial assets . How global financial assets are distributed . Regional differences . Literature . Appendix 94
  • 95.
    Gross financial Net financialGlobal Wealth Report 2012 Allianz Appendix B: assets assets GDP Financial assets by country Global share, in % in EUR bn 2011, yoy in % EUR per capita EUR per capita EUR per capita USA 37.46 38,693 1.7 123,586 90,417 37,093 Japan 15.07 15,572 -0.4 123,099 93,087 37,075 95 China 6.27 6,480 7.0 4,809 3,573 4,047 United Kingdom 4.96 5,128 -0.4 82,162 52,600 28,916 Germany 4.56 4,715 1.2 57,384 38,521 31,289 France 3.87 4,002 -0.2 63,392 42,643 31,620 Italy 3.44 3,549 -3.1 58,380 42,875 25,995 Canada 3.18 3,281 -0.5 95,530 59,913 37,852 Australia 2.04 2,110 0.5 93,359 37,330 50,371 Netherlands 1.77 1,832 3.6 109,943 61,315 36,130 Spain 1.66 1,716 -3.5 36,944 16,875 23,106 Switzerland 1.60 1,654 2.5 214,794 138,062 60,417 Taiwan 1.59 1,646 2.1 70,938 60,893 15,086 South Korea 1.49 1,540 5.3 31,829 16,581 17,095 Brazil 1.25 1,287 12.7 6,545 2,981 8,701 Belgium 0.91 940 4.4 87,455 68,491 34,310 India 0.87 895 18.1 721 643 1,041 Mexico 0.74 768 4.7 6,688 5,753 6,895 Sweden 0.71 736 -2.4 77,962 42,104 41,600 Denmark 0.61 632 2.9 113,463 49,220 43,133 Austria 0.49 509 0.0 60,509 40,648 35,813 Israel 0.47 482 -2.2 63,695 51,562 23,184 Singapore 0.42 435 5.5 83,911 58,215 37,427 Portugal 0.37 384 -3.3 35,953 19,572 15,998 Russia 0.35 366 17.9 2,566 1,549 9,164 Malaysia 0.35 364 8.4 12,629 7,130 7,180 Norway 0.35 357 3.4 72,589 6,508 71,045 Ireland 0.29 300 0.5 66,252 25,461 34,566 Poland 0.28 285 5.7 7,434 4,153 8,919 Greece 0.24 244 -9.1 21,379 8,830 18,884 Thailand 0.23 237 3.0 3,405 2,340 3,702 Finland 0.22 232 -3.5 43,042 19,105 35,576 Chile 0.22 228 5.2 13,197 9,459 10,325 Turkey 0.21 221 13.0 2,998 1,659 7,172 Indonesia 0.20 209 25.8 863 467 2,604 South Africa 0.17 176 7.3 3,486 1,260 5,605 Czech Rep. 0.15 151 6.0 14,353 9,408 14,179 Romania 0.14 147 2.4 6,856 5,343 6,240 Colombia 0.13 132 14.6 2,808 1,558 5,025 New Zealand 0.13 131 3.9 29,745 4,437 27,838 Hungary 0.08 88 -5.6 8,798 5,224 8,975 Argentina 0.07 70 24.4 1,722 1,167 8,087 Peru 0.07 70 0.9 2,375 1,931 4,295 Ukraine 0.06 60 6.0 1,329 928 2,802 Slovakia 0.04 45 8.1 8,156 1,938 12,621 Croatia 0.04 43 -6.4 9,724 5,482 10,323 Slovenia 0.04 41 -1.7 20,197 14,049 17,519 Bulgaria 0.03 36 0.0 4,806 3,191 5,168 Lithuania 0.02 24 11.9 7,349 4,089 9,285 Kazakhstan 0.02 22 20.9 1,355 539 8,594 Estonia 0.02 21 5.4 15,540 9,672 11,919 Latvia 0.01 12 3.9 5,290 1,392 9,025 World 103,299 21,493 14,881
  • 97.
    Imprint Publisher Allianz SE Economic Research& Corporate Development Königinstraße 28 80802 Munich www.allianz.com Chief Economist Dr. Michael Heise Authors Kathrin Brandmeir Dr. Michaela Grimm Dr. Arne Holzhausen Gabriele Steck Editors Heike Bähr Alexander Maisner Dr. Lorenz Weimann Photos Helge Mundt Design Schmitt. Kommunikation, Hamburg Closing date 31. July 2012 Legal disclaimer The information contained in this publication has been carefully researched and checked by Allianz SE or reliable third parties. However, Allianz Group and any third party do not assume liability for the accuracy, completeness and up-to-dateness of the contents. The authors’ opinions are not necessarily those of Allianz SE. Statements do not constitute any offer or recommendation of certain investments, even if individual issuers and securities are mentioned. Information given in this issue is no substitute for specific investment advice based on the situation of the individual investor. For personalized investment advice please contact Allianz SE.
  • 98.
    Foreword . Summary. Development of global financial assets . How global financial assets are distributed . Regional differences . Literature . Appendix 98