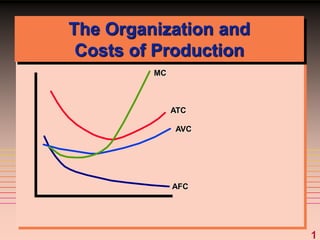
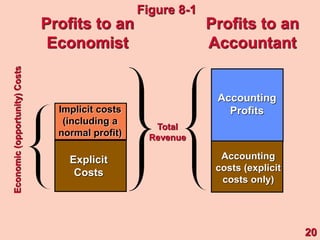
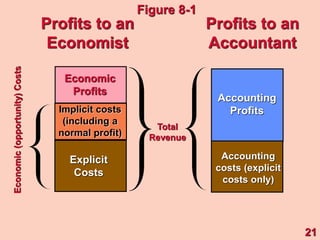
The document discusses key concepts related to a firm's production costs, including:
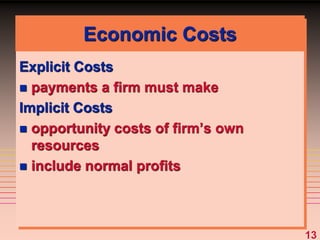
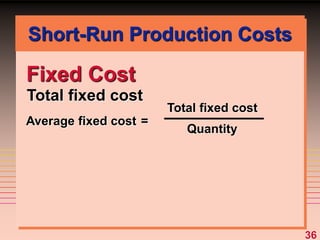
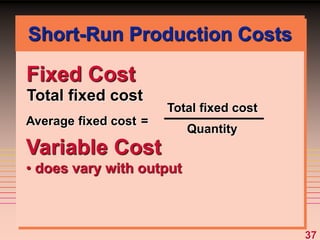
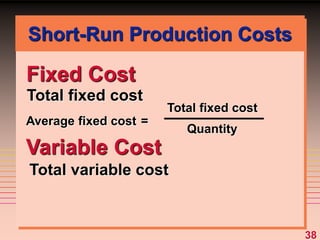
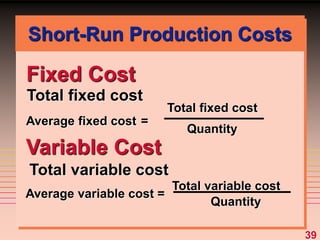
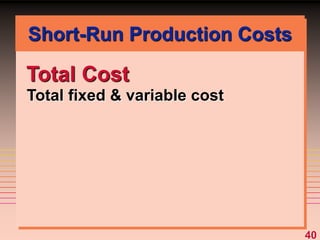
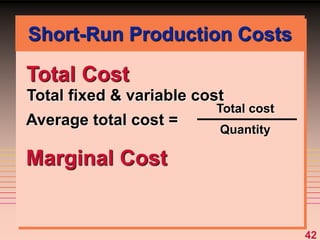
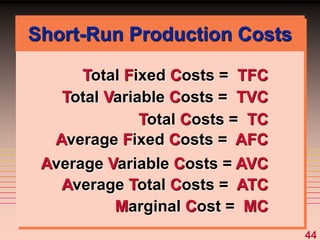
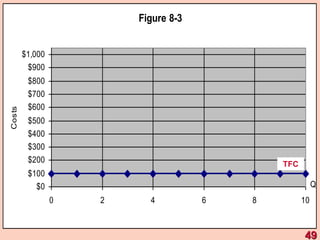
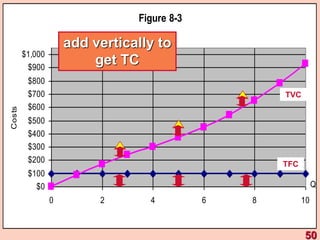
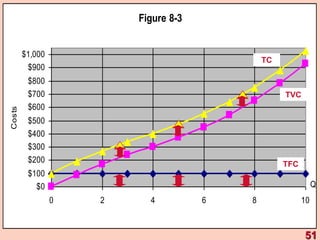
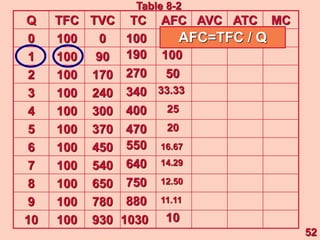
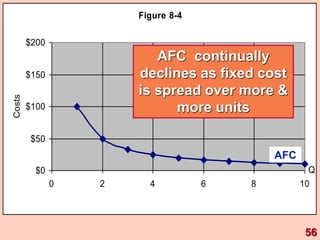
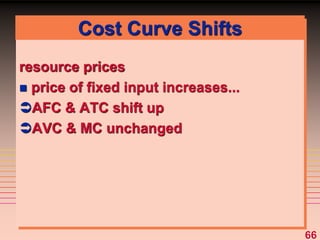
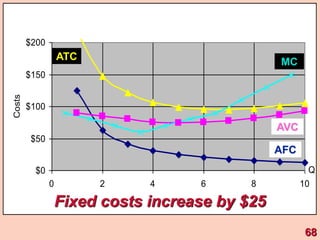
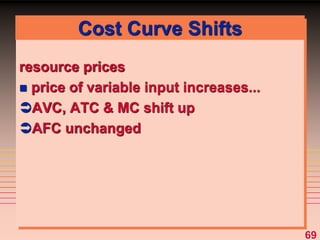
1) It defines different types of costs such as fixed costs, variable costs, total costs, average costs and marginal costs. Fixed costs do not vary with output, while variable costs do.
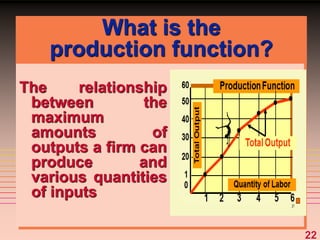
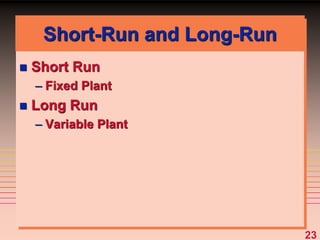
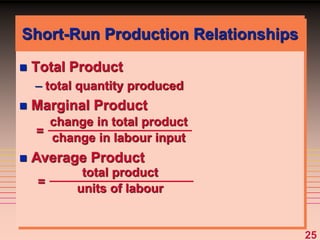
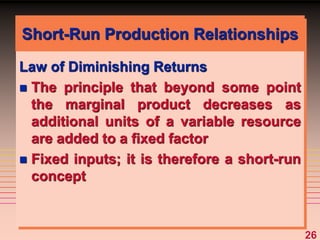
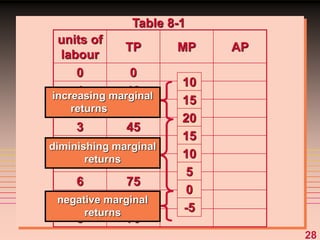
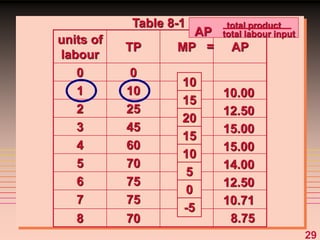
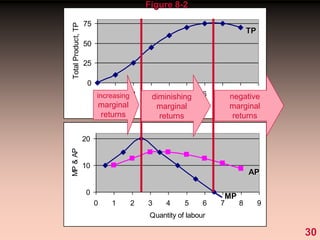
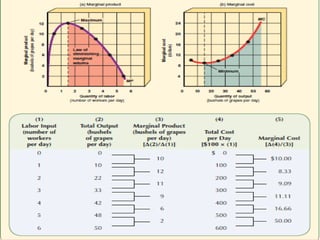
2) It explains short-run production relationships, diminishing marginal returns, and the law of diminishing returns.
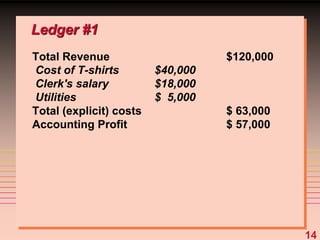
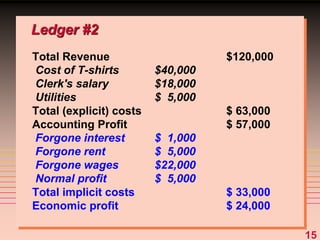
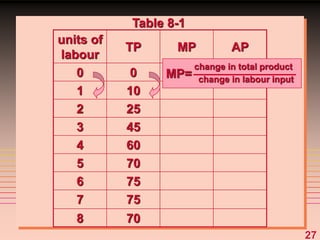
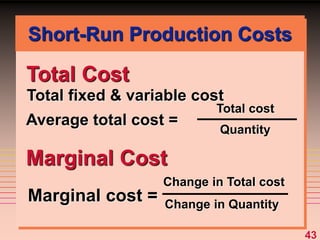
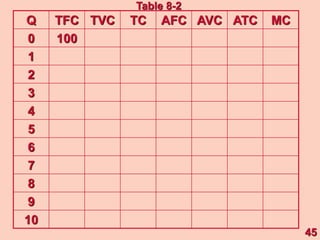
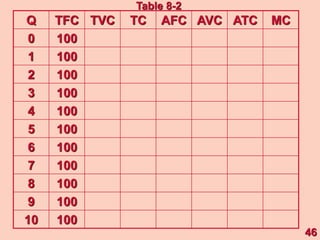
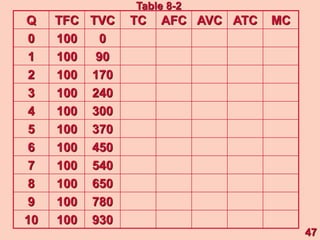
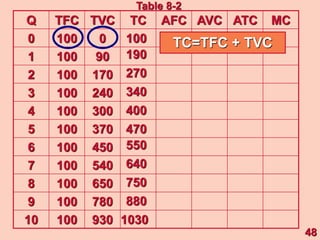
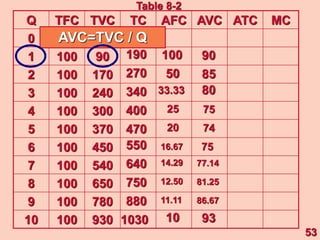
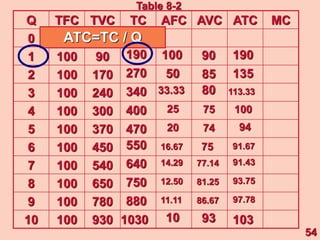
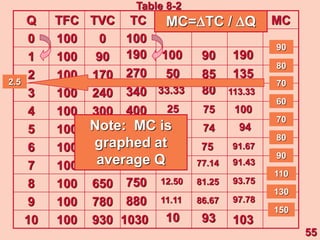
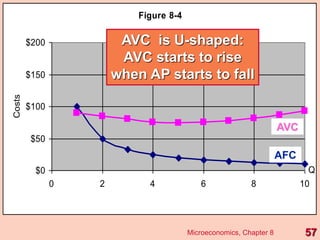
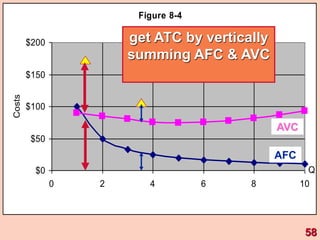
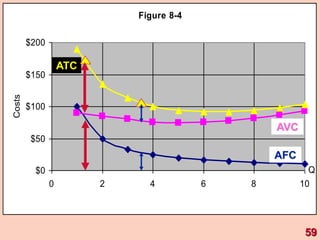
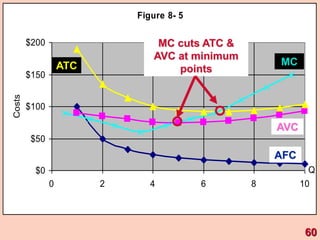
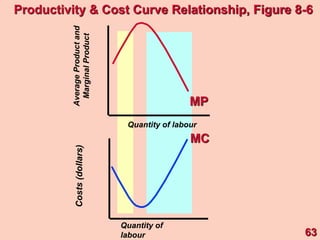
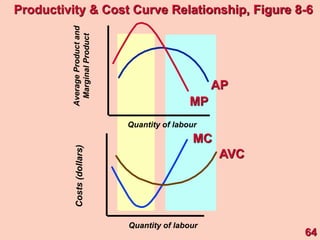
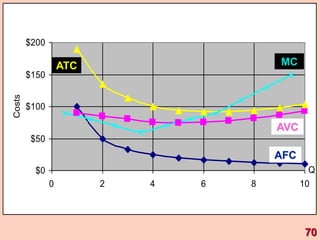
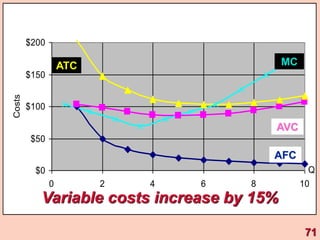
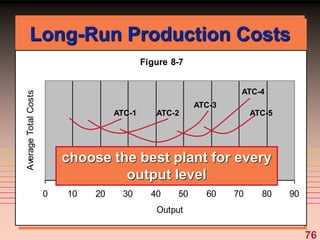
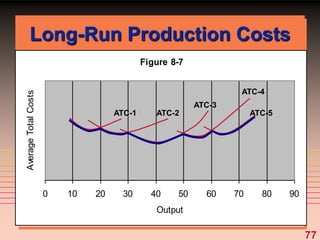
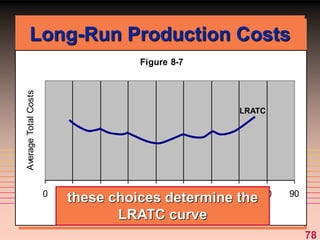
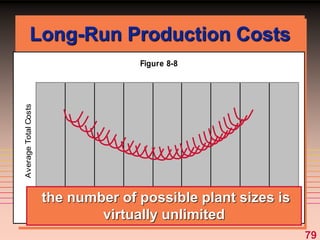
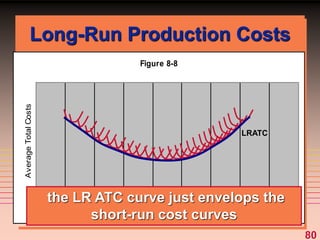
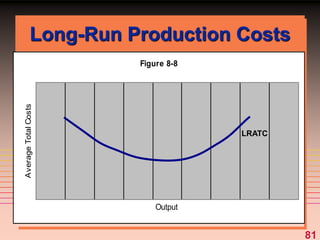
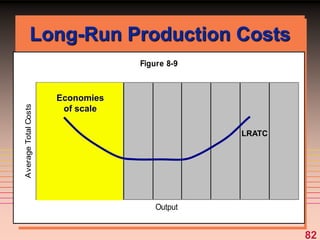
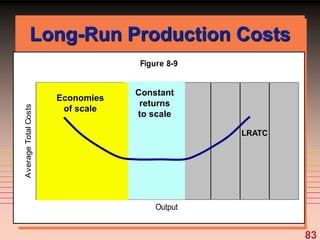
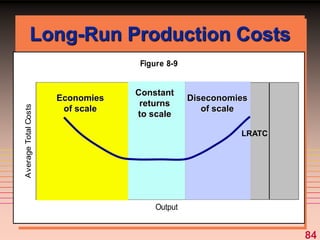
3) It provides an example table and figures to illustrate how total, average, and marginal costs change as production quantity changes in the short-run. Marginal cost is the change in total cost from a one-unit change in output.
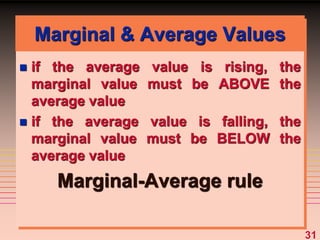
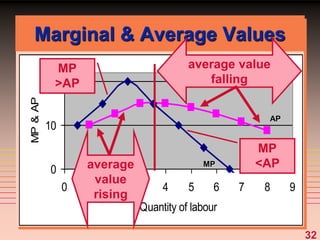
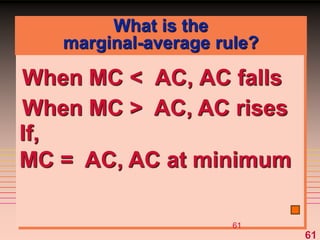
4) The marginal-average rule states that average costs will fall