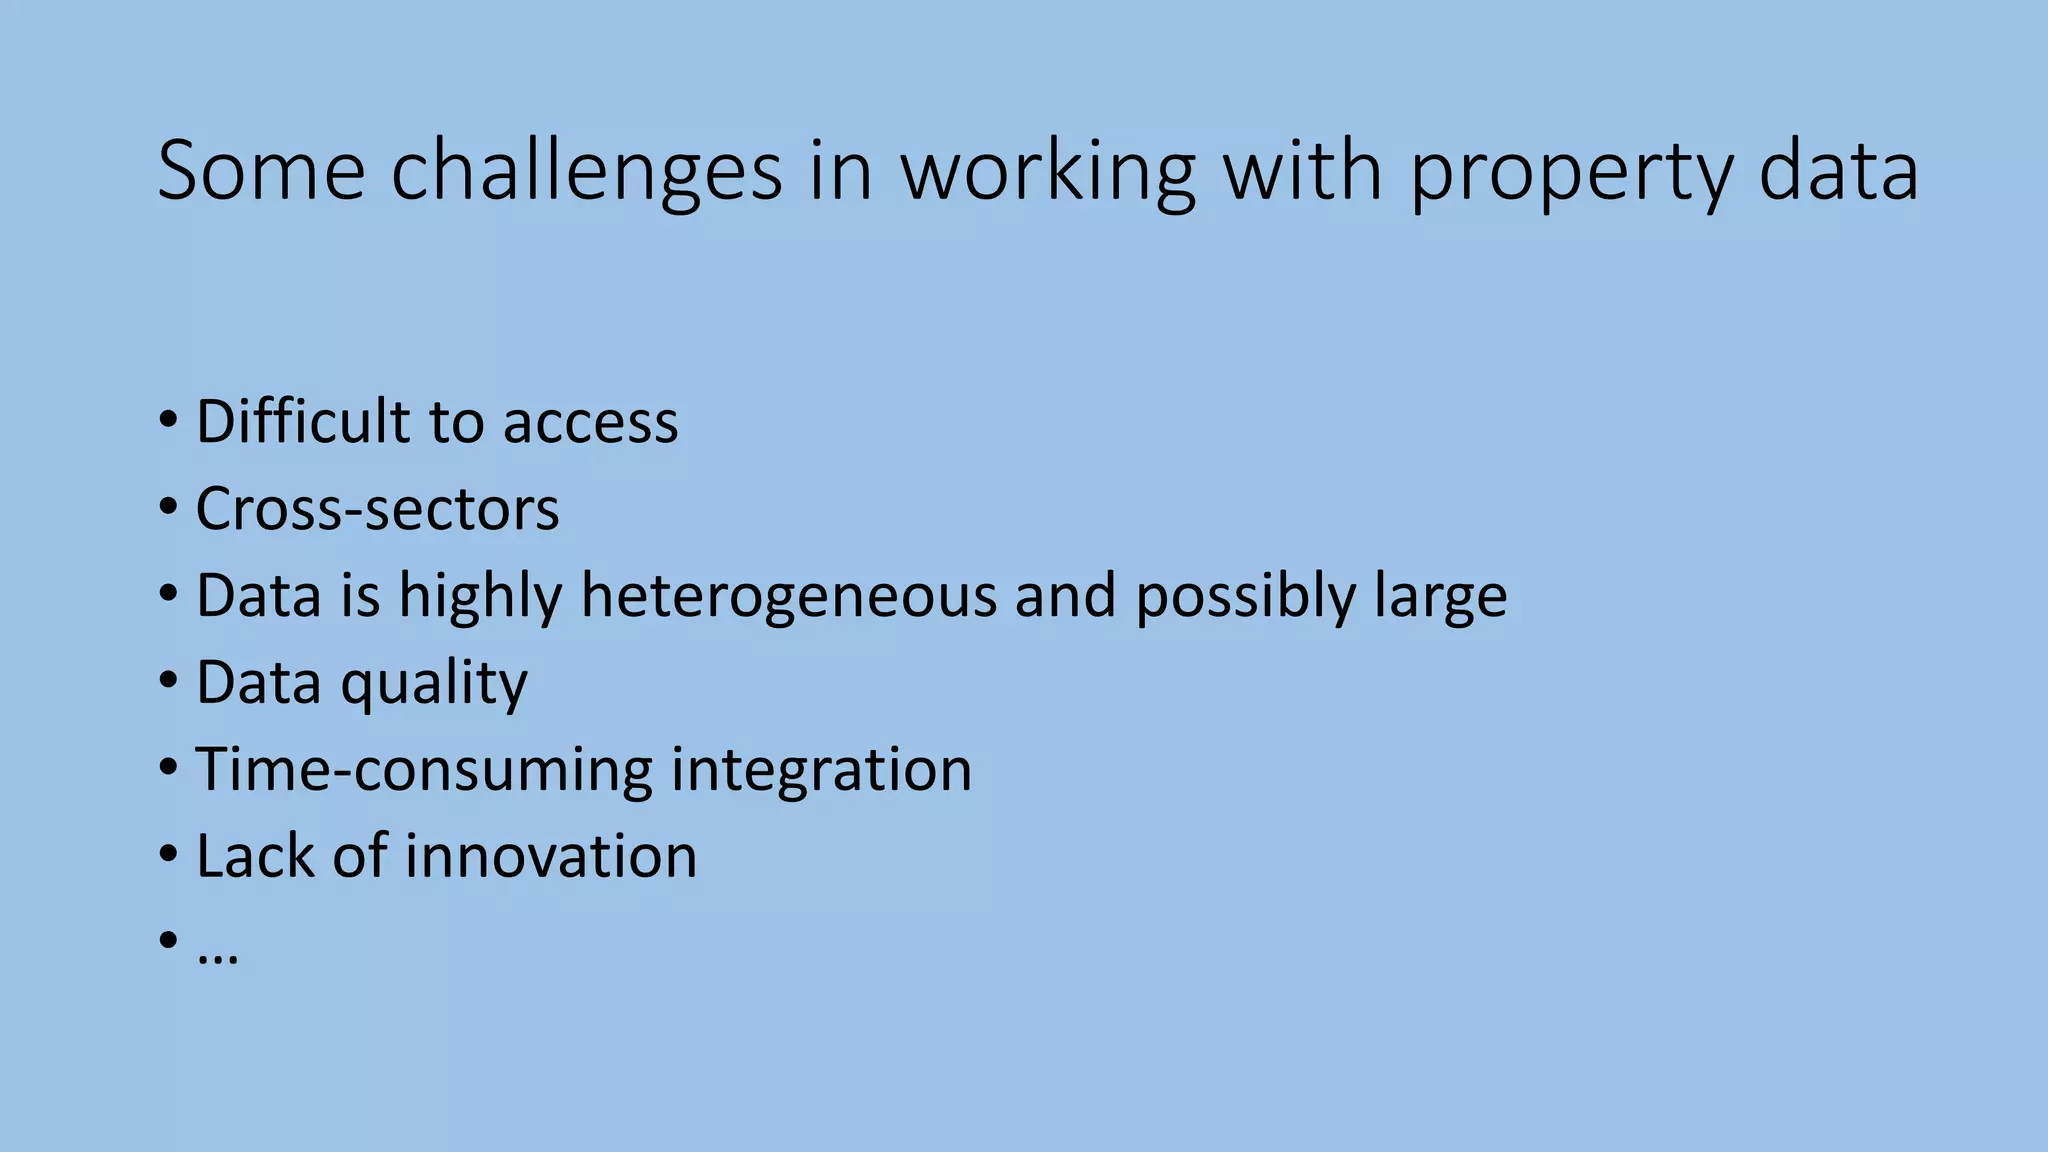
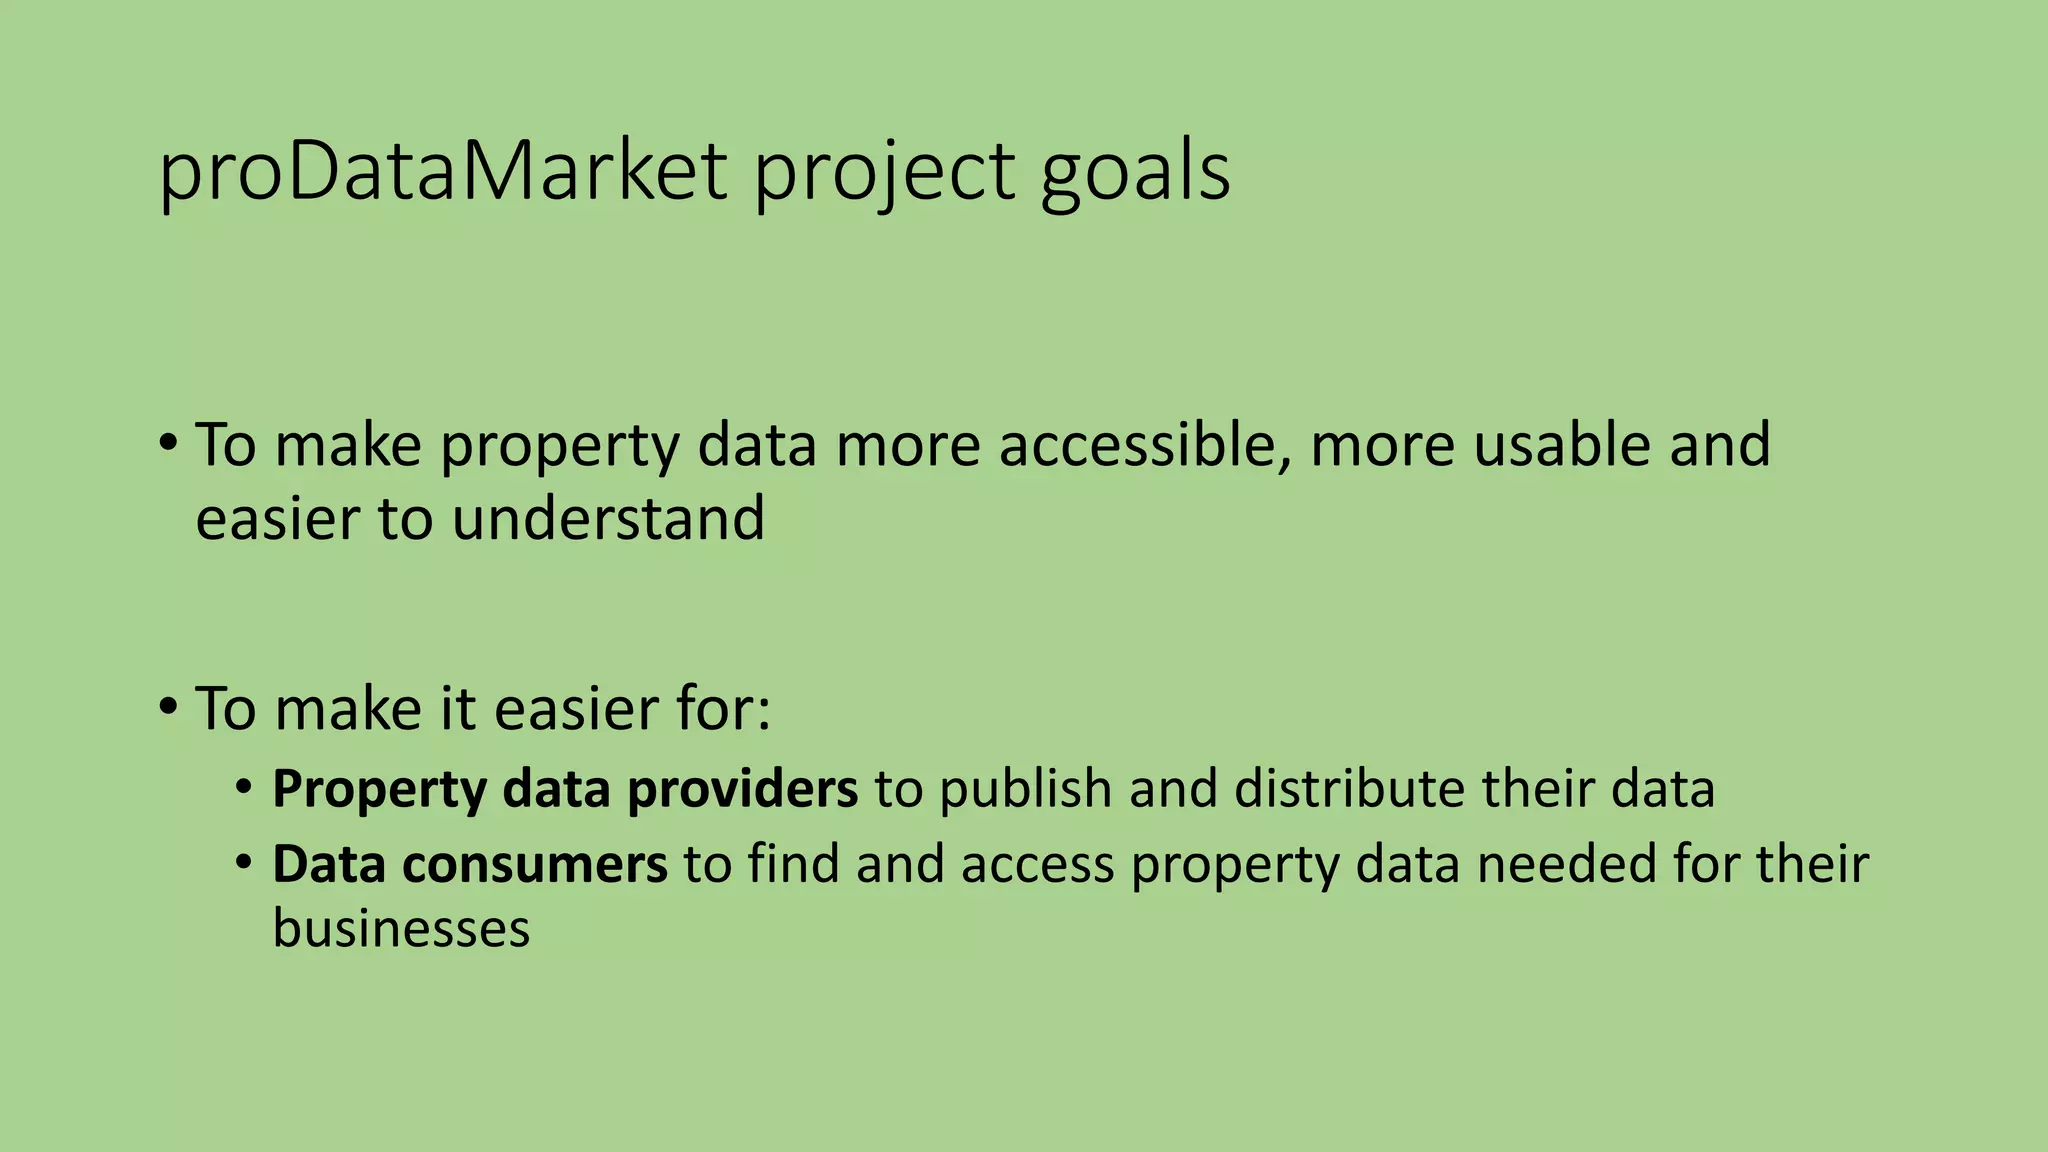
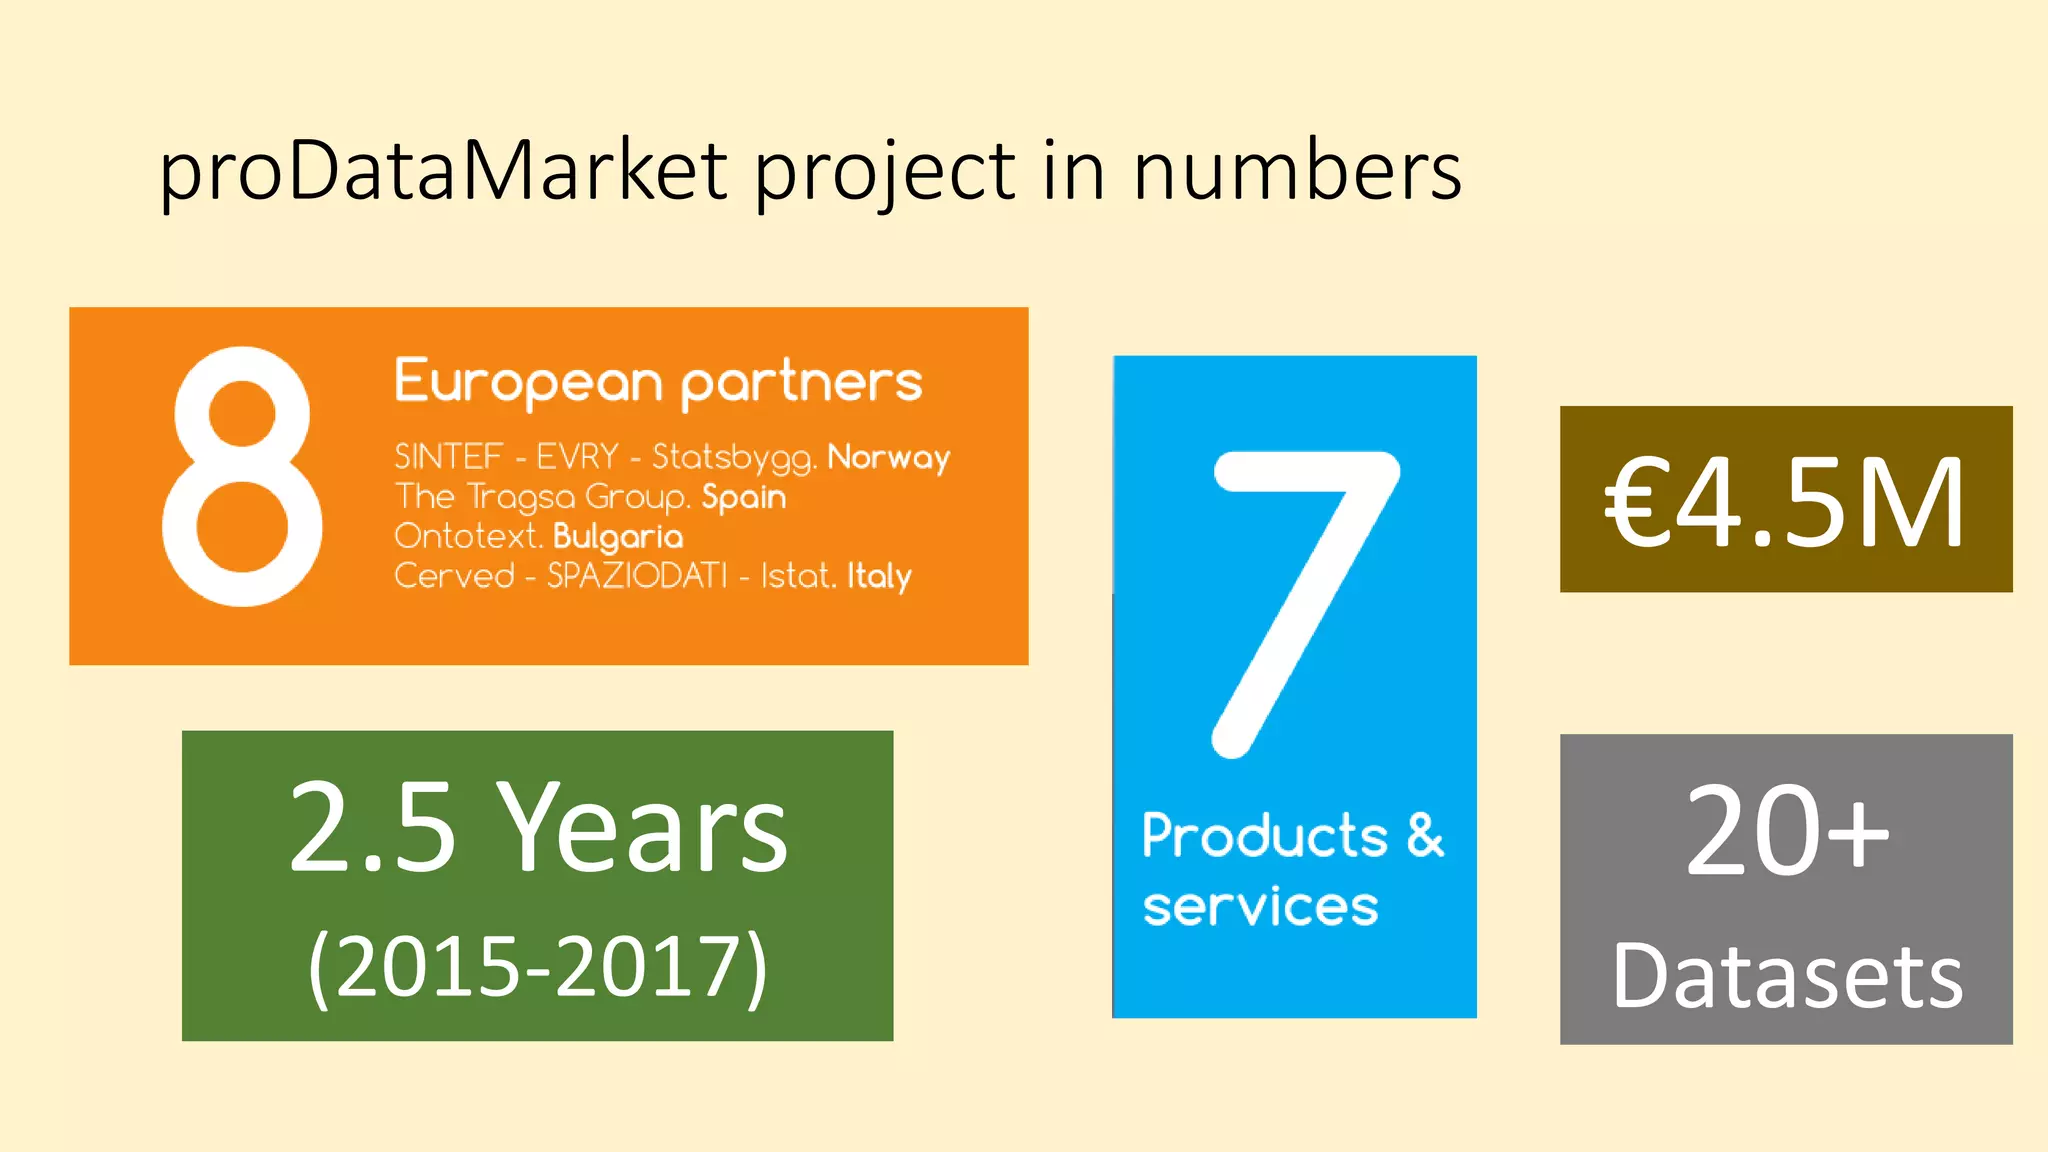
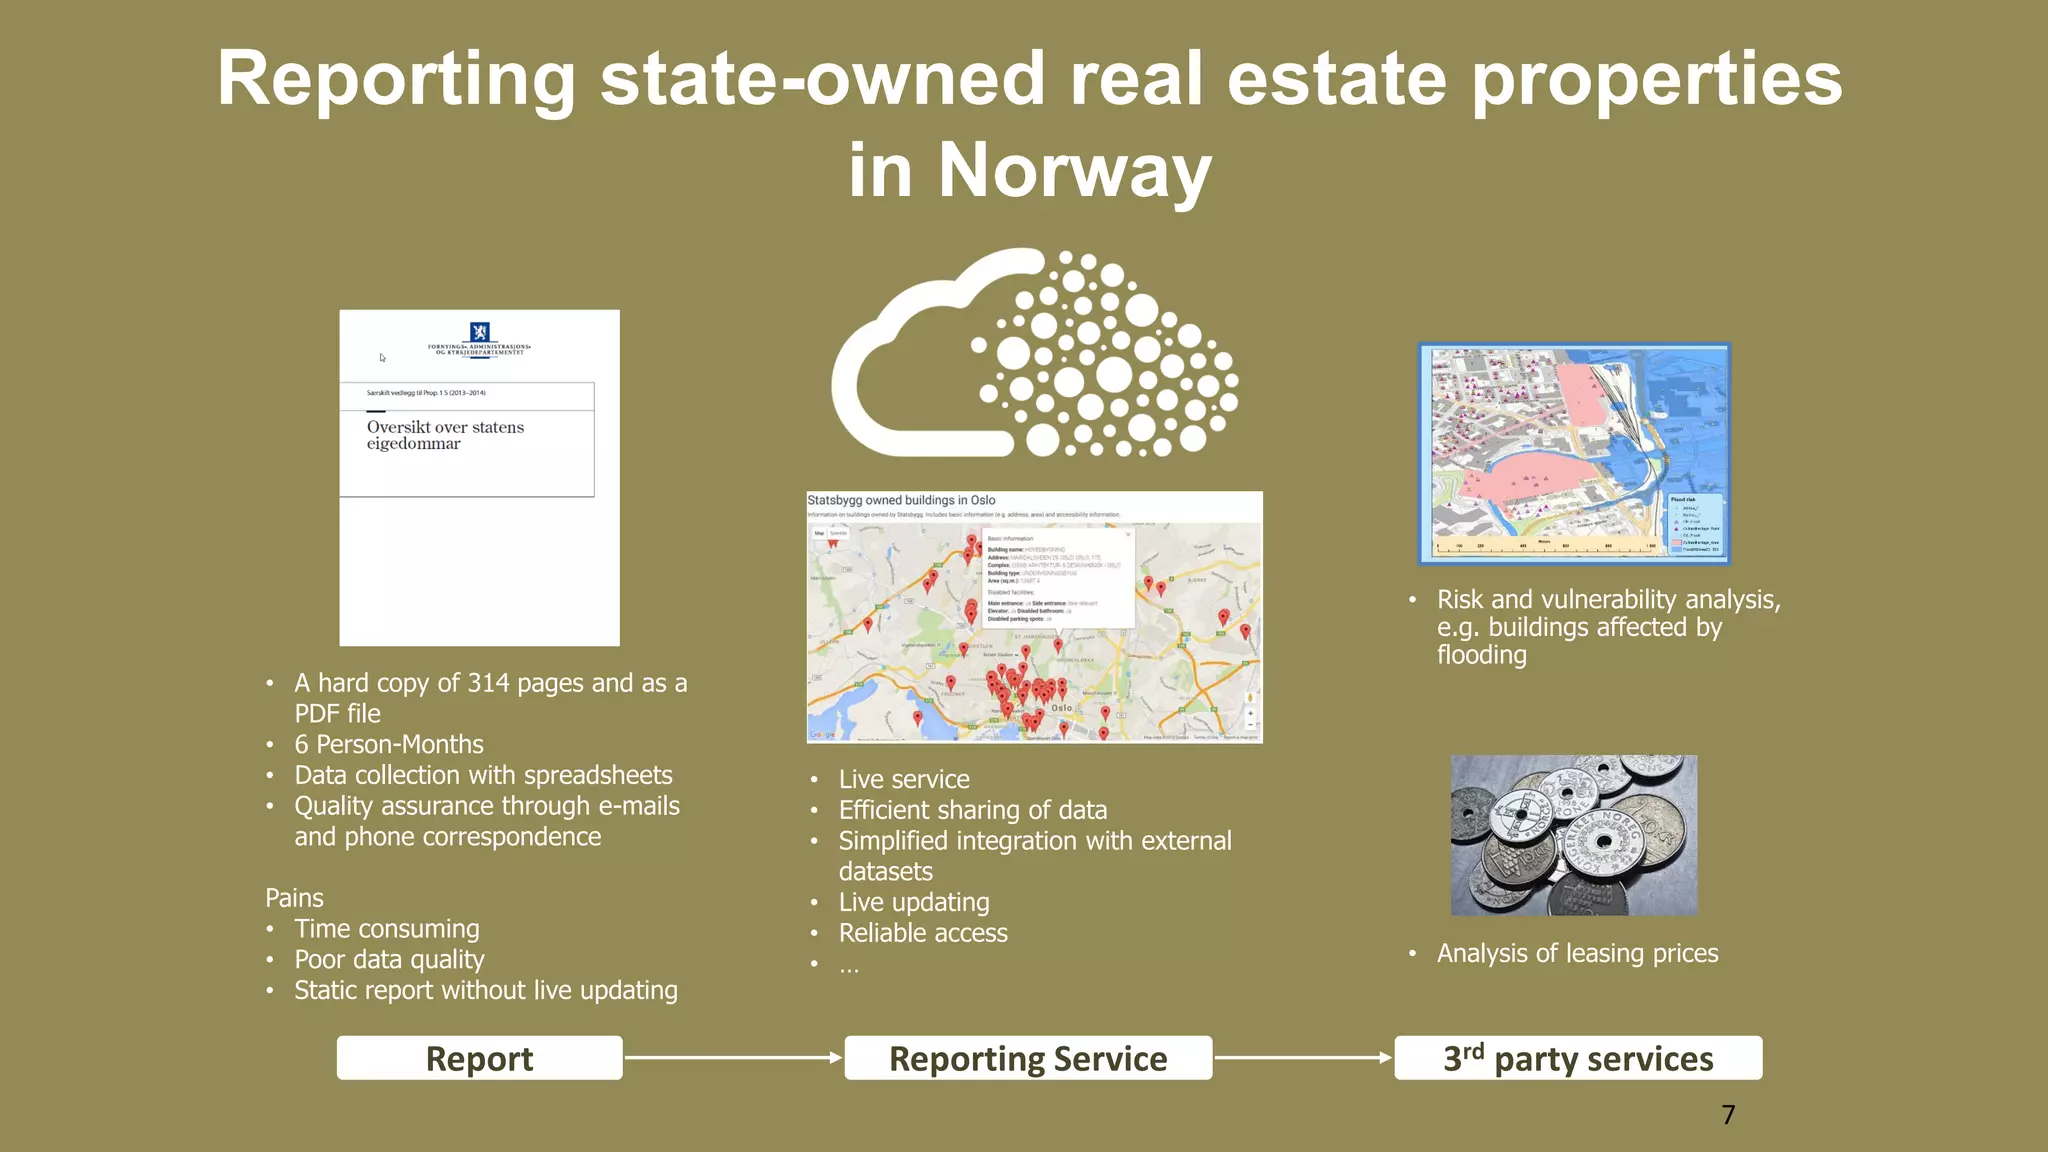
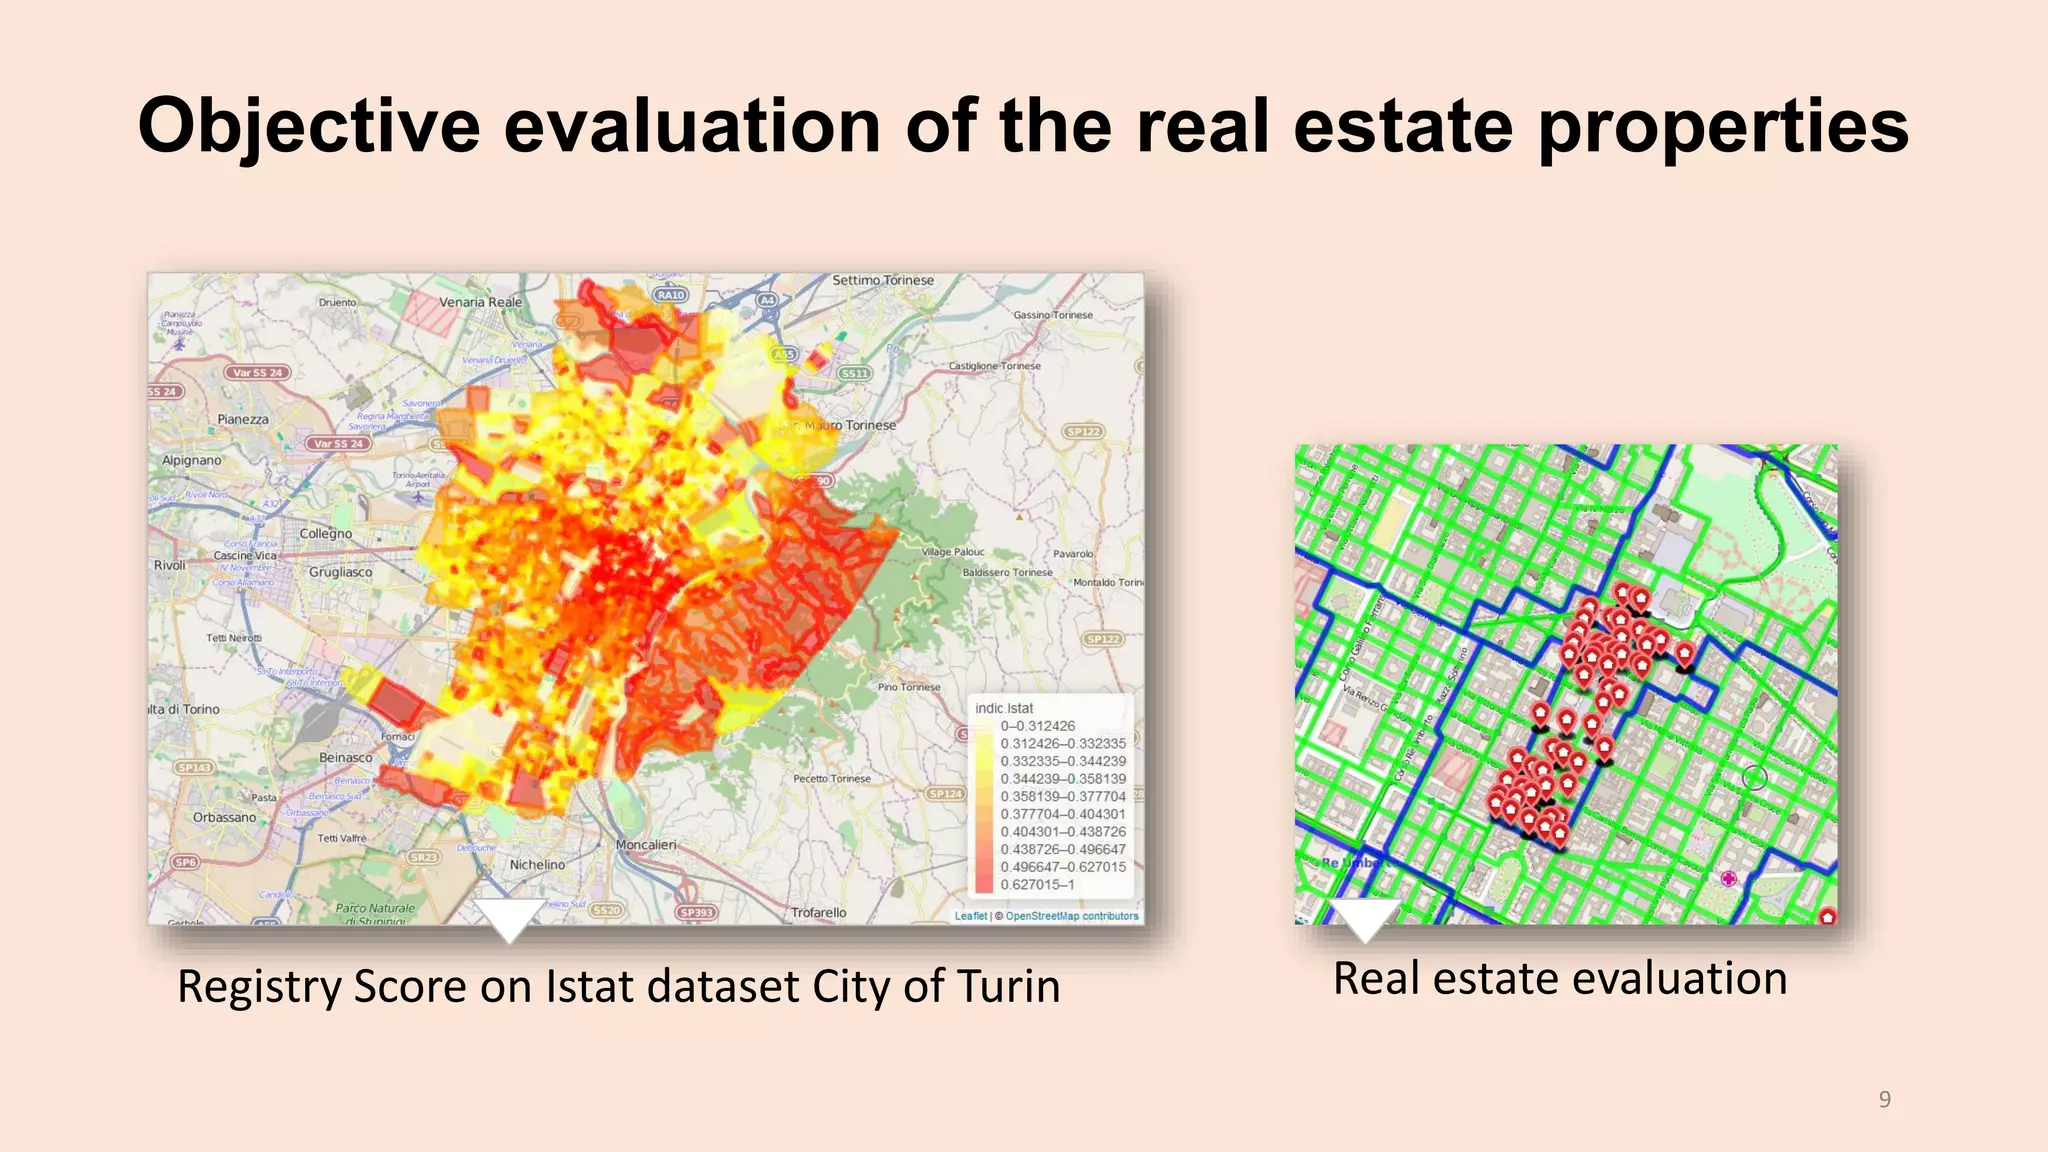
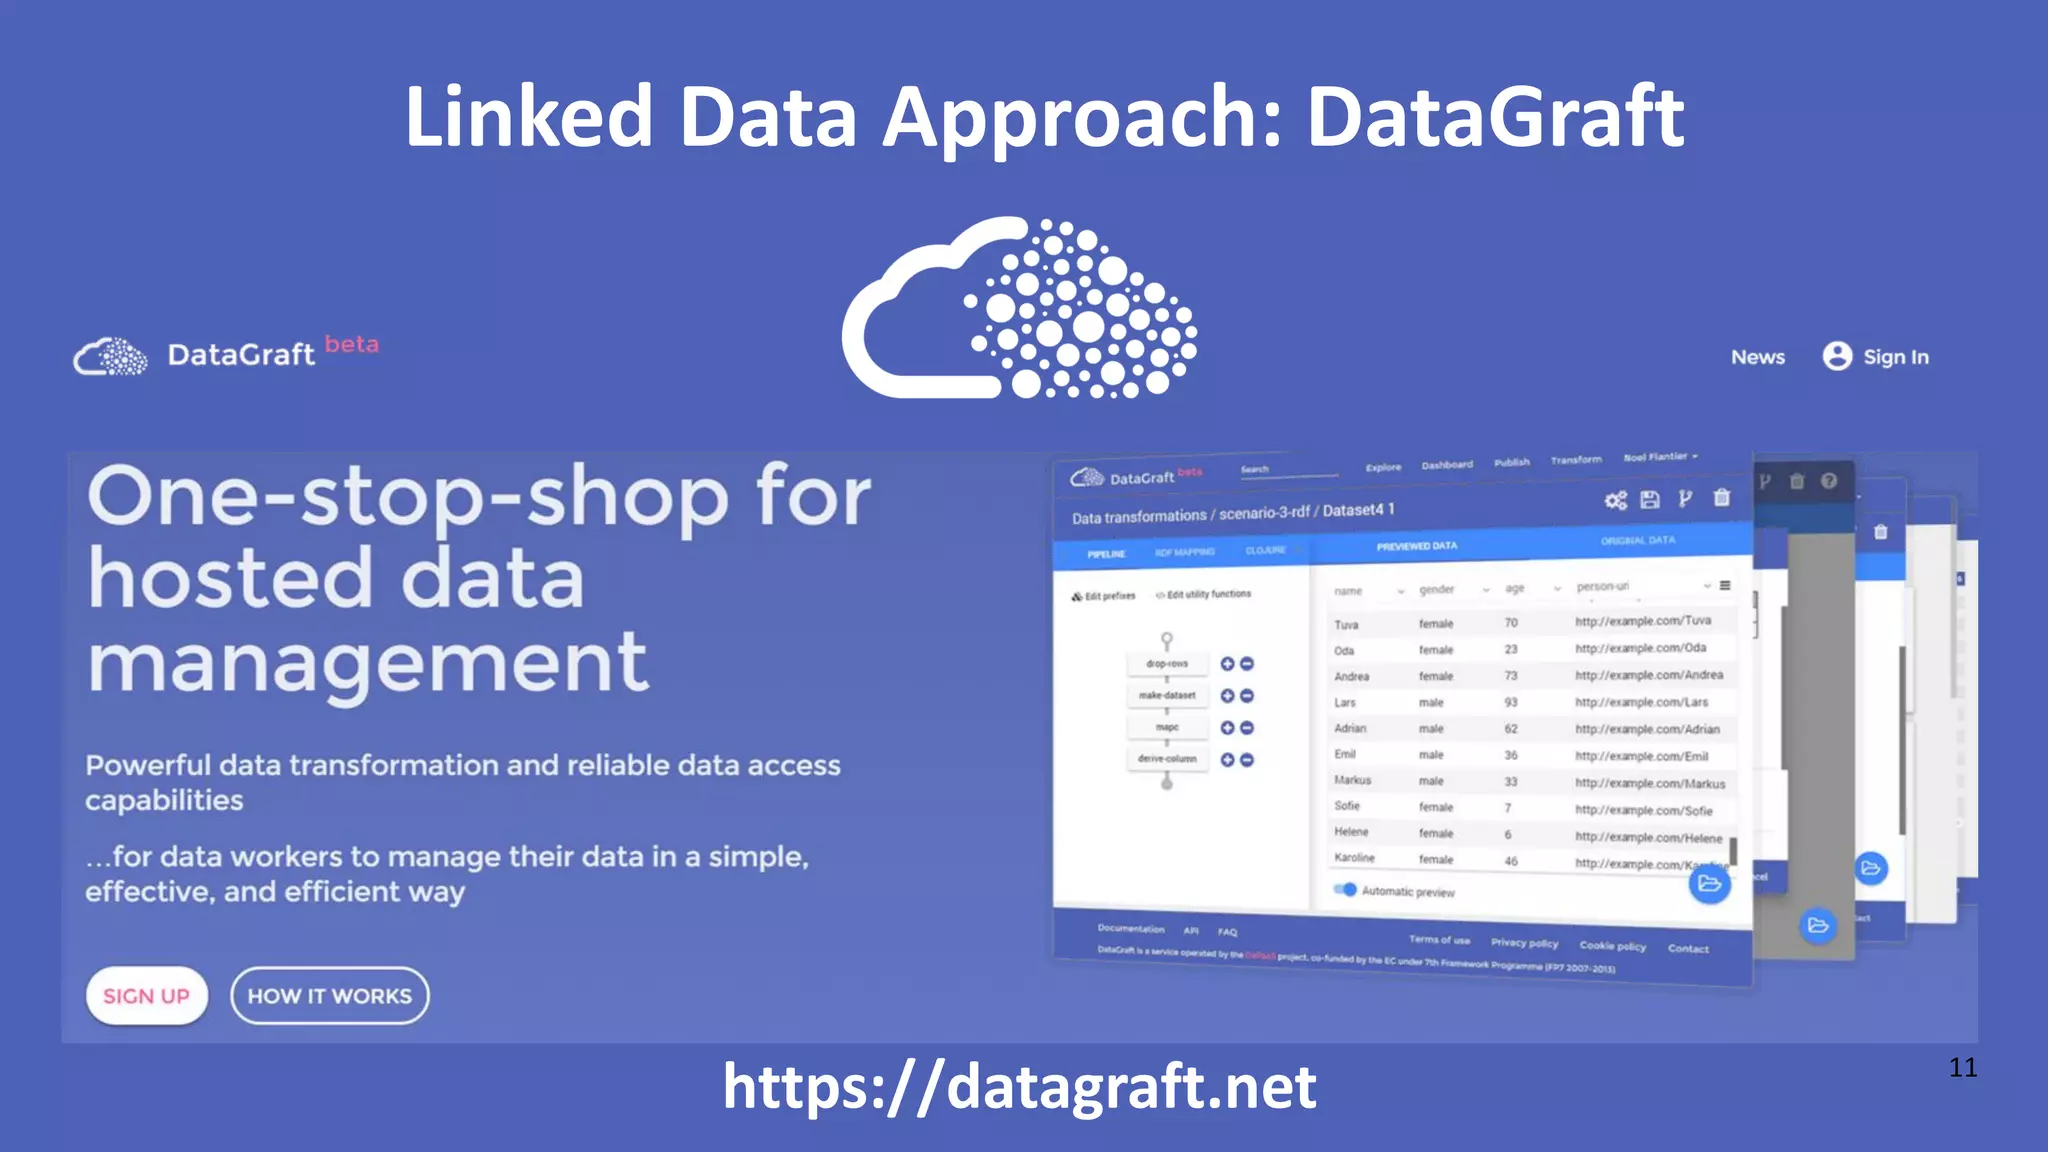
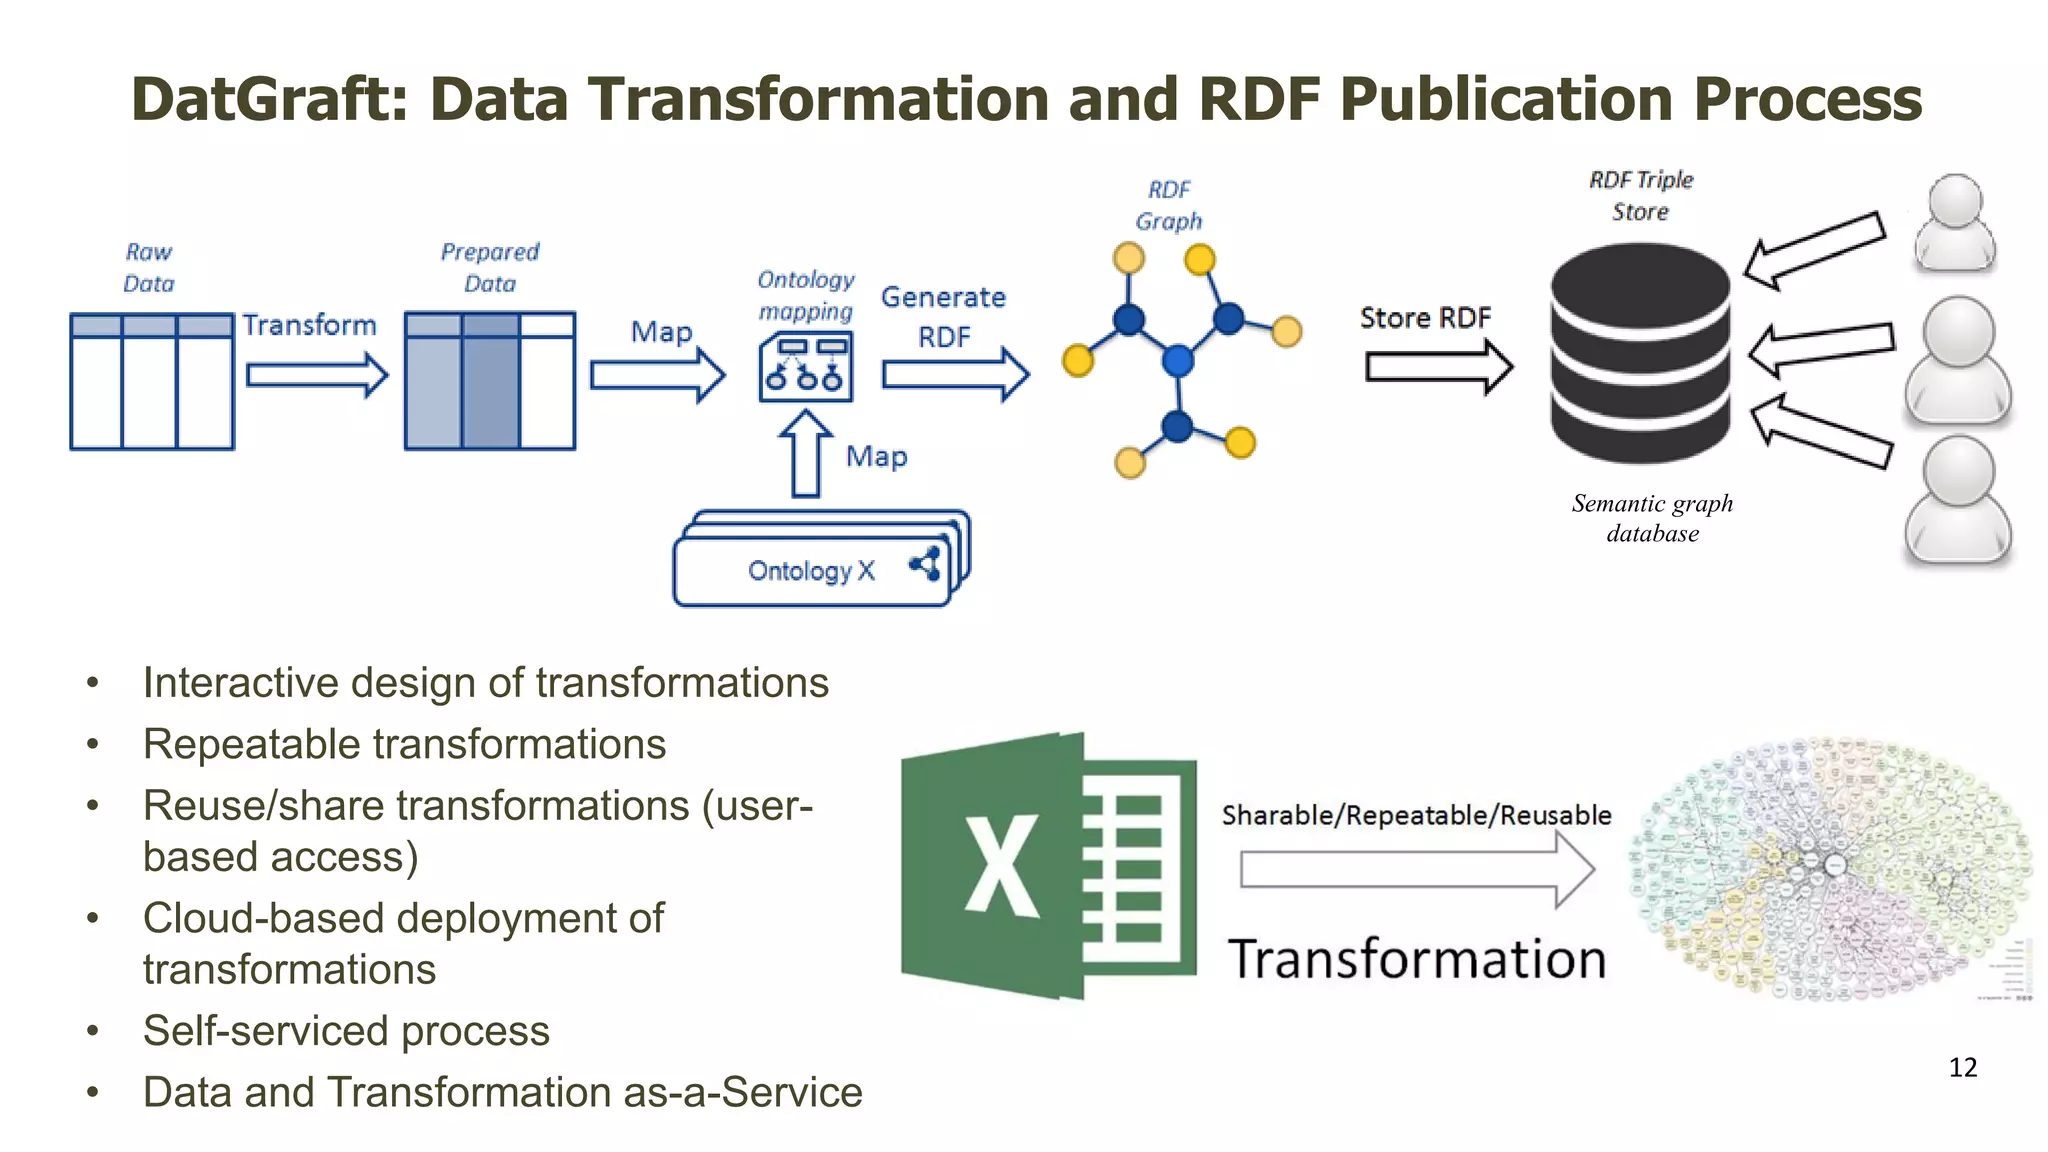
Presentation at the "Spatial Data on The Web" event, 10th of February 2016, Amersfoort, The Netherlands
http://www.pilod.nl/wiki/Geodata_on_The_Web_Event_10_February_2016
Industry@RuleML2015: Norwegian State of Estate A Reporting Service for the St...RuleML
Data distribution
•Public and private
•Data complexity
•Rich in attributes and location based
•Time dimension
•Example of data model from the Norwegian Mapping Authority
RuleML2015: Norwegian State of Estate: A Reporting Service for the State-Owne...RuleML
Statsbygg is the public sector administration company responsible for
reporting the state-owned property data in Norway. Traditionally the reporting
process has been resource-demanding and error-prone. The State of Estate
(SoE) business case presented in this paper is creating a new reporting service
by sharing, integrating and utilizing cross-sectorial property data, aiming to increase
the transparency and accessibility of property data from public sectors
enabling downstream innovation. This paper explains the ambitions of the SoE
business case, highlights the technical challenges related to data integration and
data quality, data sharing and analysis, discusses the current solution and potential
use of rules technologies.
BDE-SC6 Hangout - “Insight into Virtual Currency Ecosystems”BigData_Europe
Third SC6 webinar was held on 16 February 2017. It was organised by the Consortium of Social Science Data Archives (CESSDA) from Norway and the Semantic Web Company (SWC) from Austria. Theme of the webinar was “Insight into Virtual Currency Ecosystems” presented by Dr. Bernhard Haslhofer, Data Scientist at the Austrian Institute of Technology.
EDF2014: Franck Cotton & Kamel Gadouche, France: TeraLab - A Secure Big Data...European Data Forum
Selected Talk of Franck Cotton, Technology Advisor, Institut National de la Statistique et des Etudes Economiques, France & Kamel Gadouche, Director, Centre d'Accès Sécurisé aux Données / Groupe des Ecoles Nationales d'Economie et Statistique, France at the European Data Forum 2014, 19 March 2014 in Athens, Greece: TeraLab - A Secure Big Data Platform, Description And Use Cases
"FENIX platform OVERVIEW OF THE NEW SOFTWARE PLATFORM AND SYSTEM SETUP"FAO
"http://www.countrystat.org
What is FENIX?
A collection of software tools, methods and standards to facilitate acquisition, management and analysis of large, diversified and distributed sets of data."
Big Data Europe: SC6 Workshop 3: The European Research Data Landscape: Opport...BigData_Europe
Slides of the keynote at the 3rd Big Data Europe SC6 Workshop co-located at SEMANTiCS2018 in Amsterdam (NL) on: The European Research Data Landscape: Opportunities for CESSDA by Peter Doorn, Director DANS, Chair, Science Europe W.G. on Research Data. Chair, CESSDA ERIC General Assembly
Big Data Europe SC6 WS #3: PILOT SC6: CITIZEN BUDGET ON MUNICIPAL LEVEL, Mart...BigData_Europe
Presentation at the Big Data Europe SC6 workshop #3 on 11.9.2017 in Amsterdam co-located with SEMANTiCS2017 conference: BDE PIlot Societal Challenge 6: CITIZEN BUDGET ON MUNICIPAL LEVEL by Martin Kaltenboeck (Semantic Web Company, SWC).
The event presents real-life examples from European organisations that have used the Rulebook for Fair Data Economy to develop data-driven business. The online event was organised on 3 March 2021 by Sitra.
Presentations:
- Jaana Sinipuro, Sitra
- Olli Pitkänen, 1001 Lakes
- Marko Turpeinen, 1001 Lakes
- Lars Nagel, International Data Spaces Association
- Cátia Pinto, Serviços Partilhados do Ministério da Saúde
- Matthias De Bièvre, aNewGovernance
7th International Conference on Data Mining and Database (DMDB 2020)ijdms
7th International Conference on Data Mining and Database (DMDB 2020) provides a forum for researchers who address this issue and to present their work in a peer-reviewed forum. Authors are solicited to contribute to the conference by submitting articles that illustrate research results, projects, surveying works and industrial experiences that describe significant advances in the following areas, but are not limited to these topics only.
A Connections-first Approach to Supply Chain OptimizationNeo4j
Supply chain optimization is an unusual balancing act that requires finesse, skill and timely data. Every supply chain’s the key questions to be answered are:
What to Buy? -- what are the factors in determining your optimal product mix and set of suppliers.
How much to Buy? -- what are the most and least popular items at any given time interval
When to Buy? -- long lags in delivery timing may tax limit your flexibility and influence your inventory management practices.
We will illustrate an API-based solution that utilizes a Graph database platform to add demonstrable value to Supply Planning.
Webinar: How Penton Uses MongoDB As an Analytics Platform within their Drupal...MongoDB
NorthPoint Digital worked with the Penton and MongoDB teams to deliver a MongoDB based solution, Govalytics, to serve city and county governments. We will review the design decisions made and steps taken to implement and integrate into the existing digital platform.
In the session, we will review:
How Govalytics fits into Penton's entire digital platform?
What were the business drivers for choosing MongoDB (with Product Owner testimony) and why it was so successful?
How NorthPoint Digital implemented a complete, highly interactive UX solution powered by MongoDB as part of an integrated solution and not just as a database
Roadmap for the future – how the solution was designed to be independently scalable
From Traditional Data Warehouse to Holistic Data Integration and Faster Data ...Denodo
Watch full webinar here: https://bit.ly/3wZvTya
Presented at Data Innovation Summit 2022
We are pleased to present this case study given by Dagfinn Røed from SpareBank 1 Forsikring. Check this video to see how Denodo helped SpareBank 1 Forsikring with their data strategy.
Simplifying Data Interoperability with Geo Addressing and EnrichmentPrecisely
Working with addresses is hard! Each address in the U.S. has 13 attributes, and there are over 300 attributes to consider worldwide. Precisely’s geo addressing combines address verification, geocoding, and returning valid and accurate address suggestions, plus it appends a unique and persistent ID that enables an address to serve as the common element for simplifying data enrichment and enables context around said address.
Different business needs require a unique standardization, verification, and enrichment approach. Questions such as:
- Is a house in an area of high fire risk?
- How can we target our advertising to families living in apartments?
- Which downtown businesses can I serve with my existing fiber-optic infrastructure?
Are easy to answer with geo addressing and data enrichment.
Join us to learn how:
- Adding context to data such as points of interest, property details, demographics, and boundaries (neighborhoods, postal codes, flood zones) can help bring agility and insights to improve business processes
- Scalable, international geo addressing can simplify the matching, cleansing, verification, and geocoding of diverse business data across an organization
- A unique and persistent identifier helps simplify the labor of joining disparate data sets for seamless data interoperability without costly and time-consuming spatial processing
Datenvirtualisierung: Wie Sie Ihre Datenarchitektur agiler machen (German)Denodo
Watch full webinar here: https://bit.ly/3idAnbf
Heute werden hochwertige Daten schnell und integriert benötigt, mittlerweile häufig auch über unterschiedliche Clouds hinweg.
Datenvirtualisierung kann hier als logische Datenschicht wahre Wunder wirken und die Modernisierung der Datenarchitektur drastisch beschleunigen.
In unserem kostenlosen Webinar interviewen wir den Experten Otto Neuer von Denodo, der die hier nur angerissenen Gedanken weiter ausführt. Er wird uns Einblicke in den Wandel von Datenarchitekturen geben und wie aus seinem Blickwinkel die nächste Phase der Business Intelligence aussieht.
Was Sie mitnehmen:
- Was sind die Herausforderungen und Limitierungen traditioneller Datenarchitekturen
- Wie können mit modernen Architekturen diese Limitierungen aufgehoben werden
- Welche Rolle spielt Datenvirtualisierung bei modernen Datenarchitekturen
- Was ist die nächste Phase der Business Intelligence
Erfahren Sie am 23. September 2020, den Experten Otto Neuer von Denodo zusammen mit unserem Partner QuinScape GmbH wird uns Einblicke in den Wandel von Datenarchitekturen geben und wie aus seinem Blickwinkel die nächste Phase der Business Intelligence aussieht.
Sie haben Interesse? Dann melden Sie sich am besten direkt an - die Plätze der Veranstaltung sind begrenzt.
Learn How to Turbocharge Your AI/ML Data Workflows with Data EnrichmentPrecisely
Trusted analytics and predictive data models require accurate, consistent, and contextual data. The more attributes used to fuel models, the more accurate their results. However, building comprehensive models with trusted data is not easy. Accessing data from multiple disparate sources, making spatial data consumable, and enriching models with reliable third-party data is challenging.
In this webinar you will learn how to:
Organize and manage address data and assign a unique and persistent identifierEnrich addresses with standard and dynamic attributes from our curated data portfolioAnalyze enriched data to uncover relationships and create dashboard visualizations
Every day we roughly create 2.5 Quintillion bytes of data; 90% of the worlds collected data has been generated only in the last 2 years. In this slide, learn the all about big data
in a simple and easiest way.
Content1. Introduction2. What is Big Data3. Characte.docxdickonsondorris
Content
1. Introduction
2. What is Big Data
3. Characteristic of Big Data
4. Storing,selecting and processing of Big Data
5. Why Big Data
6. How it is Different
7. Big Data sources
8. Tools used in Big Data
9. Application of Big Data
10. Risks of Big Data
11. Benefits of Big Data
12. How Big Data Impact on IT
13. Future of Big Data
Introduction
• Big Data may well be the Next Big Thing in the IT
world.
• Big data burst upon the scene in the first decade of the
21st century.
• The first organizations to embrace it were online and
startup firms. Firms like Google, eBay, LinkedIn, and
Facebook were built around big data from the
beginning.
• Like many new information technologies, big data can
bring about dramatic cost reductions, substantial
improvements in the time required to perform a
computing task, or new product and service offerings.
• ‘Big Data’ is similar to ‘small data’, but bigger in
size
• but having data bigger it requires different
approaches:
– Techniques, tools and architecture
• an aim to solve new problems or old problems in a
better way
• Big Data generates value from the storage and
processing of very large quantities of digital
information that cannot be analyzed with
traditional computing techniques.
What is BIG DATA?
What is BIG DATA
• Walmart handles more than 1 million customer
transactions every hour.
• Facebook handles 40 billion photos from its user base.
• Decoding the human genome originally took 10years to
process; now it can be achieved in one week.
Three Characteristics of Big Data V3s
Volume
• Data
quantity
Velocity
• Data
Speed
Variety
• Data
Types
1st Character of Big Data
Volume
•A typical PC might have had 10 gigabytes of storage in 2000.
•Today, Facebook ingests 500 terabytes of new data every day.
•Boeing 737 will generate 240 terabytes of flight data during a single
flight across the US.
• The smart phones, the data they create and consume; sensors
embedded into everyday objects will soon result in billions of new,
constantly-updated data feeds containing environmental, location,
and other information, including video.
2nd Character of Big Data
Velocity
• Clickstreams and ad impressions capture user behavior at
millions of events per second
• high-frequency stock trading algorithms reflect market
changes within microseconds
• machine to machine processes exchange data between
billions of devices
• infrastructure and sensors generate massive log data in real-
time
• on-line gaming systems support millions of concurrent
users, each producing multiple inputs per second.
3rd Character of Big Data
Variety
• Big Data isn't just numbers, dates, and strings. Big
Data is also geospatial data, 3D data, audio and
video, and unstructured text, including log files and
social media.
• Traditional database systems were designed to
address smaller volumes of structured data, fewer
updates or a predictable, consistent data stru.
Power Decision-making at Scale with Address-based Spatial Data SciencePrecisely
Location intelligence can add critical context to your data science projects and lead to better business decisions. Organizations in numerous industries including retail, real estate, insurance, construction, telecommunications, and government can reduce risks and speed responses to situations with superior location intelligence. Unfortunately, many organizations are unable to leverage precise, location-aware information because data is too hard to access, process, and interpret. As organizations expand globally and confront complex addresses and related data, they struggle even more.
Join this TDWI webinar to learn how you can simplify and accelerate location-aware data science processes. Speakers will discuss how trends such as cloud-native technologies and use of prebuilt location data sets can power data science and give decision makers important perspectives on risk, property decisions, situation response, and more.
Topics to be covered include:
TDWI perspectives on location intelligence and address-based spatial data science
The value of big data and cloud-native technologies for adding valuable context to business addresses
How to use high-precision location data to estimate risk
Guidance for leveraging location to extract actionable insights in data science projects and sharing results visually throughout your organization
This webinar explores the process of how OSSCube developed a Talend solution--for a global provider of digital marketing and client reporting tools--that aggregates and converts information from a variety of resources into well-defined data formats.
Watch on YouTube: https://www.youtube.com/watch?v=gyZiiG7mjx8
OSSCube EVP John Bernard and Talend Alliances and Channels Manager Rich Searle provide an in-depth explanation of the benefits of Talend as well as the usefulness of data organization in today's business world.
Key Discussion Points:
- Talend ETL tools capabilities
- Implementing Talend in your organization
For more information please visit OSSCube.com
For more webinars please visit OSSCube.com/upcoming-webinars
Follow us on Twitter @OSSCube
Follow us on LinkedIn http://linkedin.com/company/osscube
Similar to proDataMarket presentation at "Spatial Data on The Web" (20)
Chatty Kathy - UNC Bootcamp Final Project Presentation - Final Version - 5.23...John Andrews
SlideShare Description for "Chatty Kathy - UNC Bootcamp Final Project Presentation"
Title: Chatty Kathy: Enhancing Physical Activity Among Older Adults
Description:
Discover how Chatty Kathy, an innovative project developed at the UNC Bootcamp, aims to tackle the challenge of low physical activity among older adults. Our AI-driven solution uses peer interaction to boost and sustain exercise levels, significantly improving health outcomes. This presentation covers our problem statement, the rationale behind Chatty Kathy, synthetic data and persona creation, model performance metrics, a visual demonstration of the project, and potential future developments. Join us for an insightful Q&A session to explore the potential of this groundbreaking project.
Project Team: Jay Requarth, Jana Avery, John Andrews, Dr. Dick Davis II, Nee Buntoum, Nam Yeongjin & Mat Nicholas
Techniques to optimize the pagerank algorithm usually fall in two categories. One is to try reducing the work per iteration, and the other is to try reducing the number of iterations. These goals are often at odds with one another. Skipping computation on vertices which have already converged has the potential to save iteration time. Skipping in-identical vertices, with the same in-links, helps reduce duplicate computations and thus could help reduce iteration time. Road networks often have chains which can be short-circuited before pagerank computation to improve performance. Final ranks of chain nodes can be easily calculated. This could reduce both the iteration time, and the number of iterations. If a graph has no dangling nodes, pagerank of each strongly connected component can be computed in topological order. This could help reduce the iteration time, no. of iterations, and also enable multi-iteration concurrency in pagerank computation. The combination of all of the above methods is the STICD algorithm. [sticd] For dynamic graphs, unchanged components whose ranks are unaffected can be skipped altogether.
Explore our comprehensive data analysis project presentation on predicting product ad campaign performance. Learn how data-driven insights can optimize your marketing strategies and enhance campaign effectiveness. Perfect for professionals and students looking to understand the power of data analysis in advertising. for more details visit: https://bostoninstituteofanalytics.org/data-science-and-artificial-intelligence/
Show drafts
volume_up
Empowering the Data Analytics Ecosystem: A Laser Focus on Value
The data analytics ecosystem thrives when every component functions at its peak, unlocking the true potential of data. Here's a laser focus on key areas for an empowered ecosystem:
1. Democratize Access, Not Data:
Granular Access Controls: Provide users with self-service tools tailored to their specific needs, preventing data overload and misuse.
Data Catalogs: Implement robust data catalogs for easy discovery and understanding of available data sources.
2. Foster Collaboration with Clear Roles:
Data Mesh Architecture: Break down data silos by creating a distributed data ownership model with clear ownership and responsibilities.
Collaborative Workspaces: Utilize interactive platforms where data scientists, analysts, and domain experts can work seamlessly together.
3. Leverage Advanced Analytics Strategically:
AI-powered Automation: Automate repetitive tasks like data cleaning and feature engineering, freeing up data talent for higher-level analysis.
Right-Tool Selection: Strategically choose the most effective advanced analytics techniques (e.g., AI, ML) based on specific business problems.
4. Prioritize Data Quality with Automation:
Automated Data Validation: Implement automated data quality checks to identify and rectify errors at the source, minimizing downstream issues.
Data Lineage Tracking: Track the flow of data throughout the ecosystem, ensuring transparency and facilitating root cause analysis for errors.
5. Cultivate a Data-Driven Mindset:
Metrics-Driven Performance Management: Align KPIs and performance metrics with data-driven insights to ensure actionable decision making.
Data Storytelling Workshops: Equip stakeholders with the skills to translate complex data findings into compelling narratives that drive action.
Benefits of a Precise Ecosystem:
Sharpened Focus: Precise access and clear roles ensure everyone works with the most relevant data, maximizing efficiency.
Actionable Insights: Strategic analytics and automated quality checks lead to more reliable and actionable data insights.
Continuous Improvement: Data-driven performance management fosters a culture of learning and continuous improvement.
Sustainable Growth: Empowered by data, organizations can make informed decisions to drive sustainable growth and innovation.
By focusing on these precise actions, organizations can create an empowered data analytics ecosystem that delivers real value by driving data-driven decisions and maximizing the return on their data investment.
Opendatabay - Open Data Marketplace.pptxOpendatabay
Opendatabay.com unlocks the power of data for everyone. Open Data Marketplace fosters a collaborative hub for data enthusiasts to explore, share, and contribute to a vast collection of datasets.
First ever open hub for data enthusiasts to collaborate and innovate. A platform to explore, share, and contribute to a vast collection of datasets. Through robust quality control and innovative technologies like blockchain verification, opendatabay ensures the authenticity and reliability of datasets, empowering users to make data-driven decisions with confidence. Leverage cutting-edge AI technologies to enhance the data exploration, analysis, and discovery experience.
From intelligent search and recommendations to automated data productisation and quotation, Opendatabay AI-driven features streamline the data workflow. Finding the data you need shouldn't be a complex. Opendatabay simplifies the data acquisition process with an intuitive interface and robust search tools. Effortlessly explore, discover, and access the data you need, allowing you to focus on extracting valuable insights. Opendatabay breaks new ground with a dedicated, AI-generated, synthetic datasets.
Leverage these privacy-preserving datasets for training and testing AI models without compromising sensitive information. Opendatabay prioritizes transparency by providing detailed metadata, provenance information, and usage guidelines for each dataset, ensuring users have a comprehensive understanding of the data they're working with. By leveraging a powerful combination of distributed ledger technology and rigorous third-party audits Opendatabay ensures the authenticity and reliability of every dataset. Security is at the core of Opendatabay. Marketplace implements stringent security measures, including encryption, access controls, and regular vulnerability assessments, to safeguard your data and protect your privacy.
2. How can we innovate (and make money)
with property-related Open Data?
3. Why property data?
One of the most valuable datasets managed by
governments worldwide
Extensively used in various domains by private and
public organizations
4. Some challenges in working with property data
• Difficult to access
• Cross-sectors
• Data is highly heterogeneous and possibly large
• Data quality
• Time-consuming integration
• Lack of innovation
• …
5. proDataMarket project goals
• To make property data more accessible, more usable and
easier to understand
• To make it easier for:
• Property data providers to publish and distribute their data
• Data consumers to find and access property data needed for their
businesses
7. Reporting state-owned real estate properties
in Norway
• A hard copy of 314 pages and as a
PDF file
• 6 Person-Months
• Data collection with spreadsheets
• Quality assurance through e-mails
and phone correspondence
Pains
• Time consuming
• Poor data quality
• Static report without live updating
• Live service
• Efficient sharing of data
• Simplified integration with external
datasets
• Live updating
• Reliable access
• …
• Risk and vulnerability analysis,
e.g. buildings affected by
flooding
• Analysis of leasing prices
Report Reporting Service 3rd party services
7
8. • Stakeholders:
• Public administration
• Farmers and land owners
• Intermediaries (e.g. service providers)
• Problems:
• Unfair grant assignment and
expenditure on audits
• Incorrect grant assignments
• Farmers could loose close to 30% of funding
CAP funds assignments
8
9. 9
Registry Score on Istat dataset City of Turin Real estate evaluation
Objective evaluation of the real estate properties
12. DatGraft: Data Transformation and RDF Publication Process
• Interactive design of transformations
• Repeatable transformations
• Reuse/share transformations (user-
based access)
• Cloud-based deployment of
transformations
• Self-serviced process
• Data and Transformation as-a-Service
12
Semantic graph
database