Here are the key steps in hypothesis testing:
1. State the null (H0) and alternative (Ha) hypotheses:
H0: The average daily usage of social media of Sofia's friends is the same as the global average usage (142 minutes).
Ha: The average daily usage of social media of Sofia's friends is not the same as the global average usage.
2. Choose the level of significance:
Most commonly used are 1%, 5%, and 10%. Let's use 5% level of significance or α = 0.05.
3. Collect data and compute the test statistic:
Sofia would need to compute the average daily usage of her friends and the


![13
CO_Q4_ Statistics and Probability SHS
Module 1
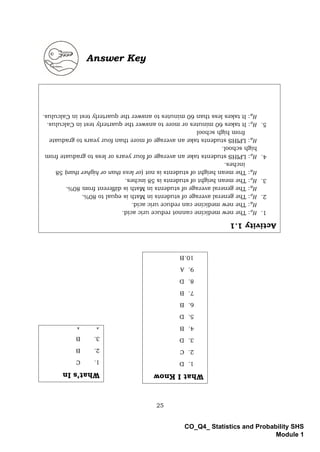
Illustrative Example 3:
Sketch the rejection region of the test hypothesis with critical values of ±1.753
and determine if the computed t-value of –1.52 lies in that region.
Solution:
Draw a t-distribution curve. Since there are two critical values, it is a two
tailed test. Locate the critical values and shade the rejection regions.
Now, locate the computed t-value of –1.52. You can clearly see that it is not
at the rejection region as shown in the following figure. The computed t-value
is at the non-rejection region. Therefore, we fail to reject the null hypothesis,
𝐻𝑜.
Type I and Type II Errors
✓ Rejecting the null hypothesis when it is true is called a Type I error
with probability denoted by alpha (𝜶). In hypothesis testing, the
normal curve that shows the critical region is called the alpha region.
✓ Accepting the null hypothesis when it is false is called a Type II
error with probability denoted by beta (𝛃). In hypothesis testing, the
normal curve that shows the acceptance region is called the beta
region.
✓ The larger the value of alpha, the smaller is the value of beta.
This is the region of Type I
error.
α = P [Type I error]
= P [𝐻𝑜 is true, Reject 𝐻𝑜]
Region where 𝐻𝑜
is true
1.753
(critical value)
– 1.753
(critical value)
– 1.52](https://image.slidesharecdn.com/probstat-mod01-230206153431-ecf992c7/85/ProbStat-Mod01-pdf-17-320.jpg)
![14
CO_Q4_ Statistics and Probability SHS
Module 1
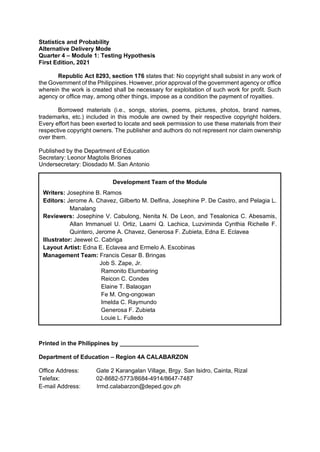
To summarize the difference between the Type I and Type II errors, take a
look at the table below.
Now, complete the statements that follow.
Null Hypothesis 𝑯𝒐 Fail to Reject 𝑯𝒐 Reject 𝑯𝒐
True
Correct Decision
- Failed to reject 𝐻𝑜 when
it is true
Type I Error
- Rejected 𝐻𝑜 when
it is true
False
Type II Error
- Failed to reject 𝐻𝑜 when
it is false
Correct Decision
- Rejected 𝐻𝑜 when it
is false
α
Region where 𝐻𝑜 is
false
This is the region of Type II
error.
β = P [type II error]
= P [𝐻𝑜 is false, Fail to reject 𝐻𝑜]
𝜷
Analyze the possibilities of Sofia’s conclusion. Identify if it is a Type I
Error, Type II Error, or a Correct Decision.
If Sofia finds out that her null hypothesis is …
1. true and she fails to reject it, then she commits a ____________________.
2. true and she rejects it, then she commits a _____________________.
3. false and she fails to reject it, then she commits a __________________.
4. false and she rejects it, then she commits a _____________________.
Your answers should be: 1) Correct Decision, 2) Type I Error, 3) Type II
Error, and 4) Correct Decision.](https://image.slidesharecdn.com/probstat-mod01-230206153431-ecf992c7/85/ProbStat-Mod01-pdf-18-320.jpg)