Dehradun is very old city and also rapidly growing urban area located in valley at foothills of Garhwal Himalayas. Dehradun city and adjoining region in western Himalayas is a is a very active seismic region of Himalayan belt , stretching from Pamir - Hindukush to Arkans in Burma.According to seismic zoning map of India , Dehradun city lies in Zone 4 and expected MSK intensity 8 .Dehradun city is located in the vicinity of twenty four independent seismic source zones which in reality are active faults. This creates uncertainties in size , location and the rate of recurrence of earthquakes. Probabilistic seismic hazard analysis provides a framework in which these uncertainties can be identified , quantified and combined in a rational manner to provide a more complete picture of the seismic hazard . This study presents a PSHA of the Dehradun city using the attenuation relationship given by Cornell et al (1979) in order to determinate various levels of earthquake-caused ground motion that will be exceeded in a given future time period.
Estimation of clearness index from different meteorological parameters in IRAQIOSR Journals
The aim of this paper is to estimate the mean monthly values of clearness index in five meteorological stations in Iraq (Mosul , Kirkuk , Rutba , Baghdad , Nasiriya) for the period (1970-2000) using different meteorological parameters. Five different models (Linear , Quadratic , Logarithmic , Linear logarithmic , Power) were used to estimate clearness index. The performance of this regression models were evaluated by comparing the calculated clearness index and the measured clearness index . Several statistical tests were used to control the validation and goodness of the regression models in terms of correlation coefficient, coefficient of determination , Mean absolute error and root mean square error . Results showed that Linear model between (KT & n/N) and between (KT & Rainfall) were the best fit in all stations. Quadratic model were the best fit between (KT & cloudiness) , and power model were the best fit between (KT &Evaporation). Linear model and Quadratic model were the best fit between (KT & RH) , while power model , Quadratic model , and Linear model were the best fit between (KT & Tmean).
Seismic comparative study on tmd structure an overvieweSAT Journals
Abstract In larger context of civil engineering use of mechanical vibration control device is very often in present days, so this paper will provide the successful implementation specification of TMD to reduce the vibration induced due earthquake ground motion, with computer stimulated model & dynamic responses are obtained for seismic loading with & without TMD which drastically reduces seismic response such as lateral displacement, story drift, base shear, overturning moment. Even actual behavior study on structure has been carried by inducing ground motion to the structure by considering time history data of El-Centro & recent earthquake (2014) which happened in India. Keywords: TMD, Time History, Base Shear, Story Drift, El-Centro etc…
An Approach for Enhanced Performance of Packet Transmission over Packet Switc...ijceronline
With the increased use of real time applications, there is a need for improved network traffic and bandwidth management. Switches are being used by computer networks for enabling connection between those hosts which are not connected by a direct link. When two or more than two host attempt to transmit packet at the same time, collision in data packets occurred. In this paper an optimized performance of local area network in terms of collision count and some other parameter have been investigated using simulation model. Simulation results have been obtained in different network scenarios by varying the number of devices in the network.
The performance of soil slope during an earthquake is generally analyzed by three different approaches which are pseudo-static methods, Newmark’s Sliding Block method and numerical techniques. In pseudo-static approach, the effects of an earthquake are represented by constant vertical (kv) and horizontal (kh) seismic acceleration coefficients and the factor of safety is evaluated by using limit equilibrium or limit analysis or finite element method of analysis. Newmark’s sliding block method evaluates the expected displacement of slope subjected to any ground motion obtained from the integration of the equation of motion for a rigid block sliding in an inclined plane. Numerical methods determine the expected displacements obtained from the stress – strain relationship of a soil mass. In this paper the stability of a model soil slope, comprising of an embankment with two canal bunds at the top, at different stages of construction, i.e. only embankment, embankment with empty canal bunds and embankment with canal bunds filled with water, with different foundation soils in different seismic zones have been analyzed and results have been plotted in the form of variation of factor of safety with horizontal seismic acceleration coefficient (kh). The critical case has been further analyzed under dynamic conditions. Dynamic analyses have been carried out by plotting the response spectrum curve and selecting 2001 Bhuj earthquake motion as the typical ground motion.
Information technology of developing test kits based on software requirementsijceronline
The article presents an advanced information technology of developing test kits based on software requirements using regulated cascading decision charts, providing the increase of coverage completeness by the projected test kits of software requirements and the accuracy of the tests themselves. The article presents an advanced information technology of developing test kits based on software requirements using regulated cascading decision charts, providing the increase of coverage completeness by the projected test kits of software requirements and the accuracy of the tests themselves
TYPE-2 FUZZY LINEAR PROGRAMMING PROBLEMS WITH PERFECTLY NORMAL INTERVAL TYPE-...ijceronline
In this paper, the Perfectly normal Interval Type-2 Fuzzy Linear Programming (PnIT2FLP) model is considered. This model is reduced to crisp linear programming model. This transformation is performed by a proposed ranking method. Based on the proposed fuzzy ranking method and arithmetic operation, the solution of Perfectly normal Interval Type-2 Fuzzy Linear Programming model is obtained by the solutions of linear programming model with help of MATLAB. Finally, the method is illustrated by numerical examples.
Modeling and Simulation of Wavelength-Routed optical Networksijceronline
All-optical Wavelength Division Multiplexing (WDM) networks providing extremely large bandwidths are among the most promising solutions to the increasing need for high-speed data transport. A lightpath has a specific route and one or more wavelengths through which the information is routed from the source to the destination node. In wavelength-routed optical networks, data are transmitted solely in the optical domain along lightpaths from source to destination without being converted into the electronic form and each lightpath is allowed to use the same wavelength on all the links along its path. This restriction is known as the wavelength continuity constraint. And it leads to an issue called as blocking in networks. Optical wavelength conversion with suitable Routing and wavelength assignment (RWA) can increase the performance and capacity of optical networks by eliminating this restriction and relaxing the wavelength continuity constraint. In this research, we analyze the problem of placing a limited number of wavelength converters in a mesh network using Weighted Maximum Segment Length (WMSL) converter placement algorithm. It employs Least-Loaded Routing and First-Fit (LLR-FF) RWA algorithm. It is tested on varying number of nodes in network and its respective blocking probabilities are calculated. The proposed algorithm provides the minimum blocking probability on optimal wavelength converters placement.
Database Management in Different Applications of IOTijceronline
In the recent years, the Internet of Things (IoT) is considered as a part of the Internet of future and makes it possible for connecting various smart objects together through the Internet. The use of IoT technology in applications has spurred the increase of real-time data, which makes the information storage and accessing more difficult and challenging. This paper discusses the different Databases used for different applications in IOT.
Medium Access Probability of Cognitive Radio Network Under ECC-33/Hata-Okumur...ijceronline
Cognitive radio detects the presence or absence of Primary User (PU) in its sensing region to provide the free radio spectrum to its Secondary user (SU). It is widely accepted a SU is only allowed to access a network of PU when no PU of that network is accessing the network at that moment. Sometimes SU misjudges the presence of PU inside the sensing region though the PU is in transmitting mode outside the sensing region which is termed as spatial false alarm. The incorporation of spatial false alarm makes the task more difficult. Previous literature performs this task using Lee’s path loss model .In our paper we have considered ECC-33/ Hata-Okumura Extended Model for two frequencies 1900MHz and 2100MHz as its frequency range is up to 3.5 GHz and compare the performance using different fading channels such as Rayleigh, Nakagami-m, Normal or Gaussian, Weibull, MRC Rayleigh and Selection Combining Rayleigh.
Online Examination System using Raspberry piijceronline
Online examination is the new scenario which is effective solution for education evaluation. Most of the institute, colleges, university, schools as well as for the competitive exam use online examination system for conducting exams. The previous online examination system is based on browser/ server structure or client/server structure as they require individual computer to every student. As the number of students are increasing we need more computers this will increase the cost. To avoid this we have designed an embedded device which is keypad based. This embedded device can be used to conduct online examination with only one desktop computer. The main objective of this system is to provide automated system that not only saves lot of time but also gives accurate and fast result with a higher security
Welding Studies on WB36 for Feed Water Pipingijceronline
To increase efficiency, reduce emissions, cost and to reduce weight of boiler per MW, the power manufacturing sectors are going towards the once through technology (super critical boiler) instead of sub- critical. Once through supercritical (OTSC) technology has become a focal point for effective utilization of coal-based thermal power generation sector in India. Another main advantage of moving towards OTSC technology is reducing the weight of the boiler per MW, which can be done by going for material capable of handling higher pressure and temperature than the conventional material. So, in order to keep pace with these technologies, research on newer materials for every boilers line, which can operate at both higher pressure and temperature, has been initiated. So, in this article, we have taken one such feed water system and headers, where WB 36 steel (15 MiCuMoNiNb5) can be used instead conventional standard carbon steel like A106 grade B or C, which are usually used. For super critical, ultra super critical power plants this conventional materials like A106 grade B or C, leads to very thick piping system. V&M has developed WB 36 steel (15 MiCuMoNiNb5) for high pressure piping of boiler feed water system. This heat-resistant, copperalloyed ferritic steel 15MiCuMoNiNb5 has been widely used in European nuclear and conventional power plants for decades for feed water system. This widespread application is due to the toughness and strength, caused by the precipitation of copper, that are exhibited even at elevated temperatures which other fine-grained structural steels have at room temperature. The aim of this project “Welding Studies on WB36 Steel for Feed Water Piping” was taken to understand the metallurgy and the behavior of the new materials under different manufacturing operations.
Experimental Study Compared With American Code - ConcreteFilled – Double Skin...ijceronline
Six Specimens with three different volume fractions of steel fibers are cast and tested. Experiments on circular steel tubes in – filled with steel fiber reinforced concrete (SFRC) and normal concrete have been performed to investigate the contribution of steel fibers to the load bearing capacity of Short Composite Columns . The main variable considered in the test study is the percentage of steel. Fibers added to the in –filled concrete. All the specimens were tested under axial failure state realization. This project presents the percentage Variation in the compression strengths of the 3 types of Composite members taken under Study. The results show that 1.5% SFRC in filled steel columns exhibit enhanced ultimate load carrying compression until capacity. Experimental studies compared with American code
A Study on Process Improvement in the Assembly Line of Switch Manufacturingijceronline
The paper is about the process improvement in the assembly line at switch manufacturing company and to improve the process by focusing into the areas viz. Process flow, Time study and rework minimization. This improvement are made by using cause-and-effect diagram, critical path method and root cause analysis. The analysis will help to reduce the amount of rework that occurs during manufacturing of modular switches in the assembly line process
The Research of the Tracking and Traceability System for Vegetable Quality As...ijceronline
The paper Proposed a tracking and traceability system for vegetable quality assessment and assurance. The system used coding technology to realize the total quality management and "from farm to table" tracking and tracing. Besides, the system provided automatic assessment of the quality of vegetables and intelligent guidance of planting vegetables. The paper firstly Studied the principle and model of the system, and then described the design and implementation of the system. Finally, some key issues of the system are discussed in detail.
Jacobian-free Newton Multigrid method for Elastohydrodynamic line contact wit...ijceronline
In this article, a Jacobian-free Newton Multigrid (JFNMG) method is used for the analysis of isothermal, steady state and incompressible Elastohydrodynamic lubrication (EHL) line contact problem. The lubricant is grease and its rheology is described by Hershel-Bulkley constitutive equation. The problem is investigated for smooth contact surfaces. A finite difference scheme, developed after discretizing governing equations on a uniform grid, is used for the solution of the EHL problem. The JFNMG method is applied to the system of algebraic equations, which arise in the scheme, and obtain solution for a wide range of parameters of interest. The proposed scheme not only overcomes the limitations of conventional schemes but is also, stable and fast converging for the investigation of the EHL problems. The JFNMG method approximates Jacobian matrixvector product accurately with much ease without requiring additional storage at each iteration, and avails convergence features of Newton method as well as convergence strategy (up to discretization error) of multigrid. The EHL features, namely, pressure profiles, film shapes and Petrusevich pressure spikes are studied for different parameters of interest. The minimum film thickness decreases for decrease in n, which is a power law index in Hershel-Bulkley model characterizing grease lubricant, with other parameters held constant. There is a noticeable decrease (in height as well as spread) of pressure spike for small values of n, which arrests bearings fatigue life.
Smes Traditional Packaging Technology as a Part of Building Brand Soul of Pro...ijceronline
Packaging is a container used to pack a product. The function of packaging is not only for container but also as the image formation and marketing. In Semarang, Indonesia, the usage of packaging has become a habit of perpetrators of SMEs, but they use shortcut in using media, material and shape of the packaging by reason of the price and ease of getting goods. In this study we will discuss the traditional packaging technology which is cheap and efficient with good function for SMEs, especially food products and a differentiator as well as building brand soul on SMEs products. This study uses research methodology with interviews with Entrepreneurships of Bureau of Cooperatives and Small-Medium Enterprises Semarang and observation on the perpetrators SMEs in traditional markets and souvenir center on Pandanaran street Semarang. And theory usage as a source of benchmark studies of traditional packaging technology. This research aims to develop the creativity of actors SMEs in technology to package their products.
Film Condensation Behaviour of Steam on Isothermal Walls in Presence of Non-C...ijceronline
Numerical modelling of condensation had been a challenging task for the researchers for many years due to its time scale and rapidity. Present work deals with the characterization of condensation in presence of non-condensable gases on isothermal surfaces which is a common situation in many condensing devices. The investigation includes the effect of different flow parameters on condensation of saturated steam-air mixture using a numerical approach. The study uses wall condensation model through ANSYS CFX solver. The effect of mass fraction of steam, operating pressure and mass flow rate of mixture is studied. Investigation provides some key characteristics about film condensation which normally remain absent in condensation without non-condensable gas. The findings of this study will provide valuable insight in thermal design process of components incorporating this phenomenon.
Simulation of Critical Crack Length Propagation Using Fracture Mechanicsijceronline
The focus of this paper is to investigate and analyze the study on the plate of steel, Aluminum and Epoxy with a center crack. Linear elastic fracture mechanics principles have been used for calculating Stress Intensity Factor, Critical crack length, Increment in crack, Mean stress and strain Amplitude at critical fatigue load cycles. Above calculations will be done on the plate with centre crack of various materials (steel, aluminum and epoxy) to predict crack length to evaluate and to compare the results with theoretical calculations. .Conclusions/results obtained on the basis of analysis.
Human Identification by Segmentation and Enhancement of Sclera using Matlabijceronline
Sclera is the white and opaque covering of the eye. The vein structure in sclera is unique and distinct to each person. This paper proposes a recognition method for human identification (ID) using sclera as a biometric. The challenge faced is that the vein structure moves with the movement of the eye and vessel structures are often defocused and or saturated. The sclera has been consider multilayered pattern. The contributions of the paper are: This paper proposes a new approach for human sclera identification. This paper proposes a new method for sclera segmentation which works for color as well as grayscale images. This paper designs a Gabor wavelet based sclera pattern enhancement method to emphasize and binarize the sclera vessel pattern. This paper proposes a line descriptor based feature extraction, registration, and matching method.
Ride comfortability of vehicle is a big challenge for the automotive industries and design engineers. The suspension system is the major source of providing comfortability by absorbing vertical vibrations. This paper presents modeling of the non-linear semi-active suspension system equipped with Magneto Rheological damper. Simulation of the designed model is performed in Simulink. A comparative analysis of the Simulink response shows the difference between linear and non-linear model. It has also shown that fuzzy logic controller has improved the performance of the system.
Achieving Energy Efficiency of HVAC through Variable Frequency Driveijceronline
The Air Handling units generally consisting Cooling coils (water cooled of DX type) and Heating (Electric or steam ) are followed by air filters. The design of air flow calculation is done considering pressure drop filters are about 75 % chock .In actual use when filters are new or replaced the pressure drop is very less and we get high airflow which subsequently increases the Cooling and heating Load on system .If we put a velocity sensor after the filters which input fed PLC (Programmable Logical Controller) ,the motor RPM can be controlled ,saving the excess westage of Energy and pollution
Performance improvement of a Rainfall Prediction Model using Particle Swarm O...ijceronline
The performances of the statistical methods of time series forecast can be improved by precise selection of their parameters. Various techniques are being applied to improve the modeling accuracy of these models. Particle swarm optimization is one such technique which can be conveniently used to determine the model parameters accurately. This robust optimization technique has already been applied to improve the performance of artificial neural networks for time series prediction. This study uses particle swarm optimization technique to determine the parameters of an exponential autoregressive model for time series prediction. The model is applied for annual rainfall prediction and it shows a fairly good performance in comparison to the statistical ARIMA model
IJERA (International journal of Engineering Research and Applications) is International online, ... peer reviewed journal. For more detail or submit your article, please visit www.ijera.com
This project is about the seismic wave signal Parameter enhancement with vibration analysis and
geomagnetic signal anomalies. In this project, we are going to detect the seismic signal using seismograph. The
ghosting effects were occurring and it will be suppressed using the filters. We propose to show the benefit of 1D
convolutional filter, to remove all the non-energetic wave-field in order to provide a better imaging of the
reflecting wave-field. In this paper, wave signals are decomposed into intrinsic (characteristic) modes via Discrete
Wavelet Transform [4] (DWT), Empirical Mode Decomposition [1] (EMD) and the relationship between seismic
activities are investigated.
DETERMINING METAL SURFACE WAVINESS PARAMETERS AND HEIGHT LIQUID SURFACE WAVE ...IAEME Publication
The work is concentrated on an experimental approach to determine surface waviness of metal and height of liquid surface wave. It is based on illuminated those surfaces with a highly coherent light such as laser, and observed movement of center of speckle pattern which were gained from the movement surfaces by using tracking program. The movements of the speckle pattern work on carries important information about those surfaces. Two triangulation methods employed to evaluate metal waviness and liquid surface wave. The first method apply on a solid material (metal) and taking a video directly from the reflected surface, the second method apply on the liquid material (oil ) and taking a video after reflected from screen. The methods used here have a great potential for precise and non-contact optical measurements for surface wave measurements.
IJRET : International Journal of Research in Engineering and Technology is an international peer reviewed, online journal published by eSAT Publishing House for the enhancement of research in various disciplines of Engineering and Technology. The aim and scope of the journal is to provide an academic medium and an important reference for the advancement and dissemination of research results that support high-level learning, teaching and research in the fields of Engineering and Technology. We bring together Scientists, Academician, Field Engineers, Scholars and Students of related fields of Engineering and Technology
Dynamic analysis and condition assessment of rc building by varying material ...eSAT Journals
Abstract
In the present dissertation study, an SMRF building situated in seismic zone-III having G+ 10 storey has been considered for performing linear dynamic or response spectrum method of analysis, to achieve and compare various results such as storey drift, storey displacement for considered DCON-2 and DCON-3 load combinations as per IS: 1893-2002 (Part-I), all imposed load are considered as per IS 875:2000. Also the condition assessment of the building models through system identification approach and extract the modal identification parameters like frequency, damping, mode shapes. Furthermore spectral displacement, spectral velocity and spectral acceleration are obtained for various percentages of damping i.e., 0, 5 and 10, for all the considered SMRF building models. The overall dissertation flow has been carried out to perform linear dynamic analysis (response spectrum method) for the parameters ELCENTRO, using the finite element method based analytical software ETABS-15 version.
Keywords: Linear dynamic, Condition assessment, Material damping, Time dependent and Response spectrum
Dynamic analysis and condition assessment of rc building by varying material ...eSAT Journals
Abstract
In the present dissertation study, an SMRF building situated in seismic zone-III having G+ 10 storey has been considered for performing linear dynamic or response spectrum method of analysis, to achieve and compare various results such as storey drift, storey displacement for considered DCON-2 and DCON-3 load combinations as per IS: 1893-2002 (Part-I), all imposed load are considered as per IS 875:2000. Also the condition assessment of the building models through system identification approach and extract the modal identification parameters like frequency, damping, mode shapes. Furthermore spectral displacement, spectral velocity and spectral acceleration are obtained for various percentages of damping i.e., 0, 5 and 10, for all the considered SMRF building models. The overall dissertation flow has been carried out to perform linear dynamic analysis (response spectrum method) for the parameters ELCENTRO, using the finite element method based analytical software ETABS-15 version.
Remote Sensing Method for Flood Management SystemIJMREMJournal
Flood occurred when heavy and continuous rainfall exceeding the absorptive capacity of soil and the flow
capacity of rivers, streams, and coastal areas. Land areas that are most subjected to floods are areas situated
adjacent to rivers and streams, that are known as floodplain and therefore considered as “flood-prone”. These
areas are hazardous to development activities if the vulnerability of those activities exceeds an acceptable level.
The main objectives of this study are; to identify floodplains and other susceptible areas, and to assess the
extent of disaster impact in the study area which is located at Kota Tinggi, Johor, Malaysia. This area
experienced an unprecedented flood during December of 2006 to January of 2007.Questions such as how often
and how long the floodplain will be covered by water, and at what time of year flooding can be expected need to
be answered. Thus, an understanding of the dynamic nature of floodplains is greatly required. Multi-temporal
Radarsat-1images, Landsat ETM+ image, topographical maps and land use maps were used in this study for
the purpose of delineating the flood extend before, during and after the flood event. DEM acquired from
topographic map is used to derive flood depth. The final outputs of this study are flood extent and flood depth
maps where both of these maps show the impact of the flood to environment, lives and properties. This map is
also important and can be applied to develop a comprehensive relief effort immediately after flooding.
Seismic Microzonation - Principles and MethodologyIJERA Editor
The string of earthquake in India has created a serious problem for engineers and administrators and even for
people also. Metro cities and other big cities in India have experienced severe earthquake hazard problem. This is
same for Himalayan region and even peninsular shield. On 26 jan 2001 , one of the greatest India has ever
experienced strikes in Kachchh , a region of Gujrat . Magnitude of this earthquake was 7.7 (MW) .This earthquake
spread a huge damage which was almost a radius of 400 Kms. This earthquake damaged major cities of Gujrat like
Ahmedabad , Bhavnagar , Surat. No one can say no for same threat for Delhi , national capital of India from local
and probable catastrophic earthquake due to central himalaya . There are many more other Indian cities which are
sitting in thick sedimentry basins along Indo-Gangetic plane and Brahmaputra valley . They have also the same
threat. To reduce the seismic hazard, it is now important to define a correct response in terms of peak ground
acceleration and spectral amplification . Both are highly dependent on local site conditions and also dependent on
source characterization of future expected earthquakes . Microzonation studies are now important for a detailed
ground motion modelling for urban and semi-urban cities of India. This paper presents an overview of seismic
microzonation . Steps required and methodology used for seismic microzoation is also discussed here.
this ppt is related to disaster management cycle , paradigm shift pre disaster preparedness,SEISMIC MICROZONATION
helpfull to give a presentation at college school and any other way also
Similar to Probabilistic Seismic Hazard Analysis Of Dehradun City , Uttrakhand (20)
Overview of the fundamental roles in Hydropower generation and the components involved in wider Electrical Engineering.
This paper presents the design and construction of hydroelectric dams from the hydrologist’s survey of the valley before construction, all aspects and involved disciplines, fluid dynamics, structural engineering, generation and mains frequency regulation to the very transmission of power through the network in the United Kingdom.
Author: Robbie Edward Sayers
Collaborators and co editors: Charlie Sims and Connor Healey.
(C) 2024 Robbie E. Sayers
Welcome to WIPAC Monthly the magazine brought to you by the LinkedIn Group Water Industry Process Automation & Control.
In this month's edition, along with this month's industry news to celebrate the 13 years since the group was created we have articles including
A case study of the used of Advanced Process Control at the Wastewater Treatment works at Lleida in Spain
A look back on an article on smart wastewater networks in order to see how the industry has measured up in the interim around the adoption of Digital Transformation in the Water Industry.
Immunizing Image Classifiers Against Localized Adversary Attacksgerogepatton
This paper addresses the vulnerability of deep learning models, particularly convolutional neural networks
(CNN)s, to adversarial attacks and presents a proactive training technique designed to counter them. We
introduce a novel volumization algorithm, which transforms 2D images into 3D volumetric representations.
When combined with 3D convolution and deep curriculum learning optimization (CLO), itsignificantly improves
the immunity of models against localized universal attacks by up to 40%. We evaluate our proposed approach
using contemporary CNN architectures and the modified Canadian Institute for Advanced Research (CIFAR-10
and CIFAR-100) and ImageNet Large Scale Visual Recognition Challenge (ILSVRC12) datasets, showcasing
accuracy improvements over previous techniques. The results indicate that the combination of the volumetric
input and curriculum learning holds significant promise for mitigating adversarial attacks without necessitating
adversary training.
Water scarcity is the lack of fresh water resources to meet the standard water demand. There are two type of water scarcity. One is physical. The other is economic water scarcity.
Saudi Arabia stands as a titan in the global energy landscape, renowned for its abundant oil and gas resources. It's the largest exporter of petroleum and holds some of the world's most significant reserves. Let's delve into the top 10 oil and gas projects shaping Saudi Arabia's energy future in 2024.
Final project report on grocery store management system..pdfKamal Acharya
In today’s fast-changing business environment, it’s extremely important to be able to respond to client needs in the most effective and timely manner. If your customers wish to see your business online and have instant access to your products or services.
Online Grocery Store is an e-commerce website, which retails various grocery products. This project allows viewing various products available enables registered users to purchase desired products instantly using Paytm, UPI payment processor (Instant Pay) and also can place order by using Cash on Delivery (Pay Later) option. This project provides an easy access to Administrators and Managers to view orders placed using Pay Later and Instant Pay options.
In order to develop an e-commerce website, a number of Technologies must be studied and understood. These include multi-tiered architecture, server and client-side scripting techniques, implementation technologies, programming language (such as PHP, HTML, CSS, JavaScript) and MySQL relational databases. This is a project with the objective to develop a basic website where a consumer is provided with a shopping cart website and also to know about the technologies used to develop such a website.
This document will discuss each of the underlying technologies to create and implement an e- commerce website.
Sachpazis:Terzaghi Bearing Capacity Estimation in simple terms with Calculati...Dr.Costas Sachpazis
Terzaghi's soil bearing capacity theory, developed by Karl Terzaghi, is a fundamental principle in geotechnical engineering used to determine the bearing capacity of shallow foundations. This theory provides a method to calculate the ultimate bearing capacity of soil, which is the maximum load per unit area that the soil can support without undergoing shear failure. The Calculation HTML Code included.
Sachpazis:Terzaghi Bearing Capacity Estimation in simple terms with Calculati...
Probabilistic Seismic Hazard Analysis Of Dehradun City , Uttrakhand
1. ISSN (e): 2250 – 3005 || Volume, 06 || Issue, 04||April – 2016 ||
International Journal of Computational Engineering Research (IJCER)
www.ijceronline.com Open Access Journal Page 23
Probabilistic Seismic Hazard Analysis Of Dehradun City ,
Uttrakhand
Ashutosh Gupta1
, Sana Zafar 2
1
P.G. Student, Department of Civil Engineering, MMM University of Technology, Gorakhpur, Uttar
Pradesh, India
2
Assistant Professor, Department of Civil Engineering, MMM University Of Technology, Gorakhpur, Uttar
Pradesh, India
I. Introduction
Dehradun city has been subjected to frequent earthquakes of moderate intensities and about once i a century to
disastrous earthquake of higher magnitude . Greatest earthquake recorded in Dehradun region on September 1 ,
1803. The magnitude of this earthquake was about 9.0.
Magnitude-Frequency data on earthquakes in Dehradun and its surrounding region is given below.
EARTHQUAKES
OF MAGNITUDES
IN RICHTER
SCALE
5 TO 6 6 TO 7 7 TO 7.5 7.5 TO 8 >8
NO. OF EVENTS 36 11 2 1 2
RECURRENCE
INTERVAL IN
YEARS
2 5 10 31 190
TABLE 1 : Earthquakes in Dehradun and its surrounding region
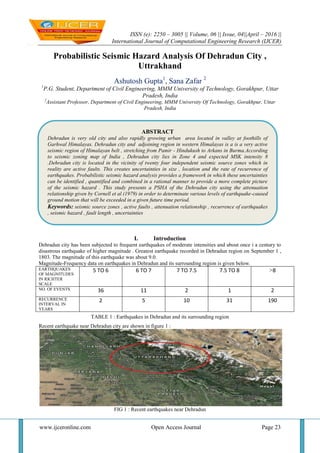
Recent earthquake near Dehradun city are shown in figure 1 :
FIG 1 : Recent earthquakes near Dehradun
ABSTRACT
Dehradun is very old city and also rapidly growing urban area located in valley at foothills of
Garhwal Himalayas. Dehradun city and adjoining region in western Himalayas is a is a very active
seismic region of Himalayan belt , stretching from Pamir - Hindukush to Arkans in Burma.According
to seismic zoning map of India , Dehradun city lies in Zone 4 and expected MSK intensity 8
.Dehradun city is located in the vicinity of twenty four independent seismic source zones which in
reality are active faults. This creates uncertainties in size , location and the rate of recurrence of
earthquakes. Probabilistic seismic hazard analysis provides a framework in which these uncertainties
can be identified , quantified and combined in a rational manner to provide a more complete picture
of the seismic hazard . This study presents a PSHA of the Dehradun city using the attenuation
relationship given by Cornell et al (1979) in order to determinate various levels of earthquake-caused
ground motion that will be exceeded in a given future time period.
Keywords: seismic source zones , active faults , attenuation relationship , recurrence of earthquakes
, seismic hazard , fault length , uncertainties
2. Probabilistic Seismic Hazard Analysis Of Dehradun…
www.ijceronline.com Open Access Journal Page 24
Dehradun city is encompassed betwee two major active fault systems , the Main Boundary Thrust (MBT ) and
the Main Frontal Thrust (MFT) , has experienced many disastrous earthquakes in the past . This city of
approximately 500,000 inhabitants in the foothills of Himalayas is characterized by a considerable seismic
hazard (Lang et al. , 2012 ) .Existence of densely populated , very old traditional stone buildings to new
masonry and RC buildings , generally without the implementation of seismic code demonstrate the need for and
challenges in the seismic hazard assessment of the city .
The seismic vulnerability of Dehradun is clearly justified, however study of the seismic hazard potential of the
valley has not been performed systematically. The seismic hazard potential of a site is identified by conducting
probabilistic seismic hazard analysis and constructing hazard curves. Hazard curve is a graphical representation
of seismic intensity parameter such as peak ground acceleration and its annual probability of exceedence. It
requires the identification of seismic source zones affecting the site, rate of recurrence of earthquake at each
source, distance from each source to the site, probability density function of magnitude and systematic
synthesizing of these to obtain the probability of exceedence of certain peak ground acceleration at the site due
to all sources in its vicinity.
II. Numerical Study
The seismic hazard curve does not vary significantly across the length and breadth of the city due to its small
size thus making it cogent to consider only the centre of the city. The twenty four independent seismic source
zones, near the centre of Dehradun, which in reality are active faults are characterized in table 2 :
SOURCE
ZONE
EQ
SOURCES(Faults)
FAULT
TYPE
FAULT
LENGTH(KM)
MAGNITUDE
(Mmax)
a b DISTANCE
(KM)
1 MCT RF 489.6534 7.7 4.79 .84 163.2178
2 AF RF 50.0452 6.5 4.79 .84 16.68173
3 MBT RF 605.287 7.8 4.79 .84 201.7623
4 ISZ RF 102.6068 6.9 4.79 .84 34.20226
5 MCT 1 RF 574.5193 7.8 4.79 1 191.5064
6 MF RF 27.42032 6.1 4.79 1 9.140160
7 MFT RF 113.9163 6.9 4.79 1 37.97209
8 NAT RF 245.923 7.3 4.79 1 81.97434
9 RT RF 184.2846 7.2 4.79 1 61.4282
10 SAT RF 98.63989 6.8 4.79 1 32.87996
11 TZ-2 RF 98.67167 6.8 4.79 1 32.89056
12 TZ-1 RF 172.4367 7.1 4.79 1 57.4789
13 TZ-3 RF 248.1017 7.3 4.79 1 82.70057
14 TZ-4 RF 76.76542 6.7 4.79 1 25.58847
15 TZ-5 RF 154.684 7.1 4.79 1 51.54932
16 G-4 RF 45.92785 6.4 4.79 1 15.30928
17 DT RF 133.9915 7 4.79 1 44.66382
18 G-1 SS 17.02207 6 4.79 1 5.674022
19 G-2 SS 32.6743 6.3 4.79 1 10.89143
20 G-3 SS 21.02778 6.1 4.79 1 7.00926
21 MBF SS 149.095 7 4.79 1 49.69834
22 R-1 SS 16.09106 6 4.79 1 5.363685
23 MORADABAD NF 36.30643 6.3 4.79 1 12.10214
24 KFS NF 43.29493 6.4 4.79 1 14.43164
TABLE 2 : Characteristics of seismic sources and magnitudes
Mean Annual Occurrence Rate :
The threshold magnitude is taken as 4.5 since smaller magnitude earthquakes are not believed to be capable of
damaging structures and are thus unnecessary to consider for seismic hazard analysis. The mean annual
occurrence rate of earthquake (ν) of magnitude larger than the threshold magnitude (mo=4.5) calculated for each
source using Guttenberg-Ritcher recurrence law is divided by 16.
3. Probabilistic Seismic Hazard Analysis Of Dehradun…
www.ijceronline.com Open Access Journal Page 25
𝑣𝑖 =
10 𝑎−𝑏 𝑚 0
16
(i = 1,2,3.....for all 24 sources)
Where , a = overall occurrence rate of earthquake for each source
b = relative ratio of small and large magnitudes for each source
The mean annual occurrence rate of earthquake greater than magnitude 4.5 at each source is tabulated in Table3.
SOURCE MEAN ANNUAL
OCCURRENCE
RATE(ν)
1 0.6395
2 0.6395
3 0.6395
4 0.6395
5 0.1218
6 0.1218
7 0.1218
8 0.1218
9 0.1218
10 0.1218
11 0.1218
12 0.1218
13 0.1218
14 0.1218
15 0.1218
16 0.1218
17 0.1218
18 0.1218
19 0.1218
20 0.1218
21 0.1218
22 0.1218
23 0.1218
24 0.1218
TABLE 3 : Mean annual occurrence rate of 10 sources
Probability Density Function Of Magnitude :
Each source is capable of producing earthquakes with a variety of magnitudes with an upper bound of maximum
moment magnitude (Mw,max) and a common lower bound of the threshold magnitude (mo = 4.5). The total range
of earthquake magnitudes is divided into 7 equal intervals for all sources.
m1 - mu 4.5-5.0 5.0- 5.5 5.5-6.0 6.0-6.5 6.5-7.0 7.0-7.5 7.5-8.0
Mean (m) 4.75 5.25 5.75 6.25 6.75 7.25 7.75
TABLE 4: Discretization of earthquake magnitudes
Each interval is discretely represented by its mean value. If the value of maximum moment magnitude of any
source lies within any particular interval, the interval will have an upper bound value equal to the same
maximum moment magnitude. The distribution of the earthquakes of various magnitude is assumed to follow
Bounded Guttenberg-Ritcher model.
There are three cases now :
5. Probabilistic Seismic Hazard Analysis Of Dehradun…
www.ijceronline.com Open Access Journal Page 27
FIGURE 2 : Probability density function of magnitude
Probability Of Exceeding Certain Peak Ground Acceleration Level Provided A Fixed
Magnitude Of Earthquake :
The attenuation relationship used for the Probabilistic Seismic Hazard Analysis is the one proposed by Cornell
et al. (1979) for the mean of natural logarithm of Peak ground acceleration .
ln PGA = 6.74 + 0.859 M – 1.80 ln (R+25)
where, PGA is in gal and ϭ = ϭln PGA = 0.57
The natural log of PGA is normally distributed, so the conditional probability of exceeding any PGA level
(PGA*) is,
P (PGA>PGA* | M=m, R=r) = 1 - Ф
𝑙𝑛 𝑃𝐺𝐴∗−ln 𝑃𝐺𝐴
ϭ
where, Ф( ) is the standard normal cumulative distribution function.
A total of 60 PGA levels starting from 0.01g m/s2
(9.81 gals) to 0.6g m/s2
(588.6 gals), i.e., ln(PGA*) have been
considered in this hazard analysis.
All the source zones are point sources, so each source to site distance R is known to be r, consequently the
probability of R = r is 1 and the probability of R ≠ r is 0.
P(R = r) = 1 and P(R ≠ r) = 0
6. Probabilistic Seismic Hazard Analysis Of Dehradun…
www.ijceronline.com Open Access Journal Page 28
Probability Of Exceeding Certain Peak Ground Acceleration Level :
Since all continuous distributions for M and R have been discretized, so the total probability of exceeding
certain PGA level is given by,
λ (PGA > PGA*) = 𝜈
𝑛 𝑠
𝑖=1 𝑀𝑖 > 𝑀0 𝑃
𝑛 𝑟
𝑘=1 𝑃𝐺𝐴 > 𝑃𝐺𝐴∗
| 𝑚𝑗 , 𝑟𝑘
𝑛 𝑚
𝑗=1 P 𝑀𝑖 = 𝑚𝑗 P ( 𝑅𝑖 = 𝑟𝑘
where, the range of possible Mi and Ri has been discretized to nM and nR intervals respectively. In this analysis,
ns = 24 sources, nm = 7 and nr = 1
λ (PGA > PGA*) = 𝜈10
𝑖=1 𝑀𝑖 > 𝑀0 𝑃 𝑃𝐺𝐴 > 𝑃𝐺𝐴∗
| 𝑚𝑗 , 𝑟 𝑃 𝑀𝑖 = 𝑚𝑗
6
𝑗=1
The total probability of exceeding certain PGA level is tabulated in table6.
PGA*
(Times
g)
λ(PGA>PGA*
)
0.01 0.16689
0.02 0.11221
0.03 0.0666
0.04 0.04626
0.05 0.03326
0.06 0.02451
0.07 0.0183
0.08 0.01401
0.09 0.01187
0.1 0.00849
0.11 0.00748
0.12 0.00516
0.13 0.00407
0.14 0.00321
0.15 0.00345
0.16 0.00289
0.17 0.00245
0.18 0.00217
0.19 0.00176
0.2 0.00153
0.21 0.00132
0.22 0.00124
0.23 0.00106
0.24 0.00093
0.25 0.00084
0.26 0.00072
0.27 0.00062
0.28 0.00058
0.29 0.00051
0.3 0.00049
0.31 0.00047
0.32 0.00041
7. Probabilistic Seismic Hazard Analysis Of Dehradun…
www.ijceronline.com Open Access Journal Page 29
0.33 0.00036
0.34 0.00033
0.35 0.0003
0.36 0.00029
0.37 0.00025
0.38 0.00023
0.39 0.00022
0.4 0.00018
0.41 0.00017
0.42 0.00016
0.43 0.00015
0.44 0.00014
0.45 0.00013
0.46 0.00011
0.47 0.0001
0.48 0.0001
0.49 0.00009
0.5 0.00009
0.51 0.00008
0.52 0.00008
0.53 0.00007
0.54 0.00007
0.55 0.00006
0.56 0.00006
0.57 0.00005
0.58 0.00004
0.59 0.00003
0.6 0.00003
TABLE6: λ( 𝑃𝐺𝐴 > 𝑃𝐺𝐴∗) 𝑓𝑜𝑟 𝑐𝑢𝑚𝑢𝑙𝑎𝑡𝑖𝑣𝑒 𝑒𝑓𝑓𝑒𝑐𝑡 𝑜𝑓 𝑎𝑙𝑙 24 𝑠𝑜𝑢𝑟𝑐𝑒𝑠
Poisson’s Model :
The temporal occurrence of earthquake is described by using Poisson's model since the events of earthquake
occurrence are assumed to be independent of each other in time and space. The rate of exceeding a certain PGA
level atleast once in a period of "t" years is given by,
P (N≥1) = 1 – 𝑒−𝜆𝑡
The rate or probability of exceeding a range of PGA levels atleast once in 1 year, 50 years and 100 years is
tabulated in table7.
PGA* (times g) 1-exp(-λt)
All sources and t=1 yrs
1-exp(-λt)
All sources and t=50 yrs
1-exp(-λt)
All sources and t=100 yrs
0.01 0.153707 0.999762 1
0.02 0.106143 0.996341 0.999987
0.03 0.064431 0.964207 0.998719
0.04 0.045206 0.901036 0.990206
0.05 0.032713 0.810431 0.964063
0.06 0.024212 0.706389 0.913793
0.07 0.018134 0.599483 0.839586
0.08 0.013912 0.503663 0.75365
0.09 0.0118 0.447609 0.694865
9. Probabilistic Seismic Hazard Analysis Of Dehradun…
www.ijceronline.com Open Access Journal Page 31
Seismic Hazard Curve :
Seismic hazard curve gives a strong basis for analyzing the seismic hazard potential at a site. The seismic hazard
curve presented in figure4 gives the probability of exceedence of certain PGA level (from 0.01g to 0.6g where g
= 9.81m/s2
) at the Dehradun city in 1 year, 50 years and 100 years.
FIGURE 3: Seismic Hazard Curve
0
0.2
0.4
0.6
0.8
1
1.2
0 0.1 0.2 0.3 0.4 0.5 0.6 0.7
Rateofexceedence
PGA (times g) m/s2
Seismic Hazard Curve
t=1yr
t=50yr
t=100yr
10. Probabilistic Seismic Hazard Analysis Of Dehradun…
www.ijceronline.com Open Access Journal Page 32
Conclusion
The probability density function for magnitude lends credible support to the frequent occurrence of moderate
earthquakes and occasional occurrence of disastrous earthquakes. Earthquake source zone 3 (MBT) and 7
(MFT) are more dangerous than the other sources as these two could induce higher magnitude which is
disruptive. If a magnitude of around 7 occurs at Dehradun, it can be inferred that source zones 3 and/or 7 have
become dominant. Out of the two, source 3 is particularly threatening because it has greater mean annual
occurrence rate of earthquake exceeding the threshold than source 7. Similarly, the probabilistic seismic hazard
analysis yields unsurprisingly high value of peak ground acceleration that is likely to occur any time in future at
Dehradun city. It is evident from the seismic hazard curve that there is a 2% rate of exceeding PGA of 0.31g in
50 years which is comparable to MMI scale of VIII and a 10% rate of exceeding PGA of 0.18g in 50 years
comparable to MMI scale of VII. The PGA level of 0.5g to 0.55g is often compared with MMI scale IX (Violent
earthquake). The probability of such an earthquake in Dehradun once in a century is around 0.007 or 0.7%; so
the apprehension for a “Big One” in Dehradun is pertinent.
References
[1] Kramer S.L. (1996). “Geotechnical Earthquake Engineering,” Prentice Hall, Eaglewood Cliffs, New Jersey.
[2] Cornell CA. (1968) “Engineering Seismic Risk Analysis.” Bulletin of the Seismological Society of America; Vol. 58, No. 5,
pp.1583-1606
[3] Baker J.W. (2008). “An Introduction to Probabilistic Seismic Hazard Analysis (PSHA)”, Version 1.3.
[4] PremNathMaskey and T.K. Datta (2004). “Risk Consistent Response Spectrum And Hazard Curve For A Typical Location Of
Kathmandu Valley” 13th World Conference on Earthquake Engineering
[5] Earthquake Catalog in BCDP (1994).
[6] URL: http://earthquaketrack.com
[7] URL: http://www.nset.org.np
[8] Anbazhagan, P., Vinod, J. S., and Sitharam, T. G. (2008), Probabilistic seismic hazard analysis for Bangalore, Nat. hazards, 8,
145–166.
[9] BIS-1893:2002. Indian Standard Criteria for Earthquake Resistant Design of Structures, Part 1 – General Provisions and
Buildings, Bureau of Indian Standards, New Delhi, India
[10] BSSC:2001 NEHRP recommended provision for seismic regulations for new buildings and other structure 2000 edition, part 1:
Provision Report no. FEMA 368,
[11] Building seismic safety council for the federal emergency management agency, Washington, DC, USA.
[12] Chandra, U. (1977), Earthquakes of peninsular India- A seismotectonic study, Bulletin of the Seismological Society of America,
67 (5), 1387-1413.
[13] Cornell, C.A. (1968), Engineering seismic risk analysis, Bull Seismol. Soc. America 58:1583–1606.
[14] Guha, S.K. , and Basu, P.C. (1993), Catalogue of earthquakes (M e” 3.0) in peninsular India, Atomic Energy Regulatory Board,
Tech. Document No. TD/ CSE-1, 1-70
[15] Jaiswal K and Sinha R. (2005). EarthquakeInfo.org: Webportal on earthquake disaster awareness in India,
http://www.earthquakeinfo.org.,
[16] Jaiswal, K. and Sinha, R. (2008), Spatial-temporal variability of seismic hazard in peninsular India, J. Earth Syst. Sci. 117, S2,
707–718.
[17] Mulargia, E. and Tinti, S. (1985), Seismic sample areas defined from incomplete catalogues : An application to the Italian
Territory, Physics of the Earth and Planetary Interiors, 40, 273-300.
[18] Iyenger, R.N. and Raghukanth, S.T.G. (2004), Attenuation of strong ground mot ion in Peninsular India, Seismological Research
Letters, 75, 530-540.
[19] Iyenger, R.N. and Ghosh, S. (2004), Microzonation of earthquake hazard in greater Delhi area, Current Science, 87, 1193-1202.
[20] SEISAT: 2000, Seismotectonic Atlas of India, Geological Survey of India.
[21] Vipin K.S, Anbazhagan P. and Sitharam T.G. (2009), Estimation of peak ground acceleration and spectral acceleration for South
India, Nat. Hazards Earth Syst. Sci., 9, 865–878.
[22] Thaker T.P., Rao K.S. and Gupta K.K. (2010), Ground response and site amplification studies for coastal soil, Kutch, Gujarat: A
case study, International Journal of Earth Science and Engineering .