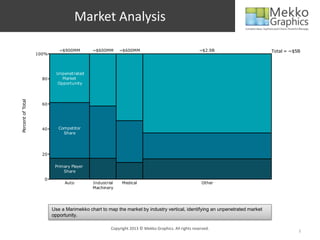
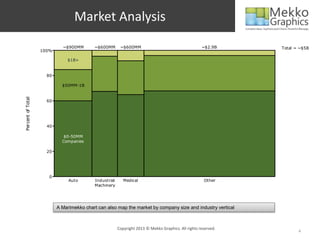
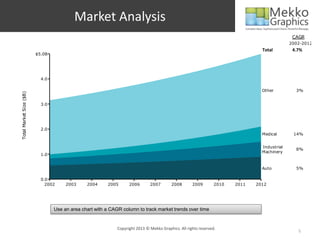
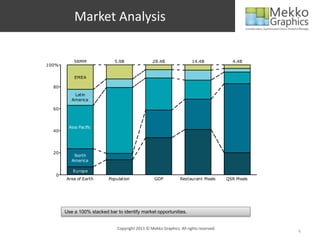
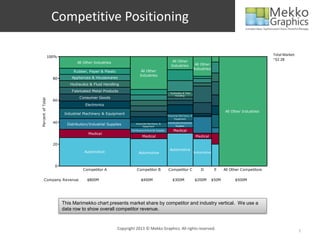
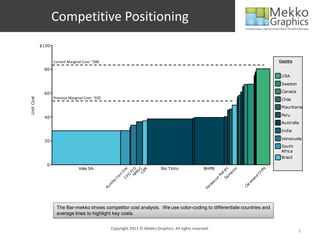
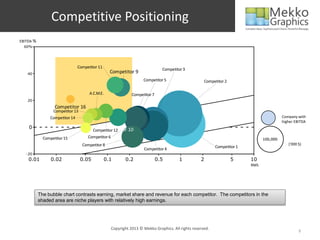
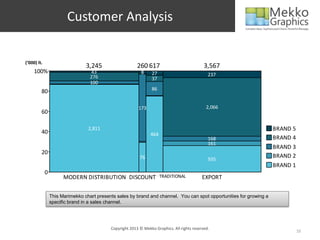
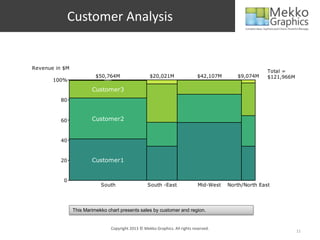
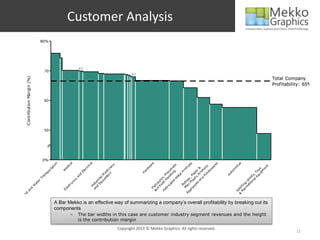
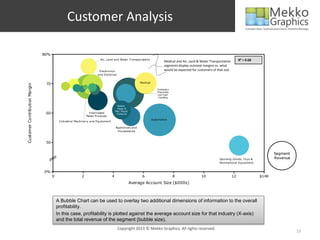
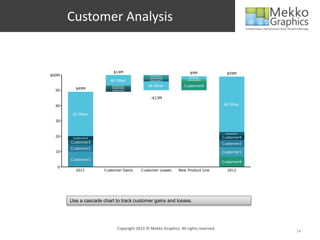
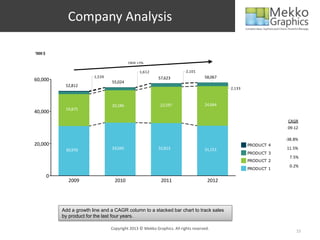
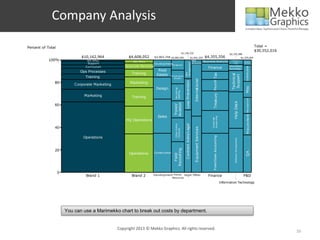
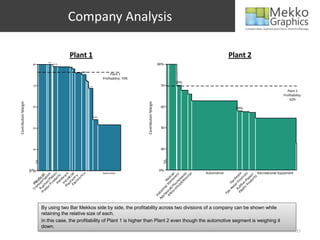
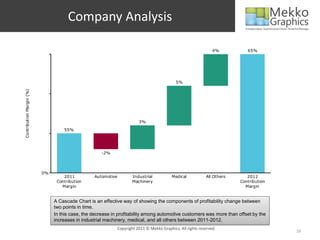
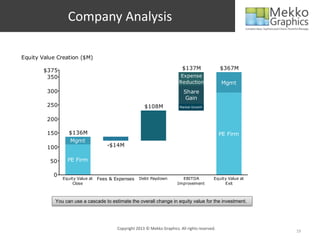
Mekko Graphics: A Tool for Strategic Due Diligence

Presented at the MIT Private Equity Symposium
April 5, 2013
Introduction

•   Mekko Graphics is used by over 75% of the top 25 private equity firms as identified by
    Private Equity International
•   It plays a critical role in all stages of the strategic due diligence process:
       • Market analysis
       • Competitive positioning
       • Customer analysis
       • Company analysis
•   Mekko Graphics supports chart types and features that are valuable for due diligence and
    not found in PowerPoint or Excel:
       • Marimekko chart
       • Bar-mekko chart
       • Cascade, waterfall or bridge chart
       • Data rows, data columns and CAGR columns that align with the chart
       • Growth lines and comparison lines
•   Mekko Graphics has over 15 years experience satisfying the charting needs of:
       • Strategy consultants
       • Private equity firms
       • Strategy and marketing professionals at Fortune 500 companies


                                 Copyright 2013 © Mekko Graphics. All rights reserved.
                                                                                               2
Market Analysis

                             ~$900MM        ~$600MM      ~$600MM                                    ~$2.9B                   Total = ~$5B
                   100%


                            Unpenetrated
                     80       Market
                            Opportunity
Percent of Total


                     60


                     40      Competitor
                               Share


                     20


                           Primary Player
                               Share
                      0
                               Auto         Industrial     Medical                                    Other
                                            Machinery


                          Use a Marimekko chart to map the market by industry vertical, identifying an unpenetrated market
                          opportunity.

                                                     Copyright 2013 © Mekko Graphics. All rights reserved.
                                                                                                                                        3
Market Analysis
                            ~$900MM       ~$600MM       ~$600MM                                     ~$2.9B     Total = ~$5B
                   100%

                              $1B+


                     80

                            $50MM-1B
Percent of Total


                     60


                     40

                             $0-50MM
                            Companies

                     20


                      0
                               Auto       Industrial      Medical                                    Other
                                          Machinery


                          A Marimekko chart can also map the market by company size and industry vertical


                                                       Copyright 2013 © Mekko Graphics. All rights reserved.
                                                                                                                      4
Market Analysis
                                                                                                                                               CAGR
                                                                                                                                              2002-2012
                                                                                                                                 Total         4.7%
                         $5.0B


                           4.0

                                                                                                                                 Other          3%
Total Market Size ($B)


                           3.0


                           2.0
                                                                                                                                 Medical       14%


                                                                                                                                 Industrial
                                                                                                                                                8%
                                                                                                                                 Machinery
                           1.0


                                                                                                                                 Auto           5%

                           0.0
                             2002     2003     2004     2005       2006       2007        2008       2009        2010   2011   2012


                                 Use an area chart with a CAGR column to track market trends over time


                                                             Copyright 2013 © Mekko Graphics. All rights reserved.
                                                                                                                                                 5
Market Analysis

           58MM              5.9B                 28.4B                14.4B             4.4B
100%

           EMEA

  80
           Latin
          America

  60


        Asia Pacific
  40


  20
           North
          America

          Europe
   0
       Area of Earth       Population              GDP          Restaurant Meals       QSR Meals


       Use a 100% stacked bar to identify market opportunities.


                               Copyright 2013 © Mekko Graphics. All rights reserved.
                                                                                                   6
Competitive Positioning

                                                                                                                                                                         Total Market:
                   100%
                                                                                                       All Other                                                         ~$2.2B
                                  All Other Industries                                                                        All Other
                                                                                                      Industries
                                                                                                                             Industries
                               Rubber, Paper & Plastic                   All Other
                                                                        Industries
                     80        Appliances & Housewares
                              Hydraulics & Fluid Handling
                               Fabricated Metal Products                                             Hydraulics & Fluid
                                                                                                         Handling
                                   Consumer Goods
Percent of Total


                     60
                                      Electronics
                                                                                                                                                 All Other Industries
                           Industrial Machinery & Equipment
                                                                                                   Industrial Machinery &
                                                                                                         Equipment
                     40     Distribution/Industrial Supplies        Industrial Machinery &         Distribution/Industrial
                                                                          Equipment                       Supplies

                                                                Distribution/Industrial Supplies        Medical
                                        Medical
                                                                          Medical                                             Medical

                     20
                                                                                                    Automotive
                                      Automotive                      Automotive                                             Automotive


                      0
                                     Competitor A                    Competitor B                  Competitor C                  D         E     All Other Competitors

        Company Revenue                $800M                             $400M                         $300M                 $200M        $50M         $500M


                          This Marimekko chart presents market share by competitor and industry vertical. We use a
                          data row to show overall competitor revenue.


                                                         Copyright 2013 © Mekko Graphics. All rights reserved.
                                                                                                                                                                                         7
Competitive Positioning
            $100


                   Current Marginal Cost: ~$80                                                                                                    Country

             80
                                                                                                                                                   USA

                                                                                                                                                   Sweden

             60                                                                                                                                    Canada
                   Previous Marginal Cost: ~$50
Unit Cost


                                                                                                                                                   Chile
                                                                                                                                                   Mauritania
                                                                                                                                                   Peru
             40
                                                                                                                                                   Australia
                                                                                                                                                   India
                                                                                                                                                   Venezuela
             20
                                                                                                                                                   South
                                                                                                                                                   Africa
                                                                                                                                                   Brazil
              0
                                 Vale SA                                          Rio Tinto              BHPB
                                                                C


                                                                                                                           s


                                                                                                                                             fs
                                                           N /O


                                                                                                                        co
                                                               re


                                                               N


                                                                                                                        al
                                                              D


                                                                                                                                         lif
                                                            CS
                                                             O


                                                                                                                     ar
                                                             F


                                                                                                                     et
                                                            M


                                                                                                                                        C
                                                          on


                                                                                                                    m
                                                           G


                                                                                                                    M


                                                                                                                                         d
                                                               CV


                                                                                                                        Sa
                                                        Ir


                                                                                                                                      an
                                                                                                                e
                                                                                                               u
                                                   ba


                                                                                                                                   el
                                                                                                                c
                                                                                                             es


                                                                                                                                 ev
                                                   m


                                                                                                           rt


                                                                                                                               Cl
                                                  Ku


                                                                                                         Fo
                    The Bar-mekko shows competitor cost analysis. We use color-coding to differentiate countries and
                    average lines to highlight key costs.


                                                       Copyright 2013 © Mekko Graphics. All rights reserved.
                                                                                                                                                            8
Competitive Positioning
EBITDA %
  60%


                             Competitor 11
                                                                            Competitor 3
   40
                                                Competitor 9
                                                                 Competitor 5                     Competitor 2

                                    A.C.M.E.               Competitor 7
   20
                   Competitor 16
                 Competitor 13
                Competitor 14                                                                                                          Company with
                                                                                                                                       higher EBITDA
    0                                      Competitor 10
                                      Competitor 12
             Competitor 15          Competitor 6                                                                             100,000
                                 Competitor 8                                                                                             (‘000 $)
                                                                 Competitor 4                           Competitor 1
   -20
    0.01         0.02            0.05        0.1       0.2                0.5       1           2                5     10
                                                                                                                       RMS


           The bubble chart contrasts earning, market share and revenue for each competitor. The competitors in the
           shaded area are niche players with relatively high earnings.


                                                Copyright 2013 © Mekko Graphics. All rights reserved.
                                                                                                                                                9
Customer Analysis


(‘000) lt.
                                 3,245                    260 617                             3,567
     100%                          43                       8     27                            237
                                   276                            37
                                   100
                                                                  86
         80

                                                          173                                  2,066
         60

                                  2,811                                                                               BRAND 5
         40                                                      464
                                                                                                168                   BRAND 4
                                                                                                161
                                                                                                                      BRAND 3
         20
                                                           76                                                         BRAND 2
                                                                                                935
                                                                                                                      BRAND 1
             0
                       MODERN DISTRIBUTION DISCOUNT                    TRADITIONAL           EXPORT

                 This Marimekko chart presents sales by brand and channel. You can spot opportunities for growing a
                 specific brand in a sales channel.


                                            Copyright 2013 © Mekko Graphics. All rights reserved.
                                                                                                                                10
Customer Analysis


Revenue in $M
                                                                                                           Total =
                          $50,764M                     $20,021M                  $42,107M      $9,074M     $121,966M
       100%                   others


                        Customer3
          80


          60            Customer2


          40


          20            Customer1


           0
                            South                     South -East                Mid-West   North/North East


                This Marimekko chart presents sales by customer and region.


                                   Copyright 2013 © Mekko Graphics. All rights reserved.
                                                                                                                       11
Customer Analysis
                                         80%


                                                                          0.7
                                            70
                                                                                                                   0.7

                                                                                                                                                                                                        Total Company
         Contribution Margin (%)


                                                                                                                                                                                                        Profitability: 65%


                                            60


                                            50


                                            0%
                                                               l


                                                                                                       al
                                                    n


                                                                                                                               e


                                                                                                                                                                                                    e
                                                                                                                                                              ts


                                                                                                                                                             es
                                                             a


                                                                                                                             ar
                                                  io


                                                                                                    ry


                                                                                                                                                                                                 iv
                                                                                                                                                      g tic
                                                          ic


                                                                                                    ic


                                                                                                                                                            uc


                                                                                                                                                           ar


                                                                                                                                                                                                t
                                                                                                                                                    ou t s


                                                                                                                                                                                              ot


                                                                                                                                                                                             en
                                                                                                  tr
                                                        ed


                                                                                                                           dw
                                                    t


                                                                                             t ne


                                                                                                                                                    in a


                                                                                                                                                         od
                                                 ta


                                                                                                                                            a n Pr o &
                                                                                                                                                 H uc

                                                                                                                                                          w


                                                                                                                                                                                       u i ys
                                                                                                                                                 dl um


                                                                                                                                                                        m
                                                                            ec


                                                                                                                                                                                          pm
                                                                                           en chi
                                                        M
                                              or


                                                                                                                         ar


                                                                                                                                                       se
                                                                                                                                        es ic er
                                                                                                                                                        d
                                                                                                                                                      Pr


                                                                                                                                                                      to


                                                                                                                                                                                     Eq To
                                                                          El
                                            sp


                                                                                                                                               an e
                                                                                                                         H


                                                                                                                                                   ap
                                                                                        pm a


                                                                                                                                                                    Au
                                                                                                                                            H Pn


                                                                                                                                                   al
                                                                       d


                                                                                                                                                                                   al ,
                                                                                      ui l M
                                          an


                                                                                                                                                                                  n s
                                                                     an


                                                                                                                                 l ia Pla , P
                                                                                                                                                et


                                                                                                                                                                                io od
                                        Tr


                                                                                                                                          d ,


                                                                                                                                               d
                                                                                    Eq ria


                                                                                                                                        ui c s


                                                                                                                                              M


                                                                                                                                     nc s t
                                                                                                                                        c r


                                                                                                                                                                              at o
                                                                     cs


                                                                                                                                     is be
                                                                                                                                     Fl l i
                                       er


                                                                                                                                           ed
                                                                                  d st


                                                                                                                                                                            re G
                                                                  ni


                                                                                                                                   d rau


                                                                                                                                    M ub
                                                                                an du
                                   at


                                                                                                                                                                          ec ng
                                                                                                                                        at
                                                               ro


                                                                                                                                      R
                                   W


                                                                                  In


                                                                                                                               an yd


                                                                                                                                     ic


                                                                                                                                                                         R ti
                                                            ct


                                                                                                                                   br


                                                                                                                                                                        & por
                                                         le


                                                                                                                                   H
           d
         an


                                                                                                                               Fa
                                                        E


                                                                                                                              pp


                                                                                                                                                                         S
                                                                                                                             A
        nd
   La
 i r,


                                                    A Bar Mekko is an effective way of summarizing a company’s overall profitability by breaking out its
A


                                                    components
                                                                –         The bar widths in this case are customer industry segment revenues and the height
                                                                          is the contribution margin
                                                                                                            Copyright 2013 © Mekko Graphics. All rights reserved.
                                                                                                                                                                                                                  12
Customer Analysis

                               80%
                                                                     Air, Land and Water Transportation                                                                      R² = 0.68
                                                                                                                         Medical and Air, Land & Water Transportation
                                                                                                                         segments display outsized margins vs. what
                                                                    Electronics                                          would be expected for customers of that size
                                                                   and Electrical

                                                                                                       Medical
                                70
Customer Contribution Margin


                                                                                                                 Hydraulics
                                                                                                                 Pneumatic
                                                                                                                  and Fluid
                                                                                                         Hardware Handling

                                                                                     Rubber
                                                                                     Paper &
                                                                                   Misc Plastic
                                60                            Fabricated            Products
                                                            Metal Products
                                                                                                                 Automotive
                                          Industrial Machinery and Equipment

                                                                                   Appliances and
                                                                                    Housewares


                                50


                                                                                                                                                                                                Segment
                                                                                                                                                             Sporting Goods, Toys &             Revenue
                                                                                                                                                             Recreational Equipment


                               0%
                                     0                  2                      4                        6                     8                  10                     12               $14K
                                                                                                  Average Account Size ($000s)


                                         A Bubble Chart can be used to overlay two additional dimensions of information to the overall
                                         profitability.
                                         In this case, profitability is plotted against the average account size for that industry (X-axis)
                                         and the total revenue of the segment (bubble size).
                                                                                     Copyright 2013 © Mekko Graphics. All rights reserved.
                                                                                                                                                                                                          13
Customer Analysis


                          $14M                                      $9M                $59M
$60M                                          Customer1
                                              Customer8            All Other
                         All Other            Customer3           Customer10

                          Customer7          All Other           Customer9
         $49M             Customer6
  50                      Customer5


                                              -$13M

  40                                                                                 All Other

        All Other
  30


                                                                                      Customer3
  20    Customer4                                                                    Customer4
       Customer3                                                                     Customer2
       Customer2
  10                                                                                 Customer1

       Customer1
                                                                                     Customer9
   0
         2011         Customer Gains     Customer Losses      New Product Line         2012


       Use a cascade chart to track customer gains and losses.


                             Copyright 2013 © Mekko Graphics. All rights reserved.
                                                                                                  14
Company Analysis

‘000 $

                                            CAGR +3%


                                                  1,612                    2,101
                           1,539                            57,623                   58,067
60,000                             55,024
              52,812
                                                                                              2,133


                                   20,186                    22,597                  24,684
              19,875
40,000
                                                                                                                   CAGR
                                                                                                                   09-12

                                                                                                                  -38.8%
20,000                                                                                                PRODUCT 4
              30,970               33,045                   32,813                   31,151                       11.5%
                                                                                                      PRODUCT 3
                                                                                                                   7.5%
                                                                                                      PRODUCT 2
                                                                                                                   0.2%
                                                                                                      PRODUCT 1
         0
               2009                  2010                     2011                     2012


             Add a growth line and a CAGR column to a stacked bar chart to track sales
             by product for the last four years.

                                   Copyright 2013 © Mekko Graphics. All rights reserved.
                                                                                                                       15
Company Analysis

Percent of Total                                                                                                                                                                                                                                Total =
                                                                                                                                                                                                                                                $30,552,016
                                                                                                        $1,136,232                                                                         $2,335,588
                              $10,162,964              $4,608,052       $2,903,704 $2,083,092                                   $1,641,224 $4,355,556                                                                   $1,325,604
            100%                 CEO Office               CEO Office                                                             CEO       Business Analysis
                                                                                                                                                                                             Telephony /
                                                                                                                                                                                                                          Int ernat i onal

                                 Support                                Development agemen t                                     Assistant
                                                                                                                                                                                               Comm /                      Purchasi ng


                                                                                                           Management
                                                                                                                                                                                                 Web                      /D i st ri but i on

                                                                                  Man
                                                     Corporate Marketing                                                                                                                   Information
                                Curriculum                                                                                                               Finance


                                                                                                                                                                                                                             Distribution
                                                                                                                                                                                           Technology
                             Ops Processes                                 Real
                                                         Training


                                                                                                           Risk
                                                                          Estate


                                                                                                                                                            Treas ury Pa yroll Tax


                                                                                                                                                                                             Technic al
                                                                                                                                                                                              Su pport
                               Training                                             Compen sat ion /
                                                                                       Ben efit s


                                                                                                                                   Internat ional
                                                                                                           Loss Prevention
               80          Corporate Marketing          Marketing


                                                                                                                                                                                                                            Misc
                                                                          Design


                                                                                         Recruiti ng/
                                                                                         Staffing
                                Marketing                Training


                                                                                                                                                                                                                               Man agement
                                                                                                                                                                                               Help Des k
                                                                                        Aviation
               60


                                                                                        Travel/
                                                                          Sales


                                                                                                                                                                                                                             Procure me nt
                                                                                                                                                           Accoun ting
                                                                                                                                                           Corpor ate
                                                     HQ Operations


                                                                                                           Contract Adm/Legal
                                                                                         Other A dmin
               40


                                                                                                                                   E quipment Services
                                                                                         S ervices
                               Operations


                                                                                                                                                            Franchisee Accounting


                                                                                                                                                                                                 Software Development
               20


                                                                                        Recruit ing


                                                                                                                                                                                                                            QA
                                                       Operations       Construction


                                                                                          Field
                   0
                                Brand 1                  Brand 2        Development Human Legal Other                                                    Finance                                                          P&D
                                                                                       Resources

                                                                                                                                                                                     Information Technology


                       You can use a Marimekko chart to break out costs by department.


                                                 Copyright 2013 © Mekko Graphics. All rights reserved.
                                                                                                                                                                                                                                                              16
Company Analysis

                                           Plant 1                                                                                                      Plant 2
                               84%
                       80            79%                                                                      80%

                                               75%
                                                                       Plant 1
                                                                 Profitability: 70%
                                                                                                                           70%
                       70                            69%                                                        70
                                                                                                                                                                                              Plant 2
                                                                                                                                                                                            Profitability:
                                                                                                                                                                                                62%
Contribution Margin


                                                                                      Contribution Margin
                       60                                                                                       60                                          58%
                                                                                                                                                                  Total Custom
                                                           54%                                                                                                    57%


                       50                                                                                       50


                       40                                                                                       40


                      0%                                         Automotive
                                                                                                               0%
                                                                                                                                           Automotive                       Recreational Equipment
                                H uc t /

                              M d u ar e


                                          cs


                                                                                                                                                        Pl ub ro re
                               E in e ial


                                                                                                                                  tr s


                                                                                                                                                              c /P ts
                               P Pa n


                                                                                                                    tr Ho hi n al


                                                                                                                                      al
                                                                                                                              se ry
                                    d er


                                                                                                                                                                   u c r/
                         as b ta l


                                                                                                                                ec e
                           ti c er/ ti o


                                   ar s


                                                                                                                               c ic


                                                                                                                                    ic


                                                                                                                                                            ti er uc
                                   ct ry
                            ub r a


                                                                                                                                                           R l P wa
                                        ni


                                                                                                                             E l ar
                                                                                                                                    e


                                                                                                                                                                 od pe
                                                                                                                                                                      ts
                                   h r
                                 ro p


                                In w
                               ac st


                                                                                                              E l c e M a ed
                          R s po ic


                                     ro


                                                                                                                                                                    d
                                                                                                                           s/ w


                                                                                                                                                               a d


                                                                                                                                                               Pr a
                                     d
                                    d


                                                                                                                 ia ial M


                                                                                                                                                             et r
                            an e


                                                                                                                                                           M Ha
                                le


                                                                                                                      on u
                         Tr M


                                                                                                                                                          as b
                                                                                                                        ic
                                                                                                                  ec s/
                                                                                                              p l tr
                                                                                                            Ap dus


                                                                                                                                                       b
                      Pl


                                                                                                                   n


                                                                                                                                                    Fa
                                                                                                              In


                            By using two Bar Mekkos side by side, the profitability across two divisions of a company can be shown while
                            retaining the relative size of each.
                            In this case, the profitability of Plant 1 is higher than Plant 2 even though the automotive segment is weighing it
                            down.
                                                                                                                                                                                                     17
Company Analysis

                                                                                                                 4%          65%


                                                                                             5%
Contribution Margin (%)


                                                                         3%
                                   55%


                                                     -2%


                          0%
                                   2011          Automotive           Industrial           Medical           All Others      2012
                                Contribution                          Machinery                                           Contribution
                                  Margin                                                                                    Margin


                               A Cascade Chart is an effective way of showing the components of profitability change between
                               two points in time.
                               In this case, the decrease in profitability among automotive customers was more than offset by the
                               increases in industrial machinery, medical, and all others between 2011-2012.
                                                              Copyright 2013 © Mekko Graphics. All rights reserved.
                                                                                                                                         18
Company Analysis

Equity Value Creation ($M)

        $375                                                                $137M                $367M
         350                                                               Expense
                                                                          Reduction              Mgmt
         300                                                                Share
                                                                             Gain
         250                                           $108M              Market Growth


         200

         150      $136M                                                                          PE Firm
                  Mgmt
         100                         -$14M


          50     PE Firm

           0
               Equity Value at   Fees & Expenses    Debt Paydown           EBITDA            Equity Value at
                    Close                                                Improvement              Exit


            You can use a cascade to estimate the overall change in equity value for the investment.


                                         Copyright 2013 © Mekko Graphics. All rights reserved.
                                                                                                               19

Private Equity Strategic Due Diligence

  • 1.
    Mekko Graphics: ATool for Strategic Due Diligence Presented at the MIT Private Equity Symposium April 5, 2013
  • 2.
    Introduction • Mekko Graphics is used by over 75% of the top 25 private equity firms as identified by Private Equity International • It plays a critical role in all stages of the strategic due diligence process: • Market analysis • Competitive positioning • Customer analysis • Company analysis • Mekko Graphics supports chart types and features that are valuable for due diligence and not found in PowerPoint or Excel: • Marimekko chart • Bar-mekko chart • Cascade, waterfall or bridge chart • Data rows, data columns and CAGR columns that align with the chart • Growth lines and comparison lines • Mekko Graphics has over 15 years experience satisfying the charting needs of: • Strategy consultants • Private equity firms • Strategy and marketing professionals at Fortune 500 companies Copyright 2013 © Mekko Graphics. All rights reserved. 2
  • 3.
    Market Analysis ~$900MM ~$600MM ~$600MM ~$2.9B Total = ~$5B 100% Unpenetrated 80 Market Opportunity Percent of Total 60 40 Competitor Share 20 Primary Player Share 0 Auto Industrial Medical Other Machinery Use a Marimekko chart to map the market by industry vertical, identifying an unpenetrated market opportunity. Copyright 2013 © Mekko Graphics. All rights reserved. 3
  • 4.
    Market Analysis ~$900MM ~$600MM ~$600MM ~$2.9B Total = ~$5B 100% $1B+ 80 $50MM-1B Percent of Total 60 40 $0-50MM Companies 20 0 Auto Industrial Medical Other Machinery A Marimekko chart can also map the market by company size and industry vertical Copyright 2013 © Mekko Graphics. All rights reserved. 4
  • 5.
    Market Analysis CAGR 2002-2012 Total 4.7% $5.0B 4.0 Other 3% Total Market Size ($B) 3.0 2.0 Medical 14% Industrial 8% Machinery 1.0 Auto 5% 0.0 2002 2003 2004 2005 2006 2007 2008 2009 2010 2011 2012 Use an area chart with a CAGR column to track market trends over time Copyright 2013 © Mekko Graphics. All rights reserved. 5
  • 6.
    Market Analysis 58MM 5.9B 28.4B 14.4B 4.4B 100% EMEA 80 Latin America 60 Asia Pacific 40 20 North America Europe 0 Area of Earth Population GDP Restaurant Meals QSR Meals Use a 100% stacked bar to identify market opportunities. Copyright 2013 © Mekko Graphics. All rights reserved. 6
  • 7.
    Competitive Positioning Total Market: 100% All Other ~$2.2B All Other Industries All Other Industries Industries Rubber, Paper & Plastic All Other Industries 80 Appliances & Housewares Hydraulics & Fluid Handling Fabricated Metal Products Hydraulics & Fluid Handling Consumer Goods Percent of Total 60 Electronics All Other Industries Industrial Machinery & Equipment Industrial Machinery & Equipment 40 Distribution/Industrial Supplies Industrial Machinery & Distribution/Industrial Equipment Supplies Distribution/Industrial Supplies Medical Medical Medical Medical 20 Automotive Automotive Automotive Automotive 0 Competitor A Competitor B Competitor C D E All Other Competitors Company Revenue $800M $400M $300M $200M $50M $500M This Marimekko chart presents market share by competitor and industry vertical. We use a data row to show overall competitor revenue. Copyright 2013 © Mekko Graphics. All rights reserved. 7
  • 8.
    Competitive Positioning $100 Current Marginal Cost: ~$80 Country 80 USA Sweden 60 Canada Previous Marginal Cost: ~$50 Unit Cost Chile Mauritania Peru 40 Australia India Venezuela 20 South Africa Brazil 0 Vale SA Rio Tinto BHPB C s fs N /O co re N al D lif CS O ar F et M C on m G M d CV Sa Ir an e u ba el c es ev m rt Cl Ku Fo The Bar-mekko shows competitor cost analysis. We use color-coding to differentiate countries and average lines to highlight key costs. Copyright 2013 © Mekko Graphics. All rights reserved. 8
  • 9.
    Competitive Positioning EBITDA % 60% Competitor 11 Competitor 3 40 Competitor 9 Competitor 5 Competitor 2 A.C.M.E. Competitor 7 20 Competitor 16 Competitor 13 Competitor 14 Company with higher EBITDA 0 Competitor 10 Competitor 12 Competitor 15 Competitor 6 100,000 Competitor 8 (‘000 $) Competitor 4 Competitor 1 -20 0.01 0.02 0.05 0.1 0.2 0.5 1 2 5 10 RMS The bubble chart contrasts earning, market share and revenue for each competitor. The competitors in the shaded area are niche players with relatively high earnings. Copyright 2013 © Mekko Graphics. All rights reserved. 9
  • 10.
    Customer Analysis (‘000) lt. 3,245 260 617 3,567 100% 43 8 27 237 276 37 100 86 80 173 2,066 60 2,811 BRAND 5 40 464 168 BRAND 4 161 BRAND 3 20 76 BRAND 2 935 BRAND 1 0 MODERN DISTRIBUTION DISCOUNT TRADITIONAL EXPORT This Marimekko chart presents sales by brand and channel. You can spot opportunities for growing a specific brand in a sales channel. Copyright 2013 © Mekko Graphics. All rights reserved. 10
  • 11.
    Customer Analysis Revenue in$M Total = $50,764M $20,021M $42,107M $9,074M $121,966M 100% others Customer3 80 60 Customer2 40 20 Customer1 0 South South -East Mid-West North/North East This Marimekko chart presents sales by customer and region. Copyright 2013 © Mekko Graphics. All rights reserved. 11
  • 12.
    Customer Analysis 80% 0.7 70 0.7 Total Company Contribution Margin (%) Profitability: 65% 60 50 0% l al n e e ts es a ar io ry iv g tic ic ic uc ar t ou t s ot en tr ed dw t t ne in a od ta a n Pr o & H uc w u i ys dl um m ec pm en chi M or ar se es ic er d Pr to Eq To El sp an e H ap pm a Au H Pn al d al , ui l M an n s an l ia Pla , P et io od Tr d , d Eq ria ui c s M nc s t c r at o cs is be Fl l i er ed d st re G ni d rau M ub an du at ec ng at ro R W In an yd ic R ti ct br & por le H d an Fa E pp S A nd La i r, A Bar Mekko is an effective way of summarizing a company’s overall profitability by breaking out its A components – The bar widths in this case are customer industry segment revenues and the height is the contribution margin Copyright 2013 © Mekko Graphics. All rights reserved. 12
  • 13.
    Customer Analysis 80% Air, Land and Water Transportation R² = 0.68 Medical and Air, Land & Water Transportation segments display outsized margins vs. what Electronics would be expected for customers of that size and Electrical Medical 70 Customer Contribution Margin Hydraulics Pneumatic and Fluid Hardware Handling Rubber Paper & Misc Plastic 60 Fabricated Products Metal Products Automotive Industrial Machinery and Equipment Appliances and Housewares 50 Segment Sporting Goods, Toys & Revenue Recreational Equipment 0% 0 2 4 6 8 10 12 $14K Average Account Size ($000s) A Bubble Chart can be used to overlay two additional dimensions of information to the overall profitability. In this case, profitability is plotted against the average account size for that industry (X-axis) and the total revenue of the segment (bubble size). Copyright 2013 © Mekko Graphics. All rights reserved. 13
  • 14.
    Customer Analysis $14M $9M $59M $60M Customer1 Customer8 All Other All Other Customer3 Customer10 Customer7 All Other Customer9 $49M Customer6 50 Customer5 -$13M 40 All Other All Other 30 Customer3 20 Customer4 Customer4 Customer3 Customer2 Customer2 10 Customer1 Customer1 Customer9 0 2011 Customer Gains Customer Losses New Product Line 2012 Use a cascade chart to track customer gains and losses. Copyright 2013 © Mekko Graphics. All rights reserved. 14
  • 15.
    Company Analysis ‘000 $ CAGR +3% 1,612 2,101 1,539 57,623 58,067 60,000 55,024 52,812 2,133 20,186 22,597 24,684 19,875 40,000 CAGR 09-12 -38.8% 20,000 PRODUCT 4 30,970 33,045 32,813 31,151 11.5% PRODUCT 3 7.5% PRODUCT 2 0.2% PRODUCT 1 0 2009 2010 2011 2012 Add a growth line and a CAGR column to a stacked bar chart to track sales by product for the last four years. Copyright 2013 © Mekko Graphics. All rights reserved. 15
  • 16.
    Company Analysis Percent ofTotal Total = $30,552,016 $1,136,232 $2,335,588 $10,162,964 $4,608,052 $2,903,704 $2,083,092 $1,641,224 $4,355,556 $1,325,604 100% CEO Office CEO Office CEO Business Analysis Telephony / Int ernat i onal Support Development agemen t Assistant Comm / Purchasi ng Management Web /D i st ri but i on Man Corporate Marketing Information Curriculum Finance Distribution Technology Ops Processes Real Training Risk Estate Treas ury Pa yroll Tax Technic al Su pport Training Compen sat ion / Ben efit s Internat ional Loss Prevention 80 Corporate Marketing Marketing Misc Design Recruiti ng/ Staffing Marketing Training Man agement Help Des k Aviation 60 Travel/ Sales Procure me nt Accoun ting Corpor ate HQ Operations Contract Adm/Legal Other A dmin 40 E quipment Services S ervices Operations Franchisee Accounting Software Development 20 Recruit ing QA Operations Construction Field 0 Brand 1 Brand 2 Development Human Legal Other Finance P&D Resources Information Technology You can use a Marimekko chart to break out costs by department. Copyright 2013 © Mekko Graphics. All rights reserved. 16
  • 17.
    Company Analysis Plant 1 Plant 2 84% 80 79% 80% 75% Plant 1 Profitability: 70% 70% 70 69% 70 Plant 2 Profitability: 62% Contribution Margin Contribution Margin 60 60 58% Total Custom 54% 57% 50 50 40 40 0% Automotive 0% Automotive Recreational Equipment H uc t / M d u ar e cs Pl ub ro re E in e ial tr s c /P ts P Pa n tr Ho hi n al al se ry d er u c r/ as b ta l ec e ti c er/ ti o ar s c ic ic ti er uc ct ry ub r a R l P wa ni E l ar e od pe ts h r ro p In w ac st E l c e M a ed R s po ic ro d s/ w a d Pr a d d ia ial M et r an e M Ha le on u Tr M as b ic ec s/ p l tr Ap dus b Pl n Fa In By using two Bar Mekkos side by side, the profitability across two divisions of a company can be shown while retaining the relative size of each. In this case, the profitability of Plant 1 is higher than Plant 2 even though the automotive segment is weighing it down. 17
  • 18.
    Company Analysis 4% 65% 5% Contribution Margin (%) 3% 55% -2% 0% 2011 Automotive Industrial Medical All Others 2012 Contribution Machinery Contribution Margin Margin A Cascade Chart is an effective way of showing the components of profitability change between two points in time. In this case, the decrease in profitability among automotive customers was more than offset by the increases in industrial machinery, medical, and all others between 2011-2012. Copyright 2013 © Mekko Graphics. All rights reserved. 18
  • 19.
    Company Analysis Equity ValueCreation ($M) $375 $137M $367M 350 Expense Reduction Mgmt 300 Share Gain 250 $108M Market Growth 200 150 $136M PE Firm Mgmt 100 -$14M 50 PE Firm 0 Equity Value at Fees & Expenses Debt Paydown EBITDA Equity Value at Close Improvement Exit You can use a cascade to estimate the overall change in equity value for the investment. Copyright 2013 © Mekko Graphics. All rights reserved. 19