Download as PDF, PPTX


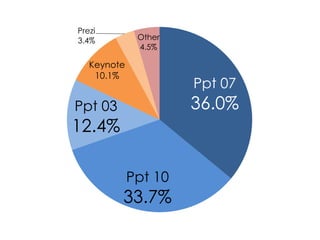


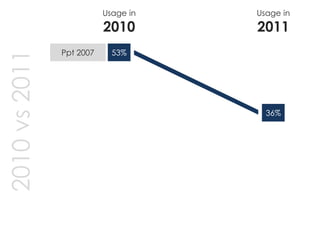

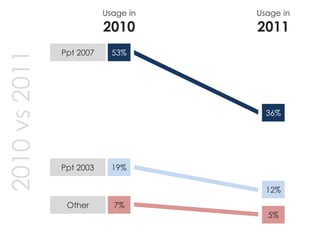


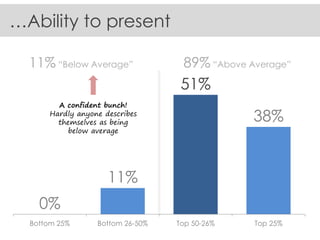


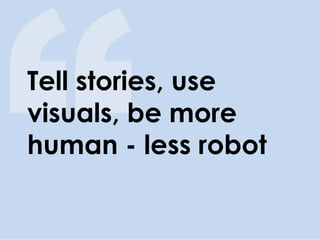


This document presents survey results on presentation software usage and presenter skills, reflecting a decline in PowerPoint usage from 2010 to 2011. It reveals a disparity in self-assessment among presenters, with most considering themselves above average in presentation abilities despite marked room for improvement. Key issues identified include excessive text on slides and presenters reading directly from screens, suggesting a need for better engagement tactics and preparation.


![Response summary [ skills perception survey ] - google docs](https://cdn.slidesharecdn.com/ss_thumbnails/responsesummary-skillsperceptionsurvey-googledocs-111112134418-phpapp01-thumbnail.jpg?width=640&height=640&fit=bounds)


