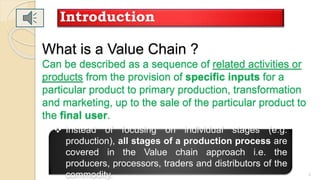
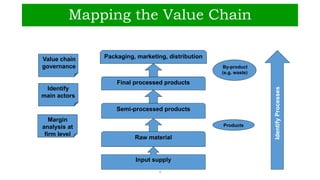
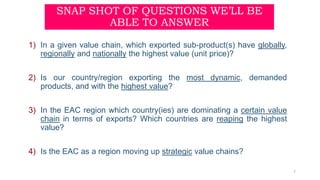
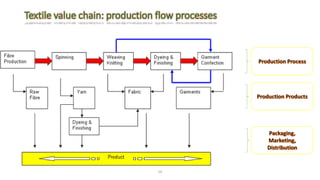
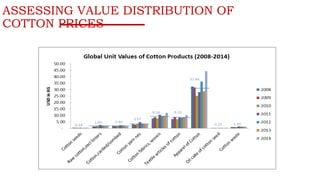
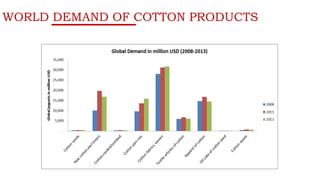
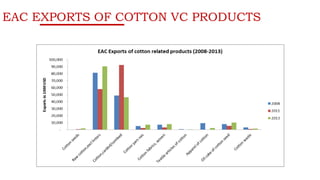
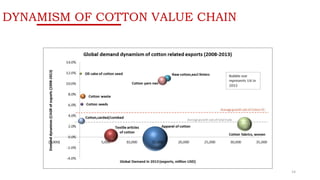
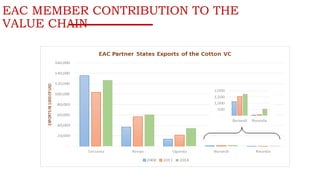
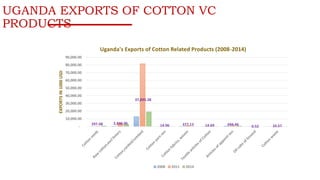
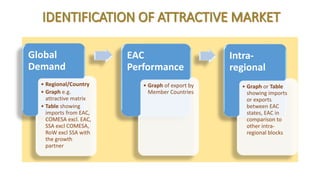
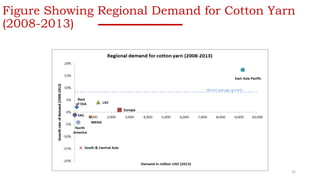
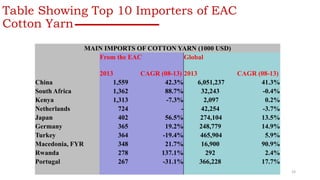
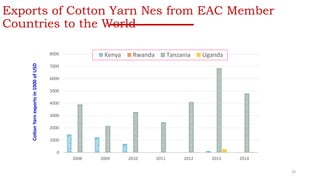
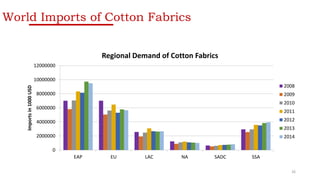
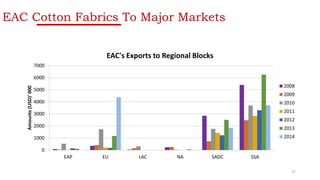
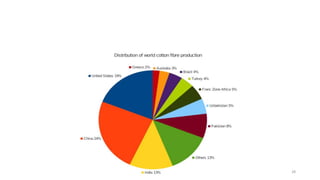
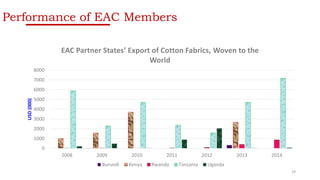
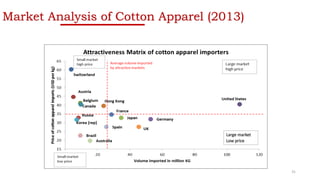
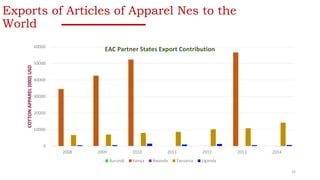
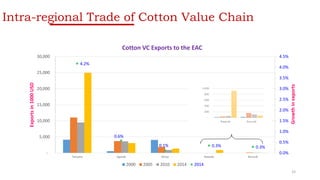
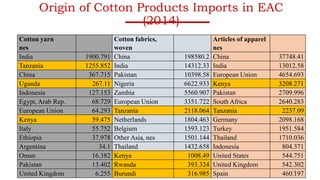
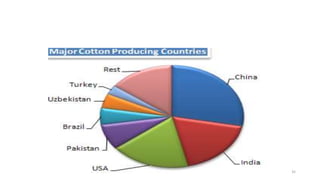
TIC – STATISTICs COMMITTEE
Cotton Value Chain
Analysis
1
PRESENTATION OVERVIEW
Attractive Market
Imports & Exports
Value Chain Approach
Cotton Analysis
Introduction
Justification
2
What is a Value Chain ?
Can be described as a sequence of related activities or
products from the provision of specific inputs for a
particular product to primary production, transformation
and marketing, up to the sale of the particular product to
the final user.
Introduction
3
 Instead of focusing on individual stages (e.g.
production), all stages of a production process are
covered in the Value chain approach i.e. the
producers, processors, traders and distributors of the
commodity.
Mapping the Value Chain
4
Input supply
Raw material
Semi-processed products
Final processed products
Packaging, marketing, distribution
IdentifyProcesses
Value chain
governance
Identify
main actors
Margin
analysis at
firm level
Products
By-product
(e.g. waste)
EAC Heads of states
Summit JOINT COMMUNIQUÉ OF THE 17TH
ORDINARY SUMMIT – 2nd March, 2016
15. Directed the partner states to ensure that all
imported second hand shoes and clothes comply
with sanitary requirements, in the partner states;
- directed the partner states to consider banning the
export of raw hides and skins outside the EAC
region.
16. Directed the partner states to procure their
textile and footwear requirements from within
the region where quality and supply capacities
are available competitively;
- with a view to phasing out importation of used textile
and foot wear within three years.
5
According to the Cotton Development Organisation (CDO)
the national body mandated to regulate cotton
production, processing, and marketing, Cotton is Uganda’s
third largest export crop after coffee and tea.
Cotton is important not only for the textile industry and
export, but also for several other products such as cooking
oil, cotton seed cake, animal feeds and other by-products.
6
SNAP SHOT OF QUESTIONS WE’LL BE
ABLE TO ANSWER
1) In a given value chain, which exported sub-product(s) have globally,
regionally and nationally the highest value (unit price)?
2) Is our country/region exporting the most dynamic, demanded
products, and with the highest value?
3) In the EAC region which country(ies) are dominating a certain value
chain in terms of exports? Which countries are reaping the highest
value?
4) Is the EAC as a region moving up strategic value chains?
7
VALUE CHAIN DISTRIBUTION
8
10
ASSESSING VALUE DISTRIBUTION OF
COTTON PRICES
11
WORLD DEMAND OF COTTON PRODUCTS
12
im
EAC EXPORTS OF COTTON VC PRODUCTS
13
DYNAMISM OF COTTON VALUE CHAIN
14
EAC MEMBER CONTRIBUTION TO THE
VALUE CHAIN
15
UGANDA EXPORTS OF COTTON VC
PRODUCTS
16
297.48 2,436.96
37,895.38
14.96 377.13 14.69 694.46 0.52 10.57-
10,000.00
20,000.00
30,000.00
40,000.00
50,000.00
60,000.00
70,000.00
80,000.00
90,000.00
EXPORTSIN1000USD
Uganda's Exports of Cotton Related Products (2008-2014)
2008 2011 2014
Global
Demand
• Regional/Country
• Graph e.g.
attractive matrix
• Table showing
imports from EAC,
COMESA excl. EAC,
SSA excl COMESA,
RoW excl SSA with
the growth
partner
EAC
Performance
• Graph of export by
Member Countries
Intra-
regional
• Graph or Table
showing imports
or exports
between EAC
states, EAC in
comparison to
other intra-
regional blocks
Regional Country
 How does demand and
growth of demand varry
across
regions/countries?
 Dominant markets:
 Who are the main
importers?
 How is their demand
changing (increasing or
decreasing, at what
pace?
 How are attractive
markets positioned in
terms of import prices
and import values?
 Is demand saturated,
decreasing or growing? 19
COTTON YARN (CY)
21
Figure Showing Regional Demand for Cotton Yarn
(2008-2013)
22
Table Showing Top 10 Importers of EAC
Cotton Yarn
MAIN IMPORTS OF COTTON YARN (1000 USD)
From the EAC Global
2013 CAGR (08-13) 2013 CAGR (08-13)
China 1,559 42.3% 6,051,237 41.3%
South Africa 1,362 88.7% 32,243 -0.4%
Kenya 1,313 -7.3% 2,097 0.2%
Netherlands 724 - 42,254 -3.7%
Japan 402 56.5% 274,104 13.5%
Germany 365 19.2% 248,779 14.9%
Turkey 364 -19.4% 465,904 5.9%
Macedonia, FYR 348 21.7% 16,900 90.9%
Rwanda 278 137.1% 292 2.4%
Portugal 267 -31.1% 366,228 17.7%
23
Exports of Cotton Yarn Nes from EAC Member
Countries to the World
0
1000
2000
3000
4000
5000
6000
7000
8000
2008 2009 2010 2011 2012 2013 2014
CottonYarnexportsin1000ofUSD
Kenya Rwanda Tanzania Uganda
24
COTTON FABRICS (WOVEN)
25
World Imports of Cotton Fabrics
0
2000000
4000000
6000000
8000000
10000000
12000000
EAP EU LAC NA SADC SSA
Importsin1000USD
Regional Demand of Cotton Fabrics
2008
2009
2010
2011
2012
2013
2014
26
EAC Cotton Fabrics To Major Markets
0
1000
2000
3000
4000
5000
6000
7000
EAP EU LAC NA SADC SSA
Amounts(USD)'000
EAC's Exports to Regional Blocks
2008
2009
2010
2011
2012
2013
2014
27
28
Performance of EAC Members
0
1000
2000
3000
4000
5000
6000
7000
8000
2008 2009 2010 2011 2012 2013 2014
USD(000)
EAC Partner States’ Export of Cotton Fabrics, Woven to the
World
Burundi Kenya Rwanda Tanzania Uganda
29
ARTICLES OF APPAREL
30
Market Analysis of Cotton Apparel (2013)
Large market
Low price
31
Exports of Articles of Apparel Nes to the
World
0
10000
20000
30000
40000
50000
60000
2008 2009 2010 2011 2012 2013 2014
COTTONAPPAREL(000)USD
EAC Partner States Export Contribution
Burundi Kenya Rwanda Tanzania Uganda
32
4.2%
0.6%
0.1% 0.3% 0.3%
0.0%
0.5%
1.0%
1.5%
2.0%
2.5%
3.0%
3.5%
4.0%
4.5%
-
5,000
10,000
15,000
20,000
25,000
30,000
Tanzania Uganda Kenya Rwanda Burundi
Growthinexports
Exportsin1000USD
Cotton VC Exports to the EAC
2000 2005 2010 2014 2014
-
200
400
600
800
1,000
Rwanda Burundi
Intra-regional Trade of Cotton Value Chain
33
Origin of Cotton Products Imports in EAC
(2014)
Cotton yarn
nes
Cotton fabrics,
woven
Articles of apparel
nes
India 1900.791 China 198580.2 China 37748.41
Tanzania 1255.852 India 14312.33 India 13012.58
China 367.715 Pakistan 10398.58 European Union 4654.693
Uganda 267.11 Nigeria 6622.933 Kenya 3208.271
Indonesia 127.153 Zambia 5560.907 Pakistan 2709.996
Egypt, Arab Rep. 68.729 European Union 3351.722 South Africa 2640.283
European Union 64.293 Tanzania 2118.064 Tanzania 2237.09
Kenya 59.475 Netherlands 1804.463 Germany 2098.168
Italy 55.752 Belgium 1593.123 Turkey 1951.584
Ethiopia 37.978 Other Asia, nes 1501.144 Thailand 1710.036
Argentina 34.1 Thailand 1432.658 Indonesia 804.371
Oman 16.382 Kenya 1008.49 United States 544.751
Pakistan 13.402 Rwanda 393.324 United Kingdom 542.302
United Kingdom 6.255 Burundi 316.985 Spain 460.19734
35
36

Presentation on cotton value chain in Uganda

  • 1.
    TIC – STATISTICsCOMMITTEE Cotton Value Chain Analysis 1
  • 2.
    PRESENTATION OVERVIEW Attractive Market Imports& Exports Value Chain Approach Cotton Analysis Introduction Justification 2
  • 3.
    What is aValue Chain ? Can be described as a sequence of related activities or products from the provision of specific inputs for a particular product to primary production, transformation and marketing, up to the sale of the particular product to the final user. Introduction 3  Instead of focusing on individual stages (e.g. production), all stages of a production process are covered in the Value chain approach i.e. the producers, processors, traders and distributors of the commodity.
  • 4.
    Mapping the ValueChain 4 Input supply Raw material Semi-processed products Final processed products Packaging, marketing, distribution IdentifyProcesses Value chain governance Identify main actors Margin analysis at firm level Products By-product (e.g. waste)
  • 5.
    EAC Heads ofstates Summit JOINT COMMUNIQUÉ OF THE 17TH ORDINARY SUMMIT – 2nd March, 2016 15. Directed the partner states to ensure that all imported second hand shoes and clothes comply with sanitary requirements, in the partner states; - directed the partner states to consider banning the export of raw hides and skins outside the EAC region. 16. Directed the partner states to procure their textile and footwear requirements from within the region where quality and supply capacities are available competitively; - with a view to phasing out importation of used textile and foot wear within three years. 5
  • 6.
    According to theCotton Development Organisation (CDO) the national body mandated to regulate cotton production, processing, and marketing, Cotton is Uganda’s third largest export crop after coffee and tea. Cotton is important not only for the textile industry and export, but also for several other products such as cooking oil, cotton seed cake, animal feeds and other by-products. 6
  • 7.
    SNAP SHOT OFQUESTIONS WE’LL BE ABLE TO ANSWER 1) In a given value chain, which exported sub-product(s) have globally, regionally and nationally the highest value (unit price)? 2) Is our country/region exporting the most dynamic, demanded products, and with the highest value? 3) In the EAC region which country(ies) are dominating a certain value chain in terms of exports? Which countries are reaping the highest value? 4) Is the EAC as a region moving up strategic value chains? 7
  • 8.
  • 9.
  • 10.
    ASSESSING VALUE DISTRIBUTIONOF COTTON PRICES 11
  • 11.
    WORLD DEMAND OFCOTTON PRODUCTS 12 im
  • 12.
    EAC EXPORTS OFCOTTON VC PRODUCTS 13
  • 13.
    DYNAMISM OF COTTONVALUE CHAIN 14
  • 14.
    EAC MEMBER CONTRIBUTIONTO THE VALUE CHAIN 15
  • 15.
    UGANDA EXPORTS OFCOTTON VC PRODUCTS 16 297.48 2,436.96 37,895.38 14.96 377.13 14.69 694.46 0.52 10.57- 10,000.00 20,000.00 30,000.00 40,000.00 50,000.00 60,000.00 70,000.00 80,000.00 90,000.00 EXPORTSIN1000USD Uganda's Exports of Cotton Related Products (2008-2014) 2008 2011 2014
  • 16.
    Global Demand • Regional/Country • Graphe.g. attractive matrix • Table showing imports from EAC, COMESA excl. EAC, SSA excl COMESA, RoW excl SSA with the growth partner EAC Performance • Graph of export by Member Countries Intra- regional • Graph or Table showing imports or exports between EAC states, EAC in comparison to other intra- regional blocks
  • 17.
    Regional Country  Howdoes demand and growth of demand varry across regions/countries?  Dominant markets:  Who are the main importers?  How is their demand changing (increasing or decreasing, at what pace?  How are attractive markets positioned in terms of import prices and import values?  Is demand saturated, decreasing or growing? 19
  • 18.
  • 19.
    Figure Showing RegionalDemand for Cotton Yarn (2008-2013) 22
  • 20.
    Table Showing Top10 Importers of EAC Cotton Yarn MAIN IMPORTS OF COTTON YARN (1000 USD) From the EAC Global 2013 CAGR (08-13) 2013 CAGR (08-13) China 1,559 42.3% 6,051,237 41.3% South Africa 1,362 88.7% 32,243 -0.4% Kenya 1,313 -7.3% 2,097 0.2% Netherlands 724 - 42,254 -3.7% Japan 402 56.5% 274,104 13.5% Germany 365 19.2% 248,779 14.9% Turkey 364 -19.4% 465,904 5.9% Macedonia, FYR 348 21.7% 16,900 90.9% Rwanda 278 137.1% 292 2.4% Portugal 267 -31.1% 366,228 17.7% 23
  • 21.
    Exports of CottonYarn Nes from EAC Member Countries to the World 0 1000 2000 3000 4000 5000 6000 7000 8000 2008 2009 2010 2011 2012 2013 2014 CottonYarnexportsin1000ofUSD Kenya Rwanda Tanzania Uganda 24
  • 22.
  • 23.
    World Imports ofCotton Fabrics 0 2000000 4000000 6000000 8000000 10000000 12000000 EAP EU LAC NA SADC SSA Importsin1000USD Regional Demand of Cotton Fabrics 2008 2009 2010 2011 2012 2013 2014 26
  • 24.
    EAC Cotton FabricsTo Major Markets 0 1000 2000 3000 4000 5000 6000 7000 EAP EU LAC NA SADC SSA Amounts(USD)'000 EAC's Exports to Regional Blocks 2008 2009 2010 2011 2012 2013 2014 27
  • 25.
  • 26.
    Performance of EACMembers 0 1000 2000 3000 4000 5000 6000 7000 8000 2008 2009 2010 2011 2012 2013 2014 USD(000) EAC Partner States’ Export of Cotton Fabrics, Woven to the World Burundi Kenya Rwanda Tanzania Uganda 29
  • 27.
  • 28.
    Market Analysis ofCotton Apparel (2013) Large market Low price 31
  • 29.
    Exports of Articlesof Apparel Nes to the World 0 10000 20000 30000 40000 50000 60000 2008 2009 2010 2011 2012 2013 2014 COTTONAPPAREL(000)USD EAC Partner States Export Contribution Burundi Kenya Rwanda Tanzania Uganda 32
  • 30.
    4.2% 0.6% 0.1% 0.3% 0.3% 0.0% 0.5% 1.0% 1.5% 2.0% 2.5% 3.0% 3.5% 4.0% 4.5% - 5,000 10,000 15,000 20,000 25,000 30,000 TanzaniaUganda Kenya Rwanda Burundi Growthinexports Exportsin1000USD Cotton VC Exports to the EAC 2000 2005 2010 2014 2014 - 200 400 600 800 1,000 Rwanda Burundi Intra-regional Trade of Cotton Value Chain 33
  • 31.
    Origin of CottonProducts Imports in EAC (2014) Cotton yarn nes Cotton fabrics, woven Articles of apparel nes India 1900.791 China 198580.2 China 37748.41 Tanzania 1255.852 India 14312.33 India 13012.58 China 367.715 Pakistan 10398.58 European Union 4654.693 Uganda 267.11 Nigeria 6622.933 Kenya 3208.271 Indonesia 127.153 Zambia 5560.907 Pakistan 2709.996 Egypt, Arab Rep. 68.729 European Union 3351.722 South Africa 2640.283 European Union 64.293 Tanzania 2118.064 Tanzania 2237.09 Kenya 59.475 Netherlands 1804.463 Germany 2098.168 Italy 55.752 Belgium 1593.123 Turkey 1951.584 Ethiopia 37.978 Other Asia, nes 1501.144 Thailand 1710.036 Argentina 34.1 Thailand 1432.658 Indonesia 804.371 Oman 16.382 Kenya 1008.49 United States 544.751 Pakistan 13.402 Rwanda 393.324 United Kingdom 542.302 United Kingdom 6.255 Burundi 316.985 Spain 460.19734
  • 32.
  • 33.