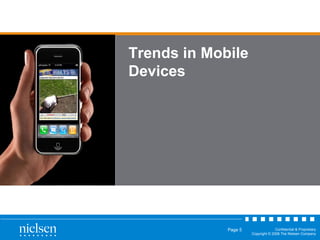
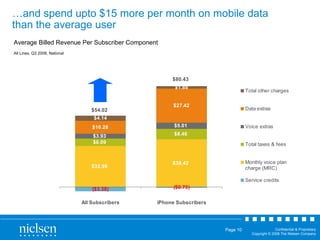
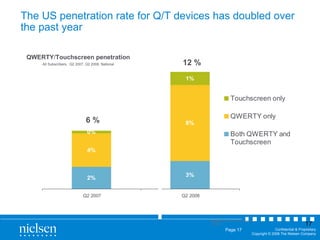
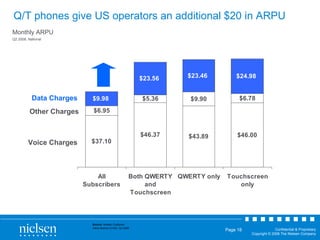
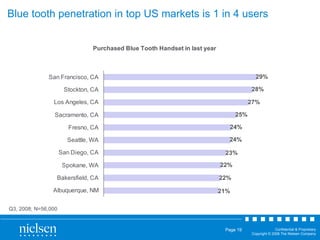
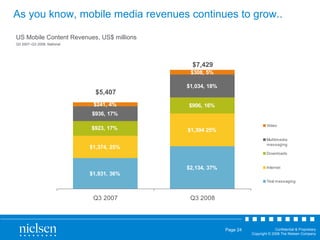
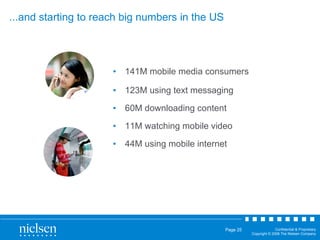
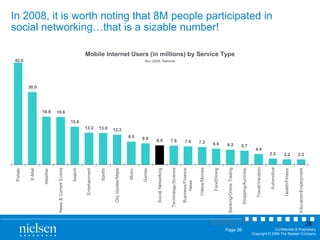
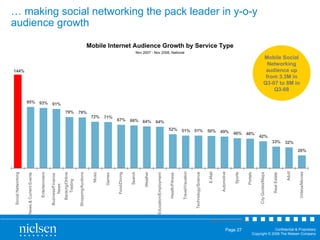
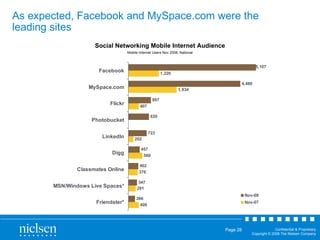
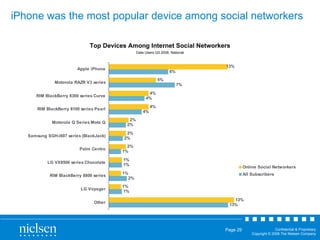
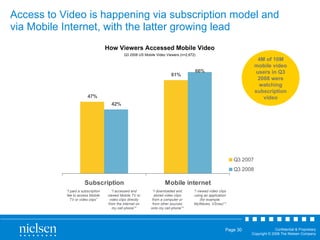
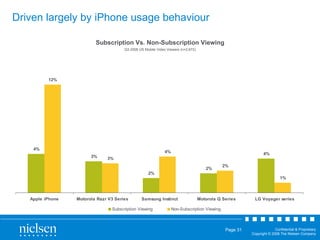
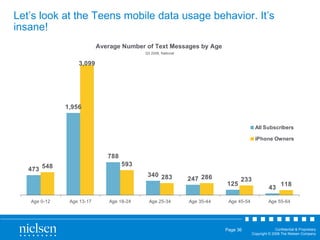
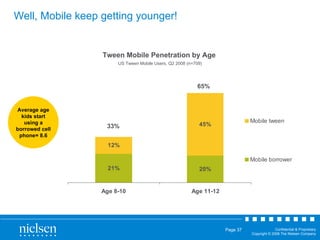
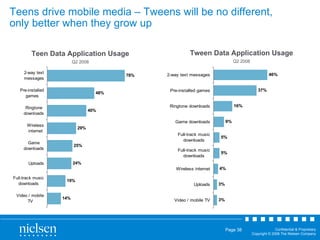
Trends in Mobile Devices & Mobile Media Sandeep Pannu Telecom Practice The Nielsen Company January 9, 2009
The Nielsen Company Countries:  110 Revenues:  $4.5 B  Clients:  21,000 Employees:  41,000
Nielsen’s Telecom Practice serves Operators and Mobile Device OEMs We provide a competitive understanding of, both, the consumer decision process, and device lifecycle. Advertising Spend and Effectiveness Attitudes & Behaviors Retail Effectiveness Purchase Decision (Market Share) Usage (Voice & Media) Demand Forecasting Market Reception (Online Buzz) Concept & Price Testing
Our Global Clients include…
Trends in Mobile Devices
2008 events shaped largely by North America players Apple certainly leads the industry with its vision of an integrated data experience – and has spurred other OEMs to rapidly replicate key elements of the Apple experience Google’s direct entry in Mobile OS is still to be judged by consumers (even as industry players are already lining up with it, or against it) Carriers have invested a lot of money in Q+T devices in expectations of higher usage fees; and the strategy is paying off We moved closer to all-IP mobile world that is starting to open up: open to applications (e.g. via open marketplaces) open to content (e.g. via DRM free music) open to networks (e.g. open to WiFi, VOIP networks like Skype)
Although, Apple had only 2-3% market share in the US in each of the trailing 5 quarters… Base: Q3 2006 (n=8,503), Q4 2006 (n=9,108), Q1 2007 (n=10,554), Q2 2007 (n=9,155),   Q3 2007 (n=9,927),  Q4 2007 (n=9,172), Q1 2008 (n=10,000), Q2 2008 (n=8,470), Q3 2008 (n=9,357) Trended Recent Acquisition Market Share Acquired Device in the Past 3 Months (n=9,357) Q435.  Who manufactures the wireless telephone/handset you currently use  with your service?  Note:  Apple tracking began in Q3 2007.
Manufacturer Recent Acquisition Market Share by Price Paid for Device Acquired and Selected Device in the Past 6 Months (n=13,964) … 23% of devices purchased in the last  months for more than $200 were Apple Base: Free/Less than $1 (n=3,566), $1–$25 (n=1,330), $26–$60 (n=3,193), $61–$100 (n=1,935), $101–$200 (n=1,715), $201+ (n=992) B485.  How much did you actually pay  for your current wireless telephone/handset   after  any trade-ins and/or rebates were subtracted from  the list/retail price?
As you know, Apple users consume more media than anyone else…significantly more % Using Data Services Q3 2008
… and spend upto $15 more per month on mobile data than the average user Average Billed Revenue Per Subscriber Component All Lines, Q3 2008, National
2008 events shaped largely by North America players Apple certainly leads the industry with its vision of an integrated data experience – and has spurred other OEMs to rapidly replicate key elements of the Apple experience Google’s direct entry in Mobile OS is still to be judged by consumers (even as industry players are already lining up with it, or against it) Carriers have invested a lot of money in Q+T devices in expectations of higher usage fees; and the strategy is paying off We moved closer to all-IP mobile world that is starting to open up: open to applications (e.g. via open marketplaces) open to content (e.g. via DRM free music) open to networks (e.g. open to WiFi, VOIP networks like Skype)
US Mobile Advertising is ~ $1 billon every quarter… Source  Nielsen Mobile Advertising Insights Note  Top 4 Carriers include AT&T (formerly Cingular), Sprint, T-Mobile and Verizon Note  Carrier Spend – Direct, Wireless, National (TV, Print, Radio, Internet)
..and ~71% of this spend names or promotes specific branded devices US Carrier Ad Spend Top 4 Carriers - All Classified Ads – National, Q3 2008 Source  Nielsen Mobile Advertising Insights Named or Promoted Device No Device
Let’s examine some of the US top print ads in Q3 2008..
Note 1:  Highlighted + Bold = Top Model & New Note 3:  Bold only = New Model Note 2:  Highlighted only = Top  Model Top Carrier Advertised Models Top 4 Carriers – All Ads with a Named Model – National, Q2 2008 Half of the top promoted devices by US Operators have Q or T or both Source  Nielson Mobile Advertising Insights AT&T Total 1. Samsung SGH-A737 (Green) $36.2M 2. Samsung SGH-A737 (Orange) $34.4M 3. Samsung SGH-A737 (Red) $24.4M 4. Samsung SGH-A737 (Blue) $13.5M 5. BlackBerry 8310 (Curve) $11.3M Other $104.3M Total $224.1M Verizon Total 1. Samsung SCH-U940 (Glyde) $26.6M 2. Samsung SCH-U740 (Alias) $23.9M 3. LG VX10000 (Voyager) $21.2M 4. Motorola MOTORIZR Z6c $18.1M 5. BlackBerry 8130 (Pearl) Pink $18.1M Other $163.6M Total $271.5M Sprint Nextel Total 1. Motorola iDEN i570 $17.1M 2. Samsung SPH-M800 (Instinct) $7.3M 3. Palm Centro (Pink) $6.3M 4. Palm Centro (Red) $5.7M 5. Palm Centro (Black) $5.3M Other $2.8M Total $44.5M T-Mobile Total 1. BlackBerry 8120 (Pearl) $1.4M 2. BlackBerry 8320 (Curve) $1.2M 3. Nokia 3555 $1.1M 4. Samsung SGH-T729 (Blast) $0.9M 5. Samsung SGH-T639 $0.8M Other $21.6M Total $27.0M
As a result, 8 of the top 20 models sold in the US were Q or T or both Source  Nielsen Mobile Device Insights Top 20 Models purchased in Q2 2008 Motorola RAZR V3 series (V3, V3c, V3m, V3i, V3i DG, V3) 6.0% RIM BlackBerry 8100 series (Pearl,8110, 8120, 8129) 2.7% LG VX8350 2.6% LG VX9100 (enV2)*** 2.5% RIM BlackBerry 8300 series (Curve, 8310, 8320, 8330) 2.3% Motorola MotoKRZR series (K1m, K1) 2.3% LG VX8500 series (Chocolate, VX8500, VX8550) 1.9% Apple iPhone 1.8% Motorola W755*** 1.7% Samsung SGH-A737/ SGH-A736 1.5% Palm Centro 1.5% Nokia 6555 1.4% Motorola W385 1.4% LG LX-260 (Rumor) 1.3% Samsung SGH-i607 series (BlackJack) 1.2% Samsung SCH-U340 series (Snap) 1.1% Sony Ericsson W580 (W580, W580i Walkman) 1.1% Motorola W370 1.1% LG Voyager 1.0% Nokia 6085 1.0% Total 38%
The US penetration rate for Q/T devices has doubled over the past year QWERTY / Touchscreen penetration All Subscribers,  Q2 2007, Q2 2008, National Source  Nielsen Mobile Device Insights 6 % 12 %
Q/T phones give US operators an additional $20 in ARPU Monthly ARPU  Q2 2008, National Source:  Nielsen Customer Value Metrics (CVM), Q2 2008 Voice Charges Other Charges Data Charges
Blue tooth penetration in top US markets is 1 in 4 users Q3, 2008; N=56,000
2008 events shaped largely by North America players Apple certainly leads the industry with its vision of an integrated data experience – and has spurred other OEMs to rapidly replicate key elements of the Apple experience Google’s direct entry in Mobile OS is still to be judged by consumers (even as industry players are already lining up with it, or against it) Carriers have invested a lot of money in Q+T devices in expectations of higher usage fees; and the strategy is paying off We moved closer to all-IP mobile world that is starting to open up: open to applications (e.g. open marketplaces) open to content (e.g. DRM free music) open to networks (e.g. open to WiFi, VOIP networks like Skype)
New “marketplaces” launched and more coming. They are not fully open but significantly more open than previously Apple App store catalogue reached 10,000 titles within 6 months of launch Android Market launched with 50 titles and is growing fast RIM plans to open their own application market in March 2009
Illustrative is number of folks who bought Apple because of open network access to WiFi Source: iphone reason purchased Unweighted Sample Size = 463 Respondents Included = 1%, Filter Applied
Trends & Opportunities in Mobile Media Sandeep Pannu Telecom Practice The Nielsen Company
As you know, mobile media revenues continues to grow.. US Mobile Content Revenues, US$ millions Q3 2007–Q3 2008, National $5,407 $7,429
...and starting to reach big numbers in the US 141M mobile media consumers 123M using text messaging 60M downloading content 11M watching mobile video  44M using mobile internet
In 2008, it is worth noting that 8M people participated in social networking…that is a sizable number! Mobile Internet Users (in millions) by Service Type Nov 2008, National Source:  Mobile Media Measurement – Mobile Internet Report
…  making social networking the pack leader in y-o-y audience growth Source: M obile Internet Report Mobile Internet Audience Growth by Service Type Nov 2007 - Nov 2008, National Mobile Social Networking audience up from 3.3M in Q3-07 to 8M in Q3-08
As expected, Facebook and MySpace.com were the leading sites Social Networking Mobile Internet Audience Mobile Internet Users Nov 2008, National
iPhone was the most popular device among social networkers Top Devices Among Internet Social Networkers Data Users Q3 2008, National
How Viewers Accessed Mobile Video Q3 2008 US Mobile Video Viewers (n=2,672) 4M of 10M mobile video users in Q3 2008 were watching subscription video “ I paid a subscription fee to access Mobile TV or video clips” “ I accessed and viewed Mobile TV or video clips directly from the internet on my cell phone”* “ I downloaded and stored video clips from a computer or from other sources onto my cell phone”* “ I viewed video clips using an application (for example: MyWaves, VSnax)”* Access to Video is happening via subscription model and via Mobile Internet, with the latter growing lead
Driven largely by iPhone usage behaviour  Subscription Vs. Non-Subscription Viewing Q3 2008 US Mobile Video Viewers (n=2,672)
This opens up video beyond TV networks NBC (29%) ESPN (23%) VH1 (22%) The Weather Channel (22%) MTV (21%) FOX (17%) ABC News (17%) CBS (17%) Comedy Central (16%) ABC (16%) The Weather Channel (32.4%) FOX (31.7%) MTV (31.5%) Comedy Central (28.9%) YouTube (28.8%) ABC (27.5%) CBS (27.1%) NBC (26.6%) ESPN (26.5%) E! Entertainment (23.2%) Top 10 Mobile Video Channel: Subscription Users Q2 2008 US Mobile Video Viewers (n=719) Top 10 Mobile Video Channels: All Users Q3 2008 US Mobile Video Viewers (n=2,672)
News Weather Sports Music Comedy User-generated video content Drama Cinema-released movies Content made for Mobile TV Educational Comedy Weather Music Sports News and Finance Movie Trailers Entertainment News User-generated video content Reality TV Animated Top 10 Content Categories for Mobile Video: Subscription Users Q2 2008 US Mobile Video Viewers (n=1,141) Top 10 Content Categories for Mobile Video: All Users Q3 2008 US Mobile Video Viewers (n=2,672) And shifts video from information-centric to entertainment
As you know – mobile skews younger demographic Demographics – Age Q3 2008
Teens makeup a large % of social networking users
Let’s look at the Teens mobile data usage behavior. It’s insane! Average Number of Text Messages by Age   Q3 2008, National
Well, Mobile keep getting younger!  Tween Mobile Penetration by Age   US Tween Mobile Users, Q2 2008 (n=709) Average age kids start using a borrowed cell phone= 8.6 33% 65%
Teens drive mobile media – Tweens will be no different, only better when they grow up Tween Data Application Usage Q2 2008 Teen Data Application Usage Q2 2008
Finally, what about the impact of economy on mobile…
It is hard to be insightful when so much has been said about this by a lot of smart people My 2 cents - A poor economy generally does not change the long-term outcomes or trends, merely the timing – the trends we talked about today are worth betting on, but plan your timing carefully A poor economy also tends to accelerate the separation between winners and losers – and we are seeing that already
Trends in Mobile Devices & Mobile Media Sandeep Pannu Telecom Practice The Nielsen Company January 9, 2009

Presentation at Consumer Electronics Show - Jan 2009

  • 1.
    Trends in MobileDevices & Mobile Media Sandeep Pannu Telecom Practice The Nielsen Company January 9, 2009
  • 2.
    The Nielsen CompanyCountries: 110 Revenues: $4.5 B Clients: 21,000 Employees: 41,000
  • 3.
    Nielsen’s Telecom Practiceserves Operators and Mobile Device OEMs We provide a competitive understanding of, both, the consumer decision process, and device lifecycle. Advertising Spend and Effectiveness Attitudes & Behaviors Retail Effectiveness Purchase Decision (Market Share) Usage (Voice & Media) Demand Forecasting Market Reception (Online Buzz) Concept & Price Testing
  • 4.
  • 5.
  • 6.
    2008 events shapedlargely by North America players Apple certainly leads the industry with its vision of an integrated data experience – and has spurred other OEMs to rapidly replicate key elements of the Apple experience Google’s direct entry in Mobile OS is still to be judged by consumers (even as industry players are already lining up with it, or against it) Carriers have invested a lot of money in Q+T devices in expectations of higher usage fees; and the strategy is paying off We moved closer to all-IP mobile world that is starting to open up: open to applications (e.g. via open marketplaces) open to content (e.g. via DRM free music) open to networks (e.g. open to WiFi, VOIP networks like Skype)
  • 7.
    Although, Apple hadonly 2-3% market share in the US in each of the trailing 5 quarters… Base: Q3 2006 (n=8,503), Q4 2006 (n=9,108), Q1 2007 (n=10,554), Q2 2007 (n=9,155), Q3 2007 (n=9,927), Q4 2007 (n=9,172), Q1 2008 (n=10,000), Q2 2008 (n=8,470), Q3 2008 (n=9,357) Trended Recent Acquisition Market Share Acquired Device in the Past 3 Months (n=9,357) Q435. Who manufactures the wireless telephone/handset you currently use with your service? Note: Apple tracking began in Q3 2007.
  • 8.
    Manufacturer Recent AcquisitionMarket Share by Price Paid for Device Acquired and Selected Device in the Past 6 Months (n=13,964) … 23% of devices purchased in the last months for more than $200 were Apple Base: Free/Less than $1 (n=3,566), $1–$25 (n=1,330), $26–$60 (n=3,193), $61–$100 (n=1,935), $101–$200 (n=1,715), $201+ (n=992) B485. How much did you actually pay for your current wireless telephone/handset after any trade-ins and/or rebates were subtracted from the list/retail price?
  • 9.
    As you know,Apple users consume more media than anyone else…significantly more % Using Data Services Q3 2008
  • 10.
    … and spendupto $15 more per month on mobile data than the average user Average Billed Revenue Per Subscriber Component All Lines, Q3 2008, National
  • 11.
    2008 events shapedlargely by North America players Apple certainly leads the industry with its vision of an integrated data experience – and has spurred other OEMs to rapidly replicate key elements of the Apple experience Google’s direct entry in Mobile OS is still to be judged by consumers (even as industry players are already lining up with it, or against it) Carriers have invested a lot of money in Q+T devices in expectations of higher usage fees; and the strategy is paying off We moved closer to all-IP mobile world that is starting to open up: open to applications (e.g. via open marketplaces) open to content (e.g. via DRM free music) open to networks (e.g. open to WiFi, VOIP networks like Skype)
  • 12.
    US Mobile Advertisingis ~ $1 billon every quarter… Source Nielsen Mobile Advertising Insights Note Top 4 Carriers include AT&T (formerly Cingular), Sprint, T-Mobile and Verizon Note Carrier Spend – Direct, Wireless, National (TV, Print, Radio, Internet)
  • 13.
    ..and ~71% ofthis spend names or promotes specific branded devices US Carrier Ad Spend Top 4 Carriers - All Classified Ads – National, Q3 2008 Source Nielsen Mobile Advertising Insights Named or Promoted Device No Device
  • 14.
    Let’s examine someof the US top print ads in Q3 2008..
  • 15.
    Note 1: Highlighted + Bold = Top Model & New Note 3: Bold only = New Model Note 2: Highlighted only = Top Model Top Carrier Advertised Models Top 4 Carriers – All Ads with a Named Model – National, Q2 2008 Half of the top promoted devices by US Operators have Q or T or both Source Nielson Mobile Advertising Insights AT&T Total 1. Samsung SGH-A737 (Green) $36.2M 2. Samsung SGH-A737 (Orange) $34.4M 3. Samsung SGH-A737 (Red) $24.4M 4. Samsung SGH-A737 (Blue) $13.5M 5. BlackBerry 8310 (Curve) $11.3M Other $104.3M Total $224.1M Verizon Total 1. Samsung SCH-U940 (Glyde) $26.6M 2. Samsung SCH-U740 (Alias) $23.9M 3. LG VX10000 (Voyager) $21.2M 4. Motorola MOTORIZR Z6c $18.1M 5. BlackBerry 8130 (Pearl) Pink $18.1M Other $163.6M Total $271.5M Sprint Nextel Total 1. Motorola iDEN i570 $17.1M 2. Samsung SPH-M800 (Instinct) $7.3M 3. Palm Centro (Pink) $6.3M 4. Palm Centro (Red) $5.7M 5. Palm Centro (Black) $5.3M Other $2.8M Total $44.5M T-Mobile Total 1. BlackBerry 8120 (Pearl) $1.4M 2. BlackBerry 8320 (Curve) $1.2M 3. Nokia 3555 $1.1M 4. Samsung SGH-T729 (Blast) $0.9M 5. Samsung SGH-T639 $0.8M Other $21.6M Total $27.0M
  • 16.
    As a result,8 of the top 20 models sold in the US were Q or T or both Source Nielsen Mobile Device Insights Top 20 Models purchased in Q2 2008 Motorola RAZR V3 series (V3, V3c, V3m, V3i, V3i DG, V3) 6.0% RIM BlackBerry 8100 series (Pearl,8110, 8120, 8129) 2.7% LG VX8350 2.6% LG VX9100 (enV2)*** 2.5% RIM BlackBerry 8300 series (Curve, 8310, 8320, 8330) 2.3% Motorola MotoKRZR series (K1m, K1) 2.3% LG VX8500 series (Chocolate, VX8500, VX8550) 1.9% Apple iPhone 1.8% Motorola W755*** 1.7% Samsung SGH-A737/ SGH-A736 1.5% Palm Centro 1.5% Nokia 6555 1.4% Motorola W385 1.4% LG LX-260 (Rumor) 1.3% Samsung SGH-i607 series (BlackJack) 1.2% Samsung SCH-U340 series (Snap) 1.1% Sony Ericsson W580 (W580, W580i Walkman) 1.1% Motorola W370 1.1% LG Voyager 1.0% Nokia 6085 1.0% Total 38%
  • 17.
    The US penetrationrate for Q/T devices has doubled over the past year QWERTY / Touchscreen penetration All Subscribers, Q2 2007, Q2 2008, National Source Nielsen Mobile Device Insights 6 % 12 %
  • 18.
    Q/T phones giveUS operators an additional $20 in ARPU Monthly ARPU Q2 2008, National Source: Nielsen Customer Value Metrics (CVM), Q2 2008 Voice Charges Other Charges Data Charges
  • 19.
    Blue tooth penetrationin top US markets is 1 in 4 users Q3, 2008; N=56,000
  • 20.
    2008 events shapedlargely by North America players Apple certainly leads the industry with its vision of an integrated data experience – and has spurred other OEMs to rapidly replicate key elements of the Apple experience Google’s direct entry in Mobile OS is still to be judged by consumers (even as industry players are already lining up with it, or against it) Carriers have invested a lot of money in Q+T devices in expectations of higher usage fees; and the strategy is paying off We moved closer to all-IP mobile world that is starting to open up: open to applications (e.g. open marketplaces) open to content (e.g. DRM free music) open to networks (e.g. open to WiFi, VOIP networks like Skype)
  • 21.
    New “marketplaces” launchedand more coming. They are not fully open but significantly more open than previously Apple App store catalogue reached 10,000 titles within 6 months of launch Android Market launched with 50 titles and is growing fast RIM plans to open their own application market in March 2009
  • 22.
    Illustrative is numberof folks who bought Apple because of open network access to WiFi Source: iphone reason purchased Unweighted Sample Size = 463 Respondents Included = 1%, Filter Applied
  • 23.
    Trends & Opportunitiesin Mobile Media Sandeep Pannu Telecom Practice The Nielsen Company
  • 24.
    As you know,mobile media revenues continues to grow.. US Mobile Content Revenues, US$ millions Q3 2007–Q3 2008, National $5,407 $7,429
  • 25.
    ...and starting toreach big numbers in the US 141M mobile media consumers 123M using text messaging 60M downloading content 11M watching mobile video 44M using mobile internet
  • 26.
    In 2008, itis worth noting that 8M people participated in social networking…that is a sizable number! Mobile Internet Users (in millions) by Service Type Nov 2008, National Source: Mobile Media Measurement – Mobile Internet Report
  • 27.
    … makingsocial networking the pack leader in y-o-y audience growth Source: M obile Internet Report Mobile Internet Audience Growth by Service Type Nov 2007 - Nov 2008, National Mobile Social Networking audience up from 3.3M in Q3-07 to 8M in Q3-08
  • 28.
    As expected, Facebookand MySpace.com were the leading sites Social Networking Mobile Internet Audience Mobile Internet Users Nov 2008, National
  • 29.
    iPhone was themost popular device among social networkers Top Devices Among Internet Social Networkers Data Users Q3 2008, National
  • 30.
    How Viewers AccessedMobile Video Q3 2008 US Mobile Video Viewers (n=2,672) 4M of 10M mobile video users in Q3 2008 were watching subscription video “ I paid a subscription fee to access Mobile TV or video clips” “ I accessed and viewed Mobile TV or video clips directly from the internet on my cell phone”* “ I downloaded and stored video clips from a computer or from other sources onto my cell phone”* “ I viewed video clips using an application (for example: MyWaves, VSnax)”* Access to Video is happening via subscription model and via Mobile Internet, with the latter growing lead
  • 31.
    Driven largely byiPhone usage behaviour Subscription Vs. Non-Subscription Viewing Q3 2008 US Mobile Video Viewers (n=2,672)
  • 32.
    This opens upvideo beyond TV networks NBC (29%) ESPN (23%) VH1 (22%) The Weather Channel (22%) MTV (21%) FOX (17%) ABC News (17%) CBS (17%) Comedy Central (16%) ABC (16%) The Weather Channel (32.4%) FOX (31.7%) MTV (31.5%) Comedy Central (28.9%) YouTube (28.8%) ABC (27.5%) CBS (27.1%) NBC (26.6%) ESPN (26.5%) E! Entertainment (23.2%) Top 10 Mobile Video Channel: Subscription Users Q2 2008 US Mobile Video Viewers (n=719) Top 10 Mobile Video Channels: All Users Q3 2008 US Mobile Video Viewers (n=2,672)
  • 33.
    News Weather SportsMusic Comedy User-generated video content Drama Cinema-released movies Content made for Mobile TV Educational Comedy Weather Music Sports News and Finance Movie Trailers Entertainment News User-generated video content Reality TV Animated Top 10 Content Categories for Mobile Video: Subscription Users Q2 2008 US Mobile Video Viewers (n=1,141) Top 10 Content Categories for Mobile Video: All Users Q3 2008 US Mobile Video Viewers (n=2,672) And shifts video from information-centric to entertainment
  • 34.
    As you know– mobile skews younger demographic Demographics – Age Q3 2008
  • 35.
    Teens makeup alarge % of social networking users
  • 36.
    Let’s look atthe Teens mobile data usage behavior. It’s insane! Average Number of Text Messages by Age Q3 2008, National
  • 37.
    Well, Mobile keepgetting younger! Tween Mobile Penetration by Age US Tween Mobile Users, Q2 2008 (n=709) Average age kids start using a borrowed cell phone= 8.6 33% 65%
  • 38.
    Teens drive mobilemedia – Tweens will be no different, only better when they grow up Tween Data Application Usage Q2 2008 Teen Data Application Usage Q2 2008
  • 39.
    Finally, what aboutthe impact of economy on mobile…
  • 40.
    It is hardto be insightful when so much has been said about this by a lot of smart people My 2 cents - A poor economy generally does not change the long-term outcomes or trends, merely the timing – the trends we talked about today are worth betting on, but plan your timing carefully A poor economy also tends to accelerate the separation between winners and losers – and we are seeing that already
  • 41.
    Trends in MobileDevices & Mobile Media Sandeep Pannu Telecom Practice The Nielsen Company January 9, 2009

Editor's Notes

  • #5 1 st bullet – advertisers, PSMS, anything else? 2nd bullet weak
  • #7 Apple is operating a marketplace without AT&T control, although with Apple control Google is going to launch a marketplace in Q1 2009 Nokia, Samsung have also announced their plan to launch a marketplace in 2009. More and more devices have open WiFi and this trend is accelerating; although very few have access to VOIP applications and this trend has not started yet With Apple’s announcement to make all iTunes music DRM free – this trend is likely going to take hold
  • #9 Manufacturers Motorola (A) B C D E F Nokia (B) Samsung (C) B D F LG (D) F Kyocera (E) B D F Sanyo (G) B C D E F Sony Ericsson (F) UTStarcom/Audiovox (H) A B C D E F G J Other (J) A B C D E F G Service Providers AT&T (A) Nextel (B) A C D E F Sprint (C) A D E F T-Mobile (D) A E F Verizon (E) Other (F)
  • #12 Apple is operating a marketplace without AT&T control, although with Apple control Google is going to launch a marketplace in Q1 2009 Nokia, Samsung have also announced their plan to launch a marketplace in 2009. More and more devices have open WiFi and this trend is accelerating; although very few have access to VOIP applications and this trend has not started yet With Apple’s announcement to make all iTunes music DRM free – this trend is likely going to take hold
  • #14 Top 5 carriers/Classified Data only/No DNA DMA is approx 108m of which Apple is about half
  • #16 Top 5 carriers/All Data/no unclassified/no unknown/no DNA
  • #21 Apple is operating a marketplace without AT&T control, although with Apple control Google is going to launch a marketplace in Q1 2009 Nokia, Samsung have also announced their plan to launch a marketplace in 2009. More and more devices have open WiFi and this trend is accelerating; although very few have access to VOIP applications and this trend has not started yet With Apple’s announcement to make all iTunes music DRM free – this trend is likely going to take hold