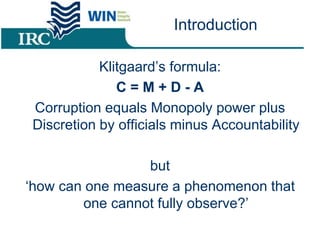
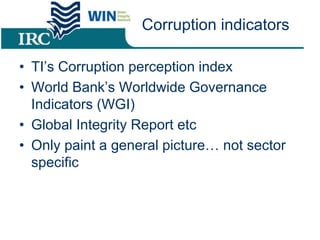
Module 2. How serious is corruption in
water?
Session 2.1 Estimating the level
of sector corruption
Training workshop
6-7 Apr 2011
Strengthening transparency, integrity and accountability IRC International Water
and Sanitation Centre
Introduction
Klitgaard’s formula:
C = M + D - A
Corruption equals Monopoly power plus
Discretion by officials minus Accountability
but
‘how can one measure a phenomenon that
one cannot fully observe?’
Corruption indicators
• TI’s Corruption perception index
• World Bank’s Worldwide Governance
Indicators (WGI)
• Global Integrity Report etc
• Only paint a general picture… not sector
specific
Correlation or cause?
Transparency
International CPI
Index (Rank of
178 countries:
1=best,
163=worst; 2010)
Human Poverty
Index (HPI-1
rank, 2010)
Water
supply
coverage %
(2008)
Sanitation
coverage %
(2008)
Children
under five
mortality rate
(per 1,000 live
births, 2009)
Global Integrity
Initiative
Sweden 4 9 100 100 2.8 Nd
Netherlands 7 7 100 100 4.4 Nd
UK 20 26 100 100 5.5 Na
Poland 41 41 100 90 6.7 Strong 2008
Italy 67 23 100 nd 4.0 Moderate 2008
Senegal 105 144 69 51 92.8 Weak 2006
Bolivia 110 95 86 25 51.2 Nd
Tanzania 116 148 54 24 107.9 Weak 2008
Honduras 126 106 86 71 29.7 Na
Ecuador 127 77 94 92 24.2 Weak 2008
Nicaragua 127 115 85 52 25.6 na
Sources: www.transparency.org; www.undp.org; http://mdgs.un.org/; http://www.wssinfo.org/
GCR 2008
• 25-45% based on Davis (2004)
– Bribes 1-6% contract values
– Kickbacks during construction 11%
– 15-20% higher than market costs
– 3-5% materials never supplied
• Higher estimate pushes a connection fee
from US$400 to 580
• Under high corruption scenario 30% fewer
lives saved through WASH investments
• Stalgren (2006) quotes 30% estimate
based on World Bank range between 20-
40%
• Equivalent to leakage of US$20 billion
over decade
• But, there is little reliable research on
levels of corruption in water
• Proxies offer an alternative: costs before
and after anti-corruption interventions
Pipe prices in Colombia
• High levels of price fixing and collusion
in contracts to procure pipes
• Private sector pipe manufacturers
introduced self-regulation (led by
professional association and supported
by TI and govt)
• Integrity pact not to pay or accept
bribes (based on TI’s Business
Principles for Countering Bribery
(BPCB))
• Claim significant fall in prices (30%)
Source: Lencina, et al 2008 (p62 in GCR and Alma Rocío Balcázar,
pers. Comm)
Cost of latrines in
Kerala
• The NGO SEUF targeted diversion of
funds to reduce costs in latrine
construction
• Mix of strategies:
• more information
• extra checks & spot checks
• public postings
• double signatures
• action on complaints at lowest level
• referral of problems
• Community contracting lowered
construction costs by estimated 15-
40%
Source: Mathew et al 2008 (SEUF, Kerela)
Conclusions
• Estimates are useful for policymaking, but
prone to over-extrapolation
• Proxy measures may be more reliable,
and can convey a positive message
• People are understandably touchy about
being accused of high levels of corruption:
public sector, governments, donors
• Should we do more to estimate and
communicate high levels of leakage?
Conclusions
• What kind of research or measurement?
• Multiple and actionable measures

Presentation 2.1 Estimating corruption levels

  • 1.
    Module 2. Howserious is corruption in water? Session 2.1 Estimating the level of sector corruption Training workshop 6-7 Apr 2011 Strengthening transparency, integrity and accountability IRC International Water and Sanitation Centre
  • 2.
    Introduction Klitgaard’s formula: C =M + D - A Corruption equals Monopoly power plus Discretion by officials minus Accountability but ‘how can one measure a phenomenon that one cannot fully observe?’
  • 3.
    Corruption indicators • TI’sCorruption perception index • World Bank’s Worldwide Governance Indicators (WGI) • Global Integrity Report etc • Only paint a general picture… not sector specific
  • 4.
    Correlation or cause? Transparency InternationalCPI Index (Rank of 178 countries: 1=best, 163=worst; 2010) Human Poverty Index (HPI-1 rank, 2010) Water supply coverage % (2008) Sanitation coverage % (2008) Children under five mortality rate (per 1,000 live births, 2009) Global Integrity Initiative Sweden 4 9 100 100 2.8 Nd Netherlands 7 7 100 100 4.4 Nd UK 20 26 100 100 5.5 Na Poland 41 41 100 90 6.7 Strong 2008 Italy 67 23 100 nd 4.0 Moderate 2008 Senegal 105 144 69 51 92.8 Weak 2006 Bolivia 110 95 86 25 51.2 Nd Tanzania 116 148 54 24 107.9 Weak 2008 Honduras 126 106 86 71 29.7 Na Ecuador 127 77 94 92 24.2 Weak 2008 Nicaragua 127 115 85 52 25.6 na Sources: www.transparency.org; www.undp.org; http://mdgs.un.org/; http://www.wssinfo.org/
  • 5.
    GCR 2008 • 25-45%based on Davis (2004) – Bribes 1-6% contract values – Kickbacks during construction 11% – 15-20% higher than market costs – 3-5% materials never supplied • Higher estimate pushes a connection fee from US$400 to 580 • Under high corruption scenario 30% fewer lives saved through WASH investments
  • 6.
    • Stalgren (2006)quotes 30% estimate based on World Bank range between 20- 40% • Equivalent to leakage of US$20 billion over decade
  • 7.
    • But, thereis little reliable research on levels of corruption in water • Proxies offer an alternative: costs before and after anti-corruption interventions
  • 8.
    Pipe prices inColombia • High levels of price fixing and collusion in contracts to procure pipes • Private sector pipe manufacturers introduced self-regulation (led by professional association and supported by TI and govt) • Integrity pact not to pay or accept bribes (based on TI’s Business Principles for Countering Bribery (BPCB)) • Claim significant fall in prices (30%) Source: Lencina, et al 2008 (p62 in GCR and Alma Rocío Balcázar, pers. Comm)
  • 9.
    Cost of latrinesin Kerala • The NGO SEUF targeted diversion of funds to reduce costs in latrine construction • Mix of strategies: • more information • extra checks & spot checks • public postings • double signatures • action on complaints at lowest level • referral of problems • Community contracting lowered construction costs by estimated 15- 40% Source: Mathew et al 2008 (SEUF, Kerela)
  • 10.
    Conclusions • Estimates areuseful for policymaking, but prone to over-extrapolation • Proxy measures may be more reliable, and can convey a positive message • People are understandably touchy about being accused of high levels of corruption: public sector, governments, donors • Should we do more to estimate and communicate high levels of leakage?
  • 11.
    Conclusions • What kindof research or measurement? • Multiple and actionable measures