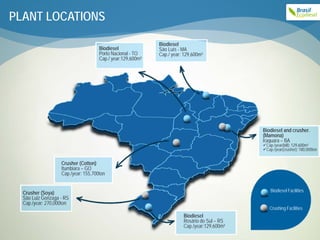
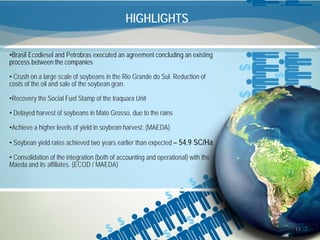
1) Brasil Ecodiesel executed an agreement concluding a process with Petrobras that will allow for large-scale soybean crushing in Rio Grande do Sul, reducing oil costs and generating soybean meal sales.
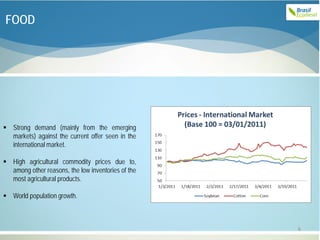
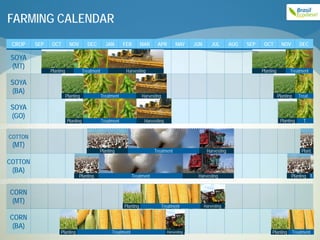
2) Soybean harvest in Mato Grosso was delayed due to rains, while yields in other regions exceeded targets.
3) Consolidation of accounting and operational integration between Brasil Ecodiesel and Maeda was completed.


![Redd project indonesia steni 11 [compatibility mode]](https://cdn.slidesharecdn.com/ss_thumbnails/reddprojectindonesia-steni11compatibilitymode-100920212441-phpapp02-thumbnail.jpg?width=640&height=640&fit=bounds)


