
More Related Content
What's hot
What's hot (20)
Viewers also liked
Viewers also liked (20)
Similar to Presentacion sem 1705
Similar to Presentacion sem 1705 (20)
Recently uploaded
Recently uploaded (20)
Presentacion sem 1705
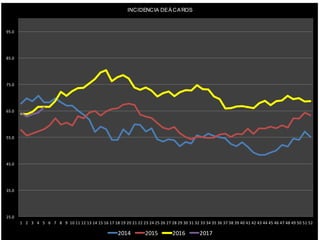
- 1. INCIDENCIA DE ÁCAROS 25.0 35.0 45.0 55.0 65.0 75.0 85.0 95.0 1 2 3 4 5 6 7 8 9 10 11 12 13 14 15 16 17 18 19 20 21 22 23 24 25 26 27 28 29 30 31 32 33 34 35 36 37 38 39 40 41 42 43 44 45 46 47 48 49 50 51 52 INCIDENCIA DEÁCAROS 2014 2015 2016 2017
- 2. % INCIDENCIA VS AFECTACIÓN ÁCAROS 0% 10% 20% 30% 40% 50% 60% 70% 80% 90% 201605 201606 201607 201608 201609 201610 201611 201612 201613 201614 201615 201616 201617 201618 201619 201620 201621 201622 201623 201624 201625 201626 201627 201628 201629 201630 201631 201632 201633 201634 201635 201636 201637 201638 201639 201640 201641 201642 201643 201644 201645 201646 201647 201648 201649 201650 201651 201652 201701 201702 201703 201704 201705 % INCIDENCIA VSAFECTACIÓN ÁCAROS % INCIDENCIA TOTAL Afectacion
- 3. INCIDENCIA DE MOSCA BLANCA 0 10 20 30 40 50 60 70 80 90 100 1 2 3 4 5 6 7 8 9 10 11 12 13 14 15 16 17 18 19 20 21 22 23 24 25 26 27 28 29 30 31 32 33 34 35 36 37 38 39 40 41 42 43 44 45 46 47 48 49 50 51 52 INCIDENCIA DEMOSCA BLANCA 2014 2015 2016 2017
- 4. INCIDENCIA DE TRIPS 0.0 5.0 10.0 15.0 20.0 25.0 30.0 35.0 40.0 45.0 50.0 1 2 3 4 5 6 7 8 9 10 11 12 13 14 15 16 17 18 19 20 21 22 23 24 25 26 27 28 29 30 31 32 33 34 35 36 37 38 39 40 41 42 43 44 45 46 47 48 49 50 51 52 INCIDENCIA DETRIPS 2014 2015 2016 2017
- 5. CANTIDAD DE MIGRACIONES 0 500 1000 1500 2000 2500 1 2 3 4 5 6 7 8 9 10 11 12 13 14 15 16 17 18 19 20 21 22 23 24 25 26 27 28 29 30 31 32 33 34 35 36 37 38 39 40 41 42 43 44 45 46 47 48 49 50 51 52 CANTIDAD DEMIGRACIONES 2014 2015 2016 2017
- 6. VELLOSO 2015 - 2016 0.00% 5.00% 10.00% 15.00% 20.00% 25.00% 30.00% 1 2 3 4 5 6 7 8 9 10 11 12 13 14 15 16 17 18 19 20 21 22 23 24 25 26 27 28 29 30 31 32 33 34 35 36 37 38 39 40 41 42 43 44 45 46 47 48 49 50 51 52 VELLOSO 2015 - 2016 2016 - % INI 2016 - % FIN 2017 - % INI 2017 - % FIN
- 7. INCIDENCIA DE MILDEO VELLOSO 0.0 5.0 10.0 15.0 20.0 25.0 30.0 1 2 3 4 5 6 7 8 9 10 11 12 13 14 15 16 17 18 19 20 21 22 23 24 25 26 27 28 29 30 31 32 33 34 35 36 37 38 39 40 41 42 43 44 45 46 47 48 49 50 51 52 INCIDENCIA DEMILDEO VELLOSO 2014 2015 2016 2017
- 8. INCIDENCIA DE MILDEO POLVOSO 0.0 5.0 10.0 15.0 20.0 25.0 30.0 35.0 40.0 1 2 3 4 5 6 7 8 9 10 11 12 13 14 15 16 17 18 19 20 21 22 23 24 25 26 27 28 29 30 31 32 33 34 35 36 37 38 39 40 41 42 43 44 45 46 47 48 49 50 51 52 INCIDENCIA DE MILDEO POLVOSO 2014 2015 2016 2017
- 9. BOTRYTIS ZONA DE CORTE INICIA VS FINAL 0 50 100 150 200 250 300 350 400 450 500 1605 1606 1607 1608 1609 1610 1611 1612 1613 1614 1615 1616 1617 1618 1619 1620 1621 1622 1623 1624 1625 1626 1627 1628 1629 1630 1631 1632 1633 1634 1635 1636 1637 1638 1639 1640 1641 1642 1643 1644 1645 1646 1647 1648 1649 1650 1651 1652 1701 1702 1703 1704 1705 BOTRYTISZONA DECORTEINICIA VSFINAL Inicial Final
- 10. BOTRYTIS ZONA DE CORTE 0.0 5.0 10.0 15.0 20.0 25.0 30.0 1 2 3 4 5 6 7 8 9 10 11 12 13 14 15 16 17 18 19 20 21 22 23 24 25 26 27 28 29 30 31 32 33 34 35 36 37 38 39 40 41 42 43 44 45 46 47 48 49 50 51 BOTRYTISZONA DECORTE 2014 2015 2016 2017
- 11. BOTRYTIS ZONA DE CORTE VARIEDAD40% 39% 21% 18% 7% 4% 3% 3% 2% 0% 0% 0% 0% 0% 0% 0% 0% 0% 0% 0% 5% 10% 15% 20% 25% 30% 35% 40% 45% BOTRYTISZONA DECORTEVARIEDAD Total
- 12. BOTRYTIS FLOR 0.0 1.0 2.0 3.0 4.0 5.0 6.0 7.0 8.0 9.0 10.0 1 2 3 4 5 6 7 8 9 10 11 12 13 14 15 16 17 18 19 20 21 22 23 24 25 26 27 28 29 30 31 32 33 34 35 36 37 38 39 40 41 42 43 44 45 46 47 48 49 50 51 52 BOTRYTISFLOR 2014 2015 2016 2017
- 13. BOTRYTIS FLOR DIARIA VARIEDAD4.1% 2.6% 0.8% 0.7% 0.6% 0.0% 0.0% 0.0% 0.0% 0.0% 0.0% 0.0% 0.0% 0.0% 0.0% 0.0% 0.0% 0.0% 0.0% 0.0% 0.5% 1.0% 1.5% 2.0% 2.5% 3.0% 3.5% 4.0% 4.5% BOTRYTISFLORDIARIA VARIEDAD Total
- 14. CÁMARA HÚMEDA 0.0 10.0 20.0 30.0 40.0 50.0 60.0 70.0 80.0 90.0 100.0 1 2 3 4 5 6 7 8 9 10 11 12 13 14 15 16 17 18 19 20 21 22 23 24 25 26 27 28 29 30 31 32 33 34 35 36 37 38 39 40 41 42 43 44 45 46 47 48 49 50 51 52 CÁMARA HÚMEDA 2014 2015 2016 2017
- 15. CÁMARA HÚMEDA VARIEDAD13% 5% 4% 2% 0% 0% 0% 0% 0% 0% 0% 0% 0% 0% 0% 0% 0% 0% 0% 0% 2% 4% 6% 8% 10% 12% 14% 16% CÁMARA HÚMEDA VARIEDAD Total
- 16. INCIDENCIA CHANCRO 45.0 55.0 65.0 75.0 85.0 95.0 1 2 3 4 5 6 7 8 9 10 11 12 13 14 15 16 17 18 19 20 21 22 23 24 25 26 27 28 29 30 31 32 33 34 35 36 37 38 39 40 41 42 43 44 45 46 47 48 49 50 51 52 INCIDENCIA CHANCRO 2014 2015 2016 2017
- 17. AFECTACION CHANCRO 15.0 20.0 25.0 30.0 35.0 40.0 45.0 50.0 55.0 60.0 1 2 3 4 5 6 7 8 9 10 11 12 13 14 15 16 17 18 19 20 21 22 23 24 25 26 27 28 29 30 31 32 33 34 35 36 37 38 39 40 41 42 43 44 45 46 47 48 49 50 51 52 AFECTACION CHANCRO 2014 2015 2016 2017