SlideShare a Scribd company logo
Predictive Finance
Henner Schliebs, October 10, 2013
© 2013 SAP AG or an SAP affiliate company. All rights reserved. 2
Finance Excellence: Guidance on,
Guiding for the future
Core functions of
effective organizations :
 Reporting of historic
financial information
AND
 Guidance on and guiding
expected (future) results
source: Association of Accountants and Financial Professionals in Business (IMA): Conceptual Framework for
Managerial Costing
© 2013 SAP AG or an SAP affiliate company. All rights reserved. 3
The Finance Conundrum: What is the
future ?
Based on the past
 what is likely going to
happen ?
 Which factors are correlated
with others or impact the
future ?
 Plans tell us where we want
to go (vision), not where we
are heading (direction)
Vision (Plan)
Direction (Reality)
Indicators (Trends)
Past Performance
© 2013 SAP AG or an SAP affiliate company. All rights reserved. 4
Predictive Finance
Examine the past.
Extrapolate the future
 Examine current and
historical data to make
representations about the
future
 Representations close
enough to be useful; risk
and uncertainty are inherent
 Encompasses (formal
statistical) methods
 Exploits patterns, trends,
variances, and correlations
Terms similar to “prediction “include but are not limited to “estimation”, “approximation”,
“projection”, “forecasting”, and “extrapolation”
SAP Predictive Analysis
© 2013 SAP AG or an SAP affiliate company. All rights reserved. 6
What if you could…
Address your future finance needs by anticipating them today
Sense & Respond Predict & Act
Raw
Data
Cleaned
Data
Standard
Reports
Ad Hoc
Reports &
OLAP
Generic
Predictive
Analytics
Predictive
Modeling
Optimization
What happened?
Why did it happen?
What will happen?
What is the best that could
happen?
CompetitiveAdvantage
Maturity of Analytics Capabilities
Finance Analytics influenced decision making process
DECIPHERING DATA > SENSING & RESPONSE > PREDICTION & ACTION
© 2013 SAP AG or an SAP affiliate company. All rights reserved. 7
Predictive Finance
Analyses and Optimization scenarios for Profitability and Performance
Cost, margin and other financial trends
 Time series (Forecasting)
Profitability analysis (A also bought XYZ)
 Associations (Identification)
Optimized performance management
 Classification (Decision Trees)
Proactive detection of financial risks
 Outliers (Anomaly detection)
Late payers - attributes (Receivables)
 Clustering (Segmentation)
Company performance (external factors)
 Classification (Correlations)
AnalyzeOptimize
© 2013 SAP AG or an SAP affiliate company. All rights reserved. 8
SAP Predictive Analysis - Key Finance process component
SAP Predictive Analysis allows end-to-end SAP coverage for the record-to-act management
process. Results of the analysis process step are used to take action (plan, re-plan, or management
action outside SAP system)
Record Report Analyze Act
 SAP Predictive Analysis
 SAP Net Margin Analysis
 SAP Business
Planning
 SAP ERP
 SAP EPM
 BOBJ BI platform
 SAP Accelerators
 SAP ERP foundation
 SAP Accelerators
Record-to-act management process
© 2013 SAP AG or an SAP affiliate company. All rights reserved. 9
Manage Financial Risk
SAP Predictive Analysis - Finance Value Proposition
Optimize business
opportunities
Outperform Financial
Objectives
 Reach your business goals faster by
turning dormant data into new opportunities
 Stay agile and gain a competitive edge with
efficient forecasting and planning
 Solve problems before they happen by
exposing hidden risks and hazards
Analyst View
© 2013 SAP AG or an SAP affiliate company. All rights reserved. 11
Importance of the CFO and the Finance
Organization
Changing role of the
CFO
 CFO are the most influential
personas in the corporation,
trend: replace the CEO
 (advanced) Analytics is a
top topic for CFOs (cfo.com
study, Deloitte, BBRS article
and many more)
Gartner
BBRS
© 2013 SAP AG or an SAP affiliate company. All rights reserved. 12
Cfo.com research (published soon)
42% spend more than half their
time on low-value manual
activities
Cross-departmental analysis:
finance as a service functionAdvanced Analytics – Enterprise
BI - Visualization
TOP: Margin Management
© 2013 SAP AG or an SAP affiliate company. All rights reserved. 13
Functions benefiting from Predictive Analysis
UK USA
Loud House research
© 2013 SAP AG or an SAP affiliate company. All rights reserved. 14
Powerful as an assessment tool
 Assess results sooner and with greater certainty
 Respond faster to actual outcomes
 Can be applied broadly across the company or to a specific customer, especially effective when
businesses are dealing with well-established cyclical patterns
Valuable tools for performance management.
 Automate planning or forecasting and enhance accuracy
 Set benchmarks to assess performance
 Generate alerts to accelerate action
Ventana Research
Predictive Analysis - Predictive Analytics Support Human Judgment
http://robertkugel.ventanaresearch.com/2011/06/10/predictive-analytics-support-human-judgment
© 2013 SAP AG or an SAP affiliate company. All rights reserved. 15
… receivables aging process to collect overdue amounts from customers. Why not take this a step
further? If analysis shows that a specific customer reliably pays within, say, 28 days, why not set an alert
if payment is not received by day 32 that would trigger an automated process for contacting the
customer?
… accuracy of cash forecasting by providing a finer-grain approach to projecting receipts. Rather
than consigning financial analytics to a rear-view-mirror view, companies should be analyzing accounts
proactively to identify slow and fast payers to see if there are systemic issues that should be addressed
or actions that could be taken to manage receivables
… optimize payables as well. In today’s low-interest-rate environment there is limited value to holding
onto excess cash, especially since incentives for early payment can provide a high return. Does your
company manage payables? Can it?
… managing profitability strategically. Individual departments and business units typically focus on
their own profit or cost objectives. Product organizations try to maximize product profitability, sales
organizations may try to maximize revenue, call centers may try to minimize costs. Individually, each of
these moves may be rational, but collectively they can work at cross-purposes, and few companies
focus on managing the sometimes-conflicting objectives of individual parts of the business
Ventana Research
Predictive Analysis - Focus on potential problems rather than fighting fires
http://robertkugel.ventanaresearch.com/2011/07/21/finance-analytics-innovation
Customer Success Story
to be completed
© 2013 SAP AG or an SAP affiliate company. All rights reserved. 17
Customer Use Case
Predictive Analysis – Warranty Prediction: Cash Optimization
© 2013 SAP AG or an SAP affiliate company. All rights reserved. 18
Industry / Use Case Challenges
• Raw materials have very high price volatility
• Tens of thousand of finished products with complex BOMs
• The price scenarios depend on the production plants and distribution countries
• Huge volume of calculations
Solution Details
SAP PIO has provided an high performance algorithm that calculates the costs of each finished product
• Computes all the production costs (raw materials costs, packaging costs, manufacturing costs, distribution costs) using the sales forecast
• Adjusts costs using price scenarios defined for material groups per month and country
• Calculates the costs and quantities at the lowest granularity
• Users may analyze data at arbitrary levels of granularity using drill-down.
Benefit Details
• The customer is able to forecast the production costs and quantities
• SKU-based sales planning can be seen in a P&L view
• Empower the customer to act preemptively
Customer Use Case
Predictive Analysis –production cost modeling using price scenarios and demand forecasts
© 2013 SAP AG or an SAP affiliate company. All rights reserved. 19
Industry / Use Case Challenges
• Difficulty understanding impact to cash flow of highly seasonal business, made more complex by the delays between bookings and billings
• Accurately forecasting revenues and margin to identify underperforming parts of the business
• Taking advantage of each supplier’s / buyer’s unique seasonal behavior
• Recognizing growth rates and performance differences by region
• Understanding demand for parts vs. products vs. bundled solutions, and any cannibalization effects
Solution Details
The use case addressed predictive scenarios of:
• Seasonality factors for sales levels based on booking time series (trend analysis)
• Clustering of sales nodes based on bookings, planning, and assignments (performance analysis)
• Clustering of products based on seasonality of bookings
Benefit Details
• Better respond to customers and deliver tangible business value
• Reduce time to transform information into insights and improvement in the quality of decision-making on those insights
• Ultimately drive higher profitability and growth
Customer Use Case
Predictive Analysis – cash flow optimization
Conclusion
Necessary exercise in the 21st century
© 2013 SAP AG or an SAP affiliate company. All rights reserved. 21
Summary
1
Guiding an organization into a financially positive future is a core function of Finance
2
Plans tell us where we want to go (vision), not where we are heading (direction) or
how to best get there (optimizations)
3
SAP Predictive Analysis creates extrapolations of the future (as analysis and for
optimizations) that enable high value business scenarios with superior business return
© 2013 SAP AG or an SAP affiliate company. All rights reserved. 22
Advanced Analytics & Agile Visualization – check it out
SAP Lumira – Personal Edition (free) SAP Predictive Analysis (30 day trial)
http://bit.ly/personallumira http://bit.ly/PA-test
© 2013 SAP AG or an SAP affiliate company. All rights reserved.
Henner Schliebs
Analytics Audience Marketing
@hschliebs
henner
henner.schliebs@sap.com
hschliebs
Predictive Finance
DEMO
© 2013 SAP AG or an SAP affiliate company. All rights reserved. 26
Predictive Finance
© 2013 SAP AG or an SAP affiliate company. All rights reserved. 27
… select data set
© 2013 SAP AG or an SAP affiliate company. All rights reserved. 28
Grid (view)
© 2013 SAP AG or an SAP affiliate company. All rights reserved. 29
Facets (view)
Trend and Forecast
© 2013 SAP AG or an SAP affiliate company. All rights reserved. 32
Visualize - Actual and planned profit
© 2013 SAP AG or an SAP affiliate company. All rights reserved. 36
Predict - Exponential Smoothing
© 2013 SAP AG or an SAP affiliate company. All rights reserved. 39
Predict - Results (Forecast / 2011)
© 2013 SAP AG or an SAP affiliate company. All rights reserved. 40
Results - Chart
© 2013 SAP AG or an SAP affiliate company. All rights reserved. 42
Visualize - Actual, forecasted and planned profit
© 2013 SAP AG or an SAP affiliate company. All rights reserved. 43
Visualize - Planned and forecasted profit (shortfall)
© 2013 SAP AG or an SAP affiliate company. All rights reserved. 44
Visualize - Baseline (2007), trend (2008-2010), and forecast (2011)
Correlation
© 2013 SAP AG or an SAP affiliate company. All rights reserved. 46
File: external data
© 2013 SAP AG or an SAP affiliate company. All rights reserved. 47
Mapping using calculated timestamp
© 2013 SAP AG or an SAP affiliate company. All rights reserved. 48
Baseline file now contains additional (external) data
© 2013 SAP AG or an SAP affiliate company. All rights reserved. 49
Predict - Filter, Calculate, CSV writer (for demo reporting)
© 2013 SAP AG or an SAP affiliate company. All rights reserved. 52
Predict - Predicted Values
© 2013 SAP AG or an SAP affiliate company. All rights reserved. 54
Correlation: external factors
© 2013 SAP AG or an SAP affiliate company. All rights reserved. 55
Correlation: profit and gas price by month (bad correlation)
© 2013 SAP AG or an SAP affiliate company. All rights reserved. 56
Correlation: profit and predicted value (pretty close)
© 2013 SAP AG or an SAP affiliate company. All rights reserved. 57
Correlation: elasticity of profit based on changes in oil price
Clustering
© 2013 SAP AG or an SAP affiliate company. All rights reserved. 59
Clustering
© 2013 SAP AG or an SAP affiliate company. All rights reserved. 60
© 2013 SAP AG or an SAP affiliate company. All rights reserved. 61
Results - Clusters (Grid)
© 2013 SAP AG or an SAP affiliate company. All rights reserved. 62
Results - Overview (chart)
© 2013 SAP AG or an SAP affiliate company. All rights reserved. 63
Results - Overview (chart)
© 2013 SAP AG or an SAP affiliate company. All rights reserved. 64
Results - Overview (chart)
© 2013 SAP AG or an SAP affiliate company. All rights reserved. 65
Results - Visualized (results are cross-country, customer)
Decision Tree
© 2013 SAP AG or an SAP affiliate company. All rights reserved. 68
Results- Decision Tree

More Related Content

What's hot

Dynamic Planning & Forecasting w Big Data
Dynamic Planning & Forecasting w Big DataDynamic Planning & Forecasting w Big Data
Dynamic Planning & Forecasting w Big Data
Atul Patel
 
Whitepaper: Predictive Analytics - Looking to the Future
Whitepaper: Predictive Analytics - Looking to the FutureWhitepaper: Predictive Analytics - Looking to the Future
Whitepaper: Predictive Analytics - Looking to the Future
Iconixx
 
Analytics-Based Enterprise Performance Management
Analytics-Based Enterprise Performance ManagementAnalytics-Based Enterprise Performance Management
Analytics-Based Enterprise Performance Management
Osvaldo Maldonado
 
Performance management reports
Performance management reportsPerformance management reports
Performance management reports
houghton098
 
Profiting from customer profitability + big data fitzgerald analytics
Profiting from customer profitability + big data fitzgerald analyticsProfiting from customer profitability + big data fitzgerald analytics
Profiting from customer profitability + big data fitzgerald analytics
Fitzgerald Analytics, Inc.
 
Predictive Finance for Oil & Gas customers
Predictive Finance for Oil & Gas customersPredictive Finance for Oil & Gas customers
Predictive Finance for Oil & Gas customers
Henner Schliebs
 
Anaplan Insurance Connected Breakfast
Anaplan Insurance Connected Breakfast Anaplan Insurance Connected Breakfast
Anaplan Insurance Connected Breakfast
Anaplan
 
Trusted Financial Advisors 20090527
Trusted Financial  Advisors 20090527Trusted Financial  Advisors 20090527
Trusted Financial Advisors 20090527
Richiverson
 
Present.profitability analytics framework ima san antonio final
Present.profitability analytics framework ima san antonio finalPresent.profitability analytics framework ima san antonio final
Present.profitability analytics framework ima san antonio final
Fernando Pico
 
Predictive Finance
Predictive FinancePredictive Finance
Predictive Finance
Henner Schliebs
 
Enterprise performance management
Enterprise performance managementEnterprise performance management
Enterprise performance management
mindstremanalysis
 
IT Infrastructure Management Powerpoint Presentation Slides
IT Infrastructure Management Powerpoint Presentation SlidesIT Infrastructure Management Powerpoint Presentation Slides
IT Infrastructure Management Powerpoint Presentation Slides
SlideTeam
 
85/15 Model
85/15 Model 85/15 Model
85/15 Model
Siddharth Jha
 
Analytics in financial services prez behavioral finance + data visualizatio...
Analytics in financial services prez   behavioral finance + data visualizatio...Analytics in financial services prez   behavioral finance + data visualizatio...
Analytics in financial services prez behavioral finance + data visualizatio...Fitzgerald Analytics, Inc.
 
Defining My Brand
Defining My BrandDefining My Brand
Defining My Brand
Joshua Tapley
 
AnaplanOSFINALWebinarPresentation(Forrester)
AnaplanOSFINALWebinarPresentation(Forrester)AnaplanOSFINALWebinarPresentation(Forrester)
AnaplanOSFINALWebinarPresentation(Forrester)
Laura Roach
 

What's hot (18)

Dynamic Planning & Forecasting w Big Data
Dynamic Planning & Forecasting w Big DataDynamic Planning & Forecasting w Big Data
Dynamic Planning & Forecasting w Big Data
 
Whitepaper: Predictive Analytics - Looking to the Future
Whitepaper: Predictive Analytics - Looking to the FutureWhitepaper: Predictive Analytics - Looking to the Future
Whitepaper: Predictive Analytics - Looking to the Future
 
Analytics-Based Enterprise Performance Management
Analytics-Based Enterprise Performance ManagementAnalytics-Based Enterprise Performance Management
Analytics-Based Enterprise Performance Management
 
Performance management reports
Performance management reportsPerformance management reports
Performance management reports
 
Profiting from customer profitability + big data fitzgerald analytics
Profiting from customer profitability + big data fitzgerald analyticsProfiting from customer profitability + big data fitzgerald analytics
Profiting from customer profitability + big data fitzgerald analytics
 
Predictive Finance for Oil & Gas customers
Predictive Finance for Oil & Gas customersPredictive Finance for Oil & Gas customers
Predictive Finance for Oil & Gas customers
 
Anaplan Insurance Connected Breakfast
Anaplan Insurance Connected Breakfast Anaplan Insurance Connected Breakfast
Anaplan Insurance Connected Breakfast
 
Trusted Financial Advisors 20090527
Trusted Financial  Advisors 20090527Trusted Financial  Advisors 20090527
Trusted Financial Advisors 20090527
 
Present.profitability analytics framework ima san antonio final
Present.profitability analytics framework ima san antonio finalPresent.profitability analytics framework ima san antonio final
Present.profitability analytics framework ima san antonio final
 
Predictive Finance
Predictive FinancePredictive Finance
Predictive Finance
 
Enterprise performance management
Enterprise performance managementEnterprise performance management
Enterprise performance management
 
Gary Cokins Enterprise Performance Management (EPM) Analytics
Gary Cokins Enterprise Performance Management (EPM) AnalyticsGary Cokins Enterprise Performance Management (EPM) Analytics
Gary Cokins Enterprise Performance Management (EPM) Analytics
 
Global tech pp
Global tech ppGlobal tech pp
Global tech pp
 
IT Infrastructure Management Powerpoint Presentation Slides
IT Infrastructure Management Powerpoint Presentation SlidesIT Infrastructure Management Powerpoint Presentation Slides
IT Infrastructure Management Powerpoint Presentation Slides
 
85/15 Model
85/15 Model 85/15 Model
85/15 Model
 
Analytics in financial services prez behavioral finance + data visualizatio...
Analytics in financial services prez   behavioral finance + data visualizatio...Analytics in financial services prez   behavioral finance + data visualizatio...
Analytics in financial services prez behavioral finance + data visualizatio...
 
Defining My Brand
Defining My BrandDefining My Brand
Defining My Brand
 
AnaplanOSFINALWebinarPresentation(Forrester)
AnaplanOSFINALWebinarPresentation(Forrester)AnaplanOSFINALWebinarPresentation(Forrester)
AnaplanOSFINALWebinarPresentation(Forrester)
 

Similar to Predictive Finance

Predictive Finance InfoGuide
Predictive Finance InfoGuidePredictive Finance InfoGuide
Predictive Finance InfoGuide
Henner Schliebs
 
Delivering Real-Time Business Value for Insurance
Delivering Real-Time Business Value for InsuranceDelivering Real-Time Business Value for Insurance
Delivering Real-Time Business Value for Insurance
SAP Technology
 
Unleashing the Power of Analytics for Finance & Procurement
Unleashing the Power of Analytics for Finance & ProcurementUnleashing the Power of Analytics for Finance & Procurement
Unleashing the Power of Analytics for Finance & Procurement
SAP Ariba
 
Longview profitability analytics
Longview profitability analyticsLongview profitability analytics
Longview profitability analytics
Longview
 
Vendavo Profit Insights - Deliver 1-3% Margin Improvements in Weeks
Vendavo Profit Insights - Deliver 1-3% Margin Improvements in WeeksVendavo Profit Insights - Deliver 1-3% Margin Improvements in Weeks
Vendavo Profit Insights - Deliver 1-3% Margin Improvements in Weeks
Caroline Burns
 
Net Margin Analysis for Interactive, Graphical Analysis of Profit and Margins
Net Margin Analysis for Interactive, Graphical Analysis of Profit and MarginsNet Margin Analysis for Interactive, Graphical Analysis of Profit and Margins
Net Margin Analysis for Interactive, Graphical Analysis of Profit and Margins
Henner Schliebs
 
G A InfoMart Cognos TM1 planning budgeting-forecasting solution
G A InfoMart Cognos TM1 planning budgeting-forecasting solutionG A InfoMart Cognos TM1 planning budgeting-forecasting solution
G A InfoMart Cognos TM1 planning budgeting-forecasting solution
GA InfoMart Ltd
 
Delivering Real-Time Business Value for Media
Delivering Real-Time Business Value for MediaDelivering Real-Time Business Value for Media
Delivering Real-Time Business Value for Media
SAP Technology
 
EffectiveFinancialForecasting
EffectiveFinancialForecastingEffectiveFinancialForecasting
EffectiveFinancialForecastingNeerajSinghal
 
Sap simple finance by Keval Shah
Sap simple finance by Keval ShahSap simple finance by Keval Shah
Sap simple finance by Keval Shah
Dhananjay Singh (Jay)
 
Achieving Sales Performance Optimization Through Automated Incentive Compensa...
Achieving Sales Performance Optimization Through Automated Incentive Compensa...Achieving Sales Performance Optimization Through Automated Incentive Compensa...
Achieving Sales Performance Optimization Through Automated Incentive Compensa...
Callidus Software
 
Beyond Automation: How Your Company Drives Business Value from Spend Management
Beyond Automation: How Your Company Drives Business Value from Spend ManagementBeyond Automation: How Your Company Drives Business Value from Spend Management
Beyond Automation: How Your Company Drives Business Value from Spend Management
Institute of Singapore Chartered Accountants
 
Intelligent Business Operations for Utilities, powered by SAP HANA
Intelligent Business Operations for Utilities, powered by SAP HANAIntelligent Business Operations for Utilities, powered by SAP HANA
Intelligent Business Operations for Utilities, powered by SAP HANA
Harsh Jegadeesan
 
Sales and operations planning bfs boston 2007
Sales and operations planning   bfs boston 2007Sales and operations planning   bfs boston 2007
Sales and operations planning bfs boston 2007
Charles Novak
 
Demand planning session
Demand planning sessionDemand planning session
Demand planning sessionAlfaPeople US
 
Michel haesendonckx • SAP
Michel haesendonckx • SAPMichel haesendonckx • SAP
Michel haesendonckx • SAP
FDMagazine
 
SAP® S&OP powered by SAP HANA®: Practical Steps to Launch for Results
SAP® S&OP powered by SAP HANA®: Practical Steps to Launch for ResultsSAP® S&OP powered by SAP HANA®: Practical Steps to Launch for Results
SAP® S&OP powered by SAP HANA®: Practical Steps to Launch for Results
Plan4Demand
 
Best in Class Finance Transformation - Best Practices for the Finance Function
Best in Class Finance Transformation - Best Practices for the Finance FunctionBest in Class Finance Transformation - Best Practices for the Finance Function
Best in Class Finance Transformation - Best Practices for the Finance Function
Proformative, Inc.
 
4_Q2-Entrep.pptx
4_Q2-Entrep.pptx4_Q2-Entrep.pptx
4_Q2-Entrep.pptx
SheraRuthFeolino
 

Similar to Predictive Finance (20)

Predictive Finance InfoGuide
Predictive Finance InfoGuidePredictive Finance InfoGuide
Predictive Finance InfoGuide
 
Delivering Real-Time Business Value for Insurance
Delivering Real-Time Business Value for InsuranceDelivering Real-Time Business Value for Insurance
Delivering Real-Time Business Value for Insurance
 
Unleashing the Power of Analytics for Finance & Procurement
Unleashing the Power of Analytics for Finance & ProcurementUnleashing the Power of Analytics for Finance & Procurement
Unleashing the Power of Analytics for Finance & Procurement
 
Longview profitability analytics
Longview profitability analyticsLongview profitability analytics
Longview profitability analytics
 
Vendavo Profit Insights - Deliver 1-3% Margin Improvements in Weeks
Vendavo Profit Insights - Deliver 1-3% Margin Improvements in WeeksVendavo Profit Insights - Deliver 1-3% Margin Improvements in Weeks
Vendavo Profit Insights - Deliver 1-3% Margin Improvements in Weeks
 
Net Margin Analysis for Interactive, Graphical Analysis of Profit and Margins
Net Margin Analysis for Interactive, Graphical Analysis of Profit and MarginsNet Margin Analysis for Interactive, Graphical Analysis of Profit and Margins
Net Margin Analysis for Interactive, Graphical Analysis of Profit and Margins
 
G A InfoMart Cognos TM1 planning budgeting-forecasting solution
G A InfoMart Cognos TM1 planning budgeting-forecasting solutionG A InfoMart Cognos TM1 planning budgeting-forecasting solution
G A InfoMart Cognos TM1 planning budgeting-forecasting solution
 
Delivering Real-Time Business Value for Media
Delivering Real-Time Business Value for MediaDelivering Real-Time Business Value for Media
Delivering Real-Time Business Value for Media
 
EffectiveFinancialForecasting
EffectiveFinancialForecastingEffectiveFinancialForecasting
EffectiveFinancialForecasting
 
Sap simple finance by Keval Shah
Sap simple finance by Keval ShahSap simple finance by Keval Shah
Sap simple finance by Keval Shah
 
Achieving Sales Performance Optimization Through Automated Incentive Compensa...
Achieving Sales Performance Optimization Through Automated Incentive Compensa...Achieving Sales Performance Optimization Through Automated Incentive Compensa...
Achieving Sales Performance Optimization Through Automated Incentive Compensa...
 
Beyond Automation: How Your Company Drives Business Value from Spend Management
Beyond Automation: How Your Company Drives Business Value from Spend ManagementBeyond Automation: How Your Company Drives Business Value from Spend Management
Beyond Automation: How Your Company Drives Business Value from Spend Management
 
Intelligent Business Operations for Utilities, powered by SAP HANA
Intelligent Business Operations for Utilities, powered by SAP HANAIntelligent Business Operations for Utilities, powered by SAP HANA
Intelligent Business Operations for Utilities, powered by SAP HANA
 
BA3
BA3BA3
BA3
 
Sales and operations planning bfs boston 2007
Sales and operations planning   bfs boston 2007Sales and operations planning   bfs boston 2007
Sales and operations planning bfs boston 2007
 
Demand planning session
Demand planning sessionDemand planning session
Demand planning session
 
Michel haesendonckx • SAP
Michel haesendonckx • SAPMichel haesendonckx • SAP
Michel haesendonckx • SAP
 
SAP® S&OP powered by SAP HANA®: Practical Steps to Launch for Results
SAP® S&OP powered by SAP HANA®: Practical Steps to Launch for ResultsSAP® S&OP powered by SAP HANA®: Practical Steps to Launch for Results
SAP® S&OP powered by SAP HANA®: Practical Steps to Launch for Results
 
Best in Class Finance Transformation - Best Practices for the Finance Function
Best in Class Finance Transformation - Best Practices for the Finance FunctionBest in Class Finance Transformation - Best Practices for the Finance Function
Best in Class Finance Transformation - Best Practices for the Finance Function
 
4_Q2-Entrep.pptx
4_Q2-Entrep.pptx4_Q2-Entrep.pptx
4_Q2-Entrep.pptx
 

Recently uploaded

Observation Lab PowerPoint Assignment for TEM 431
Observation Lab PowerPoint Assignment for TEM 431Observation Lab PowerPoint Assignment for TEM 431
Observation Lab PowerPoint Assignment for TEM 431
ecamare2
 
Brand Analysis for an artist named Struan
Brand Analysis for an artist named StruanBrand Analysis for an artist named Struan
Brand Analysis for an artist named Struan
sarahvanessa51503
 
-- June 2024 is National Volunteer Month --
-- June 2024 is National Volunteer Month ---- June 2024 is National Volunteer Month --
-- June 2024 is National Volunteer Month --
NZSG
 
3.0 Project 2_ Developing My Brand Identity Kit.pptx
3.0 Project 2_ Developing My Brand Identity Kit.pptx3.0 Project 2_ Developing My Brand Identity Kit.pptx
3.0 Project 2_ Developing My Brand Identity Kit.pptx
tanyjahb
 
Structural Design Process: Step-by-Step Guide for Buildings
Structural Design Process: Step-by-Step Guide for BuildingsStructural Design Process: Step-by-Step Guide for Buildings
Structural Design Process: Step-by-Step Guide for Buildings
Chandresh Chudasama
 
An introduction to the cryptocurrency investment platform Binance Savings.
An introduction to the cryptocurrency investment platform Binance Savings.An introduction to the cryptocurrency investment platform Binance Savings.
An introduction to the cryptocurrency investment platform Binance Savings.
Any kyc Account
 
Exploring Patterns of Connection with Social Dreaming
Exploring Patterns of Connection with Social DreamingExploring Patterns of Connection with Social Dreaming
Exploring Patterns of Connection with Social Dreaming
Nicola Wreford-Howard
 
Meas_Dylan_DMBS_PB1_2024-05XX_Revised.pdf
Meas_Dylan_DMBS_PB1_2024-05XX_Revised.pdfMeas_Dylan_DMBS_PB1_2024-05XX_Revised.pdf
Meas_Dylan_DMBS_PB1_2024-05XX_Revised.pdf
dylandmeas
 
In the Adani-Hindenburg case, what is SEBI investigating.pptx
In the Adani-Hindenburg case, what is SEBI investigating.pptxIn the Adani-Hindenburg case, what is SEBI investigating.pptx
In the Adani-Hindenburg case, what is SEBI investigating.pptx
Adani case
 
FIA officials brutally tortured innocent and snatched 200 Bitcoins of worth 4...
FIA officials brutally tortured innocent and snatched 200 Bitcoins of worth 4...FIA officials brutally tortured innocent and snatched 200 Bitcoins of worth 4...
FIA officials brutally tortured innocent and snatched 200 Bitcoins of worth 4...
jamalseoexpert1978
 
Best Forex Brokers Comparison in INDIA 2024
Best Forex Brokers Comparison in INDIA 2024Best Forex Brokers Comparison in INDIA 2024
Best Forex Brokers Comparison in INDIA 2024
Top Forex Brokers Review
 
Training my puppy and implementation in this story
Training my puppy and implementation in this storyTraining my puppy and implementation in this story
Training my puppy and implementation in this story
WilliamRodrigues148
 
Authentically Social by Corey Perlman - EO Puerto Rico
Authentically Social by Corey Perlman - EO Puerto RicoAuthentically Social by Corey Perlman - EO Puerto Rico
Authentically Social by Corey Perlman - EO Puerto Rico
Corey Perlman, Social Media Speaker and Consultant
 
LA HUG - Video Testimonials with Chynna Morgan - June 2024
LA HUG - Video Testimonials with Chynna Morgan - June 2024LA HUG - Video Testimonials with Chynna Morgan - June 2024
LA HUG - Video Testimonials with Chynna Morgan - June 2024
Lital Barkan
 
The 10 Most Influential Leaders Guiding Corporate Evolution, 2024.pdf
The 10 Most Influential Leaders Guiding Corporate Evolution, 2024.pdfThe 10 Most Influential Leaders Guiding Corporate Evolution, 2024.pdf
The 10 Most Influential Leaders Guiding Corporate Evolution, 2024.pdf
thesiliconleaders
 
Anny Serafina Love - Letter of Recommendation by Kellen Harkins, MS.
Anny Serafina Love - Letter of Recommendation by Kellen Harkins, MS.Anny Serafina Love - Letter of Recommendation by Kellen Harkins, MS.
Anny Serafina Love - Letter of Recommendation by Kellen Harkins, MS.
AnnySerafinaLove
 
Hamster Kombat' Telegram Game Surpasses 100 Million Players—Token Release Sch...
Hamster Kombat' Telegram Game Surpasses 100 Million Players—Token Release Sch...Hamster Kombat' Telegram Game Surpasses 100 Million Players—Token Release Sch...
Hamster Kombat' Telegram Game Surpasses 100 Million Players—Token Release Sch...
SOFTTECHHUB
 
Best practices for project execution and delivery
Best practices for project execution and deliveryBest practices for project execution and delivery
Best practices for project execution and delivery
CLIVE MINCHIN
 
How to Implement a Real Estate CRM Software
How to Implement a Real Estate CRM SoftwareHow to Implement a Real Estate CRM Software
How to Implement a Real Estate CRM Software
SalesTown
 
一比一原版加拿大渥太华大学毕业证(uottawa毕业证书)如何办理
一比一原版加拿大渥太华大学毕业证(uottawa毕业证书)如何办理一比一原版加拿大渥太华大学毕业证(uottawa毕业证书)如何办理
一比一原版加拿大渥太华大学毕业证(uottawa毕业证书)如何办理
taqyed
 

Recently uploaded (20)

Observation Lab PowerPoint Assignment for TEM 431
Observation Lab PowerPoint Assignment for TEM 431Observation Lab PowerPoint Assignment for TEM 431
Observation Lab PowerPoint Assignment for TEM 431
 
Brand Analysis for an artist named Struan
Brand Analysis for an artist named StruanBrand Analysis for an artist named Struan
Brand Analysis for an artist named Struan
 
-- June 2024 is National Volunteer Month --
-- June 2024 is National Volunteer Month ---- June 2024 is National Volunteer Month --
-- June 2024 is National Volunteer Month --
 
3.0 Project 2_ Developing My Brand Identity Kit.pptx
3.0 Project 2_ Developing My Brand Identity Kit.pptx3.0 Project 2_ Developing My Brand Identity Kit.pptx
3.0 Project 2_ Developing My Brand Identity Kit.pptx
 
Structural Design Process: Step-by-Step Guide for Buildings
Structural Design Process: Step-by-Step Guide for BuildingsStructural Design Process: Step-by-Step Guide for Buildings
Structural Design Process: Step-by-Step Guide for Buildings
 
An introduction to the cryptocurrency investment platform Binance Savings.
An introduction to the cryptocurrency investment platform Binance Savings.An introduction to the cryptocurrency investment platform Binance Savings.
An introduction to the cryptocurrency investment platform Binance Savings.
 
Exploring Patterns of Connection with Social Dreaming
Exploring Patterns of Connection with Social DreamingExploring Patterns of Connection with Social Dreaming
Exploring Patterns of Connection with Social Dreaming
 
Meas_Dylan_DMBS_PB1_2024-05XX_Revised.pdf
Meas_Dylan_DMBS_PB1_2024-05XX_Revised.pdfMeas_Dylan_DMBS_PB1_2024-05XX_Revised.pdf
Meas_Dylan_DMBS_PB1_2024-05XX_Revised.pdf
 
In the Adani-Hindenburg case, what is SEBI investigating.pptx
In the Adani-Hindenburg case, what is SEBI investigating.pptxIn the Adani-Hindenburg case, what is SEBI investigating.pptx
In the Adani-Hindenburg case, what is SEBI investigating.pptx
 
FIA officials brutally tortured innocent and snatched 200 Bitcoins of worth 4...
FIA officials brutally tortured innocent and snatched 200 Bitcoins of worth 4...FIA officials brutally tortured innocent and snatched 200 Bitcoins of worth 4...
FIA officials brutally tortured innocent and snatched 200 Bitcoins of worth 4...
 
Best Forex Brokers Comparison in INDIA 2024
Best Forex Brokers Comparison in INDIA 2024Best Forex Brokers Comparison in INDIA 2024
Best Forex Brokers Comparison in INDIA 2024
 
Training my puppy and implementation in this story
Training my puppy and implementation in this storyTraining my puppy and implementation in this story
Training my puppy and implementation in this story
 
Authentically Social by Corey Perlman - EO Puerto Rico
Authentically Social by Corey Perlman - EO Puerto RicoAuthentically Social by Corey Perlman - EO Puerto Rico
Authentically Social by Corey Perlman - EO Puerto Rico
 
LA HUG - Video Testimonials with Chynna Morgan - June 2024
LA HUG - Video Testimonials with Chynna Morgan - June 2024LA HUG - Video Testimonials with Chynna Morgan - June 2024
LA HUG - Video Testimonials with Chynna Morgan - June 2024
 
The 10 Most Influential Leaders Guiding Corporate Evolution, 2024.pdf
The 10 Most Influential Leaders Guiding Corporate Evolution, 2024.pdfThe 10 Most Influential Leaders Guiding Corporate Evolution, 2024.pdf
The 10 Most Influential Leaders Guiding Corporate Evolution, 2024.pdf
 
Anny Serafina Love - Letter of Recommendation by Kellen Harkins, MS.
Anny Serafina Love - Letter of Recommendation by Kellen Harkins, MS.Anny Serafina Love - Letter of Recommendation by Kellen Harkins, MS.
Anny Serafina Love - Letter of Recommendation by Kellen Harkins, MS.
 
Hamster Kombat' Telegram Game Surpasses 100 Million Players—Token Release Sch...
Hamster Kombat' Telegram Game Surpasses 100 Million Players—Token Release Sch...Hamster Kombat' Telegram Game Surpasses 100 Million Players—Token Release Sch...
Hamster Kombat' Telegram Game Surpasses 100 Million Players—Token Release Sch...
 
Best practices for project execution and delivery
Best practices for project execution and deliveryBest practices for project execution and delivery
Best practices for project execution and delivery
 
How to Implement a Real Estate CRM Software
How to Implement a Real Estate CRM SoftwareHow to Implement a Real Estate CRM Software
How to Implement a Real Estate CRM Software
 
一比一原版加拿大渥太华大学毕业证(uottawa毕业证书)如何办理
一比一原版加拿大渥太华大学毕业证(uottawa毕业证书)如何办理一比一原版加拿大渥太华大学毕业证(uottawa毕业证书)如何办理
一比一原版加拿大渥太华大学毕业证(uottawa毕业证书)如何办理
 

Predictive Finance

  • 2. © 2013 SAP AG or an SAP affiliate company. All rights reserved. 2 Finance Excellence: Guidance on, Guiding for the future Core functions of effective organizations :  Reporting of historic financial information AND  Guidance on and guiding expected (future) results source: Association of Accountants and Financial Professionals in Business (IMA): Conceptual Framework for Managerial Costing
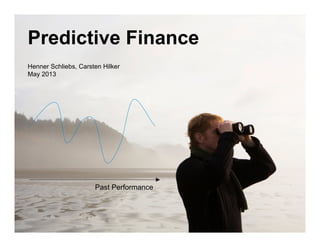
  • 3. © 2013 SAP AG or an SAP affiliate company. All rights reserved. 3 The Finance Conundrum: What is the future ? Based on the past  what is likely going to happen ?  Which factors are correlated with others or impact the future ?  Plans tell us where we want to go (vision), not where we are heading (direction) Vision (Plan) Direction (Reality) Indicators (Trends) Past Performance
  • 4. © 2013 SAP AG or an SAP affiliate company. All rights reserved. 4 Predictive Finance Examine the past. Extrapolate the future  Examine current and historical data to make representations about the future  Representations close enough to be useful; risk and uncertainty are inherent  Encompasses (formal statistical) methods  Exploits patterns, trends, variances, and correlations Terms similar to “prediction “include but are not limited to “estimation”, “approximation”, “projection”, “forecasting”, and “extrapolation”
  • 6. © 2013 SAP AG or an SAP affiliate company. All rights reserved. 6 What if you could… Address your future finance needs by anticipating them today Sense & Respond Predict & Act Raw Data Cleaned Data Standard Reports Ad Hoc Reports & OLAP Generic Predictive Analytics Predictive Modeling Optimization What happened? Why did it happen? What will happen? What is the best that could happen? CompetitiveAdvantage Maturity of Analytics Capabilities Finance Analytics influenced decision making process DECIPHERING DATA > SENSING & RESPONSE > PREDICTION & ACTION
  • 7. © 2013 SAP AG or an SAP affiliate company. All rights reserved. 7 Predictive Finance Analyses and Optimization scenarios for Profitability and Performance Cost, margin and other financial trends  Time series (Forecasting) Profitability analysis (A also bought XYZ)  Associations (Identification) Optimized performance management  Classification (Decision Trees) Proactive detection of financial risks  Outliers (Anomaly detection) Late payers - attributes (Receivables)  Clustering (Segmentation) Company performance (external factors)  Classification (Correlations) AnalyzeOptimize
  • 8. © 2013 SAP AG or an SAP affiliate company. All rights reserved. 8 SAP Predictive Analysis - Key Finance process component SAP Predictive Analysis allows end-to-end SAP coverage for the record-to-act management process. Results of the analysis process step are used to take action (plan, re-plan, or management action outside SAP system) Record Report Analyze Act  SAP Predictive Analysis  SAP Net Margin Analysis  SAP Business Planning  SAP ERP  SAP EPM  BOBJ BI platform  SAP Accelerators  SAP ERP foundation  SAP Accelerators Record-to-act management process
  • 9. © 2013 SAP AG or an SAP affiliate company. All rights reserved. 9 Manage Financial Risk SAP Predictive Analysis - Finance Value Proposition Optimize business opportunities Outperform Financial Objectives  Reach your business goals faster by turning dormant data into new opportunities  Stay agile and gain a competitive edge with efficient forecasting and planning  Solve problems before they happen by exposing hidden risks and hazards
  • 11. © 2013 SAP AG or an SAP affiliate company. All rights reserved. 11 Importance of the CFO and the Finance Organization Changing role of the CFO  CFO are the most influential personas in the corporation, trend: replace the CEO  (advanced) Analytics is a top topic for CFOs (cfo.com study, Deloitte, BBRS article and many more) Gartner BBRS
  • 12. © 2013 SAP AG or an SAP affiliate company. All rights reserved. 12 Cfo.com research (published soon) 42% spend more than half their time on low-value manual activities Cross-departmental analysis: finance as a service functionAdvanced Analytics – Enterprise BI - Visualization TOP: Margin Management
  • 13. © 2013 SAP AG or an SAP affiliate company. All rights reserved. 13 Functions benefiting from Predictive Analysis UK USA Loud House research
  • 14. © 2013 SAP AG or an SAP affiliate company. All rights reserved. 14 Powerful as an assessment tool  Assess results sooner and with greater certainty  Respond faster to actual outcomes  Can be applied broadly across the company or to a specific customer, especially effective when businesses are dealing with well-established cyclical patterns Valuable tools for performance management.  Automate planning or forecasting and enhance accuracy  Set benchmarks to assess performance  Generate alerts to accelerate action Ventana Research Predictive Analysis - Predictive Analytics Support Human Judgment http://robertkugel.ventanaresearch.com/2011/06/10/predictive-analytics-support-human-judgment
  • 15. © 2013 SAP AG or an SAP affiliate company. All rights reserved. 15 … receivables aging process to collect overdue amounts from customers. Why not take this a step further? If analysis shows that a specific customer reliably pays within, say, 28 days, why not set an alert if payment is not received by day 32 that would trigger an automated process for contacting the customer? … accuracy of cash forecasting by providing a finer-grain approach to projecting receipts. Rather than consigning financial analytics to a rear-view-mirror view, companies should be analyzing accounts proactively to identify slow and fast payers to see if there are systemic issues that should be addressed or actions that could be taken to manage receivables … optimize payables as well. In today’s low-interest-rate environment there is limited value to holding onto excess cash, especially since incentives for early payment can provide a high return. Does your company manage payables? Can it? … managing profitability strategically. Individual departments and business units typically focus on their own profit or cost objectives. Product organizations try to maximize product profitability, sales organizations may try to maximize revenue, call centers may try to minimize costs. Individually, each of these moves may be rational, but collectively they can work at cross-purposes, and few companies focus on managing the sometimes-conflicting objectives of individual parts of the business Ventana Research Predictive Analysis - Focus on potential problems rather than fighting fires http://robertkugel.ventanaresearch.com/2011/07/21/finance-analytics-innovation
  • 17. © 2013 SAP AG or an SAP affiliate company. All rights reserved. 17 Customer Use Case Predictive Analysis – Warranty Prediction: Cash Optimization
  • 18. © 2013 SAP AG or an SAP affiliate company. All rights reserved. 18 Industry / Use Case Challenges • Raw materials have very high price volatility • Tens of thousand of finished products with complex BOMs • The price scenarios depend on the production plants and distribution countries • Huge volume of calculations Solution Details SAP PIO has provided an high performance algorithm that calculates the costs of each finished product • Computes all the production costs (raw materials costs, packaging costs, manufacturing costs, distribution costs) using the sales forecast • Adjusts costs using price scenarios defined for material groups per month and country • Calculates the costs and quantities at the lowest granularity • Users may analyze data at arbitrary levels of granularity using drill-down. Benefit Details • The customer is able to forecast the production costs and quantities • SKU-based sales planning can be seen in a P&L view • Empower the customer to act preemptively Customer Use Case Predictive Analysis –production cost modeling using price scenarios and demand forecasts
  • 19. © 2013 SAP AG or an SAP affiliate company. All rights reserved. 19 Industry / Use Case Challenges • Difficulty understanding impact to cash flow of highly seasonal business, made more complex by the delays between bookings and billings • Accurately forecasting revenues and margin to identify underperforming parts of the business • Taking advantage of each supplier’s / buyer’s unique seasonal behavior • Recognizing growth rates and performance differences by region • Understanding demand for parts vs. products vs. bundled solutions, and any cannibalization effects Solution Details The use case addressed predictive scenarios of: • Seasonality factors for sales levels based on booking time series (trend analysis) • Clustering of sales nodes based on bookings, planning, and assignments (performance analysis) • Clustering of products based on seasonality of bookings Benefit Details • Better respond to customers and deliver tangible business value • Reduce time to transform information into insights and improvement in the quality of decision-making on those insights • Ultimately drive higher profitability and growth Customer Use Case Predictive Analysis – cash flow optimization
  • 21. © 2013 SAP AG or an SAP affiliate company. All rights reserved. 21 Summary 1 Guiding an organization into a financially positive future is a core function of Finance 2 Plans tell us where we want to go (vision), not where we are heading (direction) or how to best get there (optimizations) 3 SAP Predictive Analysis creates extrapolations of the future (as analysis and for optimizations) that enable high value business scenarios with superior business return
  • 22. © 2013 SAP AG or an SAP affiliate company. All rights reserved. 22 Advanced Analytics & Agile Visualization – check it out SAP Lumira – Personal Edition (free) SAP Predictive Analysis (30 day trial) http://bit.ly/personallumira http://bit.ly/PA-test
  • 23. © 2013 SAP AG or an SAP affiliate company. All rights reserved. Henner Schliebs Analytics Audience Marketing @hschliebs henner henner.schliebs@sap.com hschliebs
  • 25. © 2013 SAP AG or an SAP affiliate company. All rights reserved. 26 Predictive Finance
  • 26. © 2013 SAP AG or an SAP affiliate company. All rights reserved. 27 … select data set
  • 27. © 2013 SAP AG or an SAP affiliate company. All rights reserved. 28 Grid (view)
  • 28. © 2013 SAP AG or an SAP affiliate company. All rights reserved. 29 Facets (view)
  • 30. © 2013 SAP AG or an SAP affiliate company. All rights reserved. 32 Visualize - Actual and planned profit
  • 31. © 2013 SAP AG or an SAP affiliate company. All rights reserved. 36 Predict - Exponential Smoothing
  • 32. © 2013 SAP AG or an SAP affiliate company. All rights reserved. 39 Predict - Results (Forecast / 2011)
  • 33. © 2013 SAP AG or an SAP affiliate company. All rights reserved. 40 Results - Chart
  • 34. © 2013 SAP AG or an SAP affiliate company. All rights reserved. 42 Visualize - Actual, forecasted and planned profit
  • 35. © 2013 SAP AG or an SAP affiliate company. All rights reserved. 43 Visualize - Planned and forecasted profit (shortfall)
  • 36. © 2013 SAP AG or an SAP affiliate company. All rights reserved. 44 Visualize - Baseline (2007), trend (2008-2010), and forecast (2011)
  • 38. © 2013 SAP AG or an SAP affiliate company. All rights reserved. 46 File: external data
  • 39. © 2013 SAP AG or an SAP affiliate company. All rights reserved. 47 Mapping using calculated timestamp
  • 40. © 2013 SAP AG or an SAP affiliate company. All rights reserved. 48 Baseline file now contains additional (external) data
  • 41. © 2013 SAP AG or an SAP affiliate company. All rights reserved. 49 Predict - Filter, Calculate, CSV writer (for demo reporting)
  • 42. © 2013 SAP AG or an SAP affiliate company. All rights reserved. 52 Predict - Predicted Values
  • 43. © 2013 SAP AG or an SAP affiliate company. All rights reserved. 54 Correlation: external factors
  • 44. © 2013 SAP AG or an SAP affiliate company. All rights reserved. 55 Correlation: profit and gas price by month (bad correlation)
  • 45. © 2013 SAP AG or an SAP affiliate company. All rights reserved. 56 Correlation: profit and predicted value (pretty close)
  • 46. © 2013 SAP AG or an SAP affiliate company. All rights reserved. 57 Correlation: elasticity of profit based on changes in oil price
  • 48. © 2013 SAP AG or an SAP affiliate company. All rights reserved. 59 Clustering
  • 49. © 2013 SAP AG or an SAP affiliate company. All rights reserved. 60
  • 50. © 2013 SAP AG or an SAP affiliate company. All rights reserved. 61 Results - Clusters (Grid)
  • 51. © 2013 SAP AG or an SAP affiliate company. All rights reserved. 62 Results - Overview (chart)
  • 52. © 2013 SAP AG or an SAP affiliate company. All rights reserved. 63 Results - Overview (chart)
  • 53. © 2013 SAP AG or an SAP affiliate company. All rights reserved. 64 Results - Overview (chart)
  • 54. © 2013 SAP AG or an SAP affiliate company. All rights reserved. 65 Results - Visualized (results are cross-country, customer)
  • 56. © 2013 SAP AG or an SAP affiliate company. All rights reserved. 68 Results- Decision Tree

Editor's Notes

  1. Today, finance departments are challenged to play a more strategic role in their company. This means shifting the focus from executing rote tasks to providing greater analytical and forward-looking support to other parts of the organization. Moreover, there has been an increase in business regulation in the United States over the past Ventana Research Value Index: Financial Performance Management 2013 several years, while worldwide all companies are having to adapt to converging accounting standards. Information technology – and FPM software suites in particular – help finance executives make the transition to a more strategic role and meet the evolving challenges finance departments face.
  2. Today, finance departments are challenged to play a more strategic role in their company. This means shifting the focus from executing rote tasks to providing greater analytical and forward-looking support to other parts of the organization. Moreover, there has been an increase in business regulation in the United States over the past Ventana Research Value Index: Financial Performance Management 2013 several years, while worldwide all companies are having to adapt to converging accounting standards. Information technology – and FPM software suites in particular – help finance executives make the transition to a more strategic role and meet the evolving challenges finance departments face.
  3. Today, finance departments are challenged to play a more strategic role in their company. This means shifting the focus from executing rote tasks to providing greater analytical and forward-looking support to other parts of the organization. Moreover, there has been an increase in business regulation in the United States over the past Ventana Research Value Index: Financial Performance Management 2013 several years, while worldwide all companies are having to adapt to converging accounting standards. Information technology – and FPM software suites in particular – help finance executives make the transition to a more strategic role and meet the evolving challenges finance departments face.
  4. How can we transform your industry with new technologies like Burberry is doing in Retail ? First and foremost, you need to overcome the issues caused by the current database landscapeOver the years unplanned growth in transactional databases and associated systems have complicated data infrastructure. As variety of data sources with growing volume are increasing, it is causing severe latency issues. Data once generated from transactions gets replicated to several locations for reporting. It gets processed for various end systems for analytics. This proliferations of data through various stages and processes has significantly increased latency resulting in slow response. As data from different sources is simultaneously pushed to the users, it results in usability issues.The overall architecture is extremely complex to manage given limited resources. This not only increases the risk of data management, such as security, privacy & availability. More data get dispersed, higher the risk. McKinsey report: United States alone faces a shortage of 140,000 to 190,000 people with deep analytical skills as well as 1.5 million managers and analysts to analyze big data and make decisions based on their findings
  5. Today, finance departments are challenged to play a more strategic role in their company. This means shifting the focus from executing rote tasks to providing greater analytical and forward-looking support to other parts of the organization. Moreover, there has been an increase in business regulation in the United States over the past Ventana Research Value Index: Financial Performance Management 2013 several years, while worldwide all companies are having to adapt to converging accounting standards. Information technology – and FPM software suites in particular – help finance executives make the transition to a more strategic role and meet the evolving challenges finance departments face.
  6. Predicting the future of predictive analytics Finance (50%; 47%), Sales (UK 45%; USA 52%) and Marketing (42%; 53%) are expected to benefit most from the effective use of predictive analytics The business as a whole (70%; 67%) is agreed to be the best driver of predictive analytics for optimal use in an organisationPredicting customer needs (80%; 90%) and market trends (78%; 90%) are seen to be valuable scenarios for which to use predictive analytics
  7. Load data directly from you CO-PA tables in HANA, from any database or simply from text files
  8. In this case: CO-PA data from HANA (CO-PA Accelerator)
  9. Instantly see the data imported and select columns needed
  10. See data stacked by dimension
  11. Instantly see you data – in this case as bars over the months
  12. Add planned profit, potentially imported from SAP BPC or the planning tool of your choice. Pull it directly from HANA if you’re running on BPC10 NW, HANA edition
  13. Move to the “predict” tab on the top, and start your calculations
  14. Better filter as you don’t need all of your data, so you can focus on the important
  15. In this case select the time range you want to focus on.
  16. We’d want to predict profit based on historic values using a standard algorithm delivered through Predictive Analysis. More algorithms can be found in the (optional) HANA Predictive Algorithm Library (PAL) or imported from open source “R” libraries
  17. Select the measure that you want to calculate (in this case PROFIT) and the number of base periods you’d want to calculate (12 MONTHS in this case)
  18. And see the results instantly.
  19. Including the predicted 12 months into the future
  20. Visualization as a chart through he powerful capabilities of the visualization engine…
  21. Or like here as visualization through (SAP Lumira, aka Visual Intelligence) showing ACTUALS and the forecasted profit
  22. It gets really interesting if you add the PLAN values and see the discrepancy between the PLAN and the predicted FORECAST
  23. Modify the chart type and you can instantly figure the shortfall in PROFITS to be expected over the next months. Take action and revise your plan!
  24. Visualizing the baseline (2007), the trend (2008-2010) and the predicted forecast (2011) in one grafic
  25. Add external data to your analyses and calculations. IN this case we add population, imports, exports, unemployment rates, gas prices and some others to figure if there is a correlation between those indexes and our profits
  26. Let the system do the merging work – in this case we have a matching dimension TIME
  27. The data is now enriched with the external data that we uploaded. You can download this kind of data from public sources.
  28. Write the new data set into a new flat file if you want.
  29. Again, filter to the relevant dimension members if needed.
  30. Leverage an “R” calculation model to find correlations between the external data dimensions (oil price, unemployment rate etc) and your PROFIT. This calculation is done in real time in the HANA box if you want, and again, no scripting needed.
  31. Table view of the newly calculated data
  32. Switch to the integrated data table view
  33. And visualize the correlations between the dimensions, in this case gas price, unemployment rate and oil price
  34. To add the profit in correlation to gasprice
  35. Profit in correlation to XYZ (does this resonate? Should be UNRATE or something, right?)
  36. Or visualize the elasticity of profit based on changes in oil price as an example (with the size of the bubble indicating the profit in a month)
  37. Powerful predictive models include clustering: standard algorithms to be leveraged in order to find out about groups with similarity in certain dimensions
  38. Definition of the calculation: input dimensions and number of wanted clusters. The complex calculation method is hidden from the user as this is an end user experience – no PhD needed 
  39. Results shown as a table
  40. Results shown as a visualization. Note: top right grafic shows a relatively high density in cluster 4 with 40 occasions
  41. Modifying the slider bottom left to cluster 4 shows that this is the most profitable cluster
  42. Change the variable in the bottom left grafic to margin you can also see the margin contribution per cluster and analyze….
  43. Analyze your profitable cluster 4 – in this case per country and customer in that cluster to take action
  44. Now you want to analyze how the cluster 4 was created with a decision tree. Again: let the system do it for you, just choose the contributing factors from this definition wizard.
  45. And show the decision tree: seeing that profit is above 151243 (in 57.53% of all cases), from a certain region….