Downloaded 76 times


![VIMANA by System
Insights Copyright © 2016 System Insights, All Rights Reserved
Semantic Transformation
31
0102030
40 50 60 70
8090100
010100100
a = 5000
b = 12.43
c = 87.22
d = 2
Device
Linear X
Position: 196.54mm
Load: 12.43%
Rotary C
Rotary Velocity: 87.22 RPM
Controller
Execution: ACTIVE
Meaning
Syntax SemanticsRaw Data
Propriatary Structure Wisdom
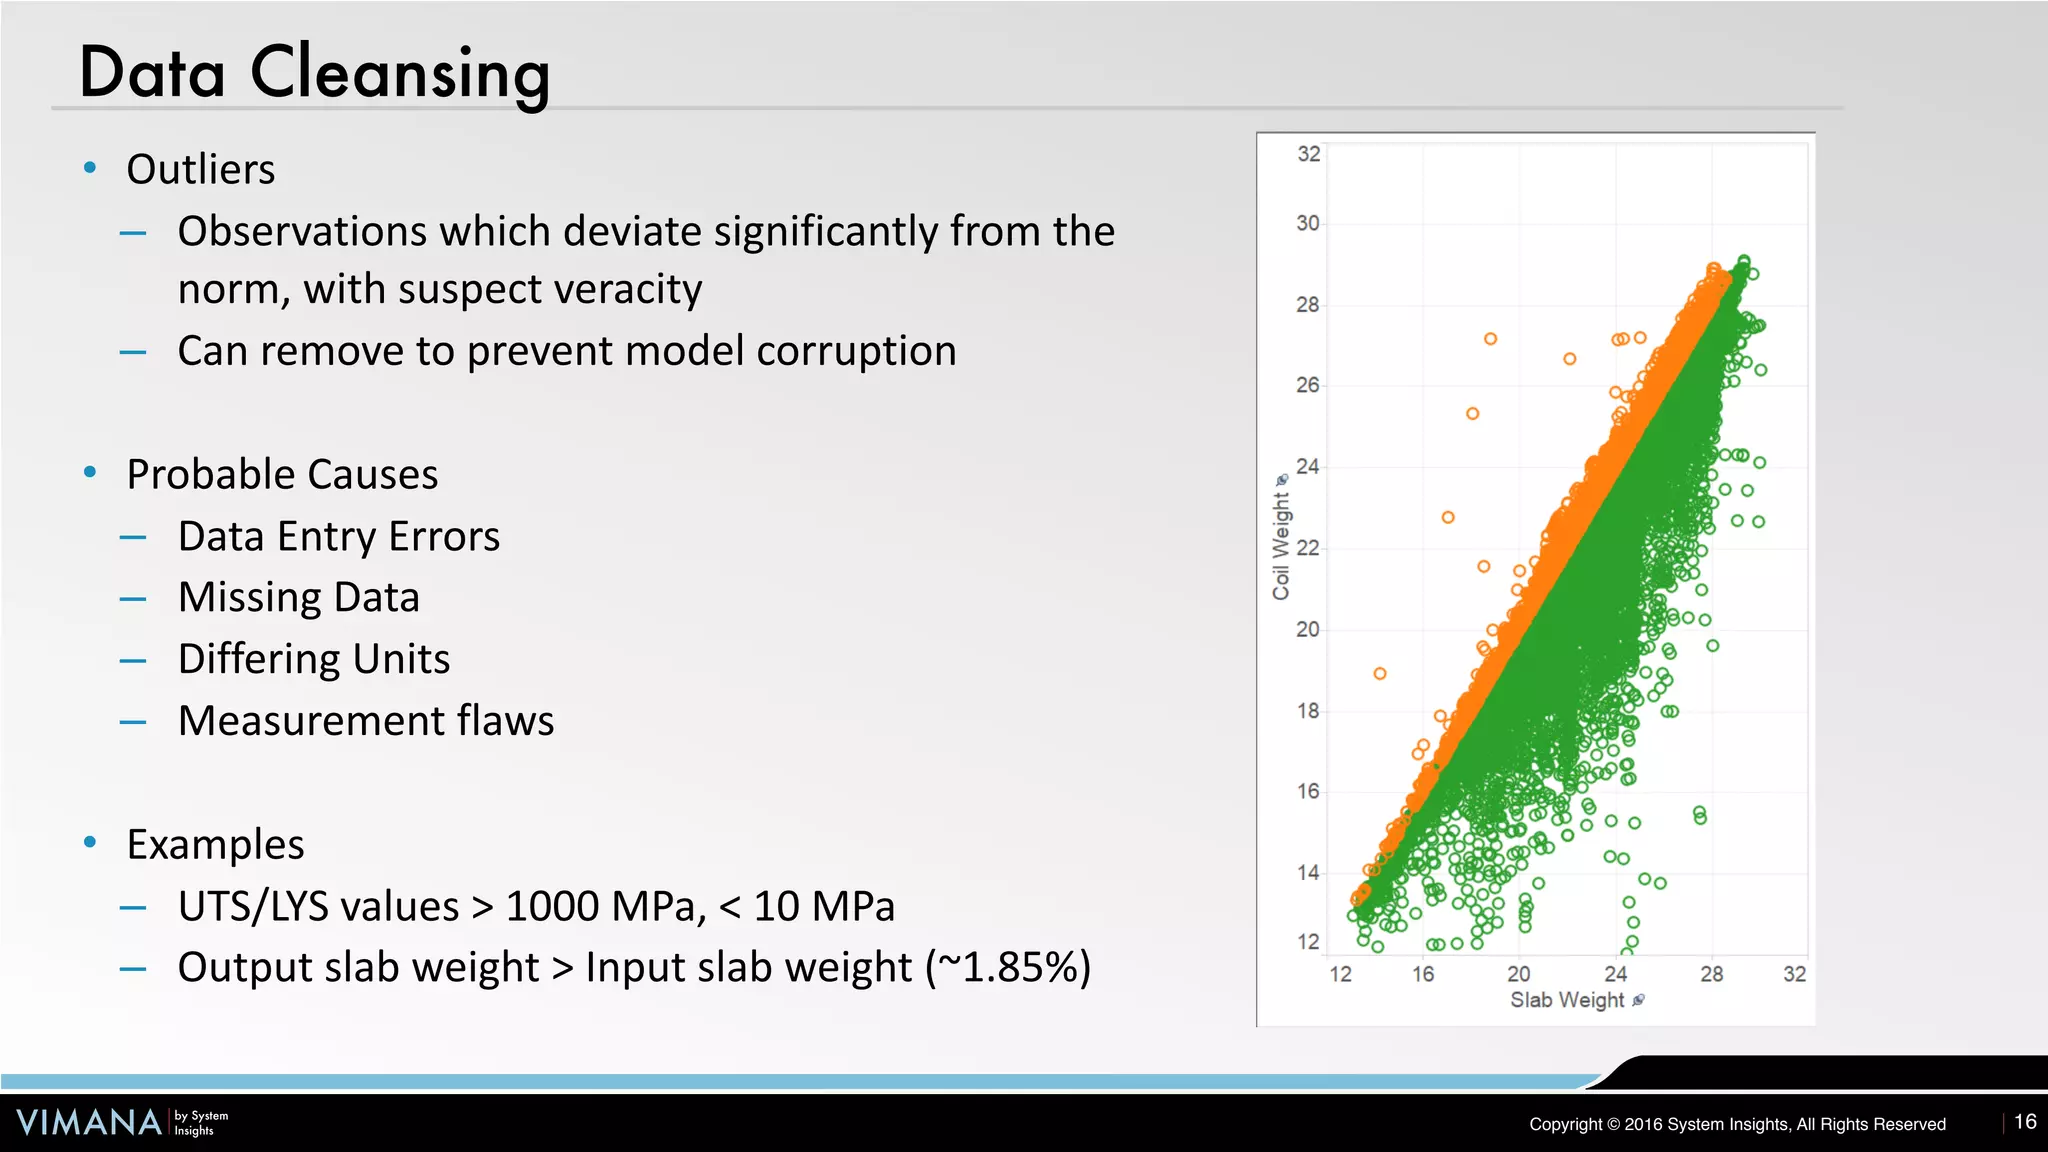
Bad
Good
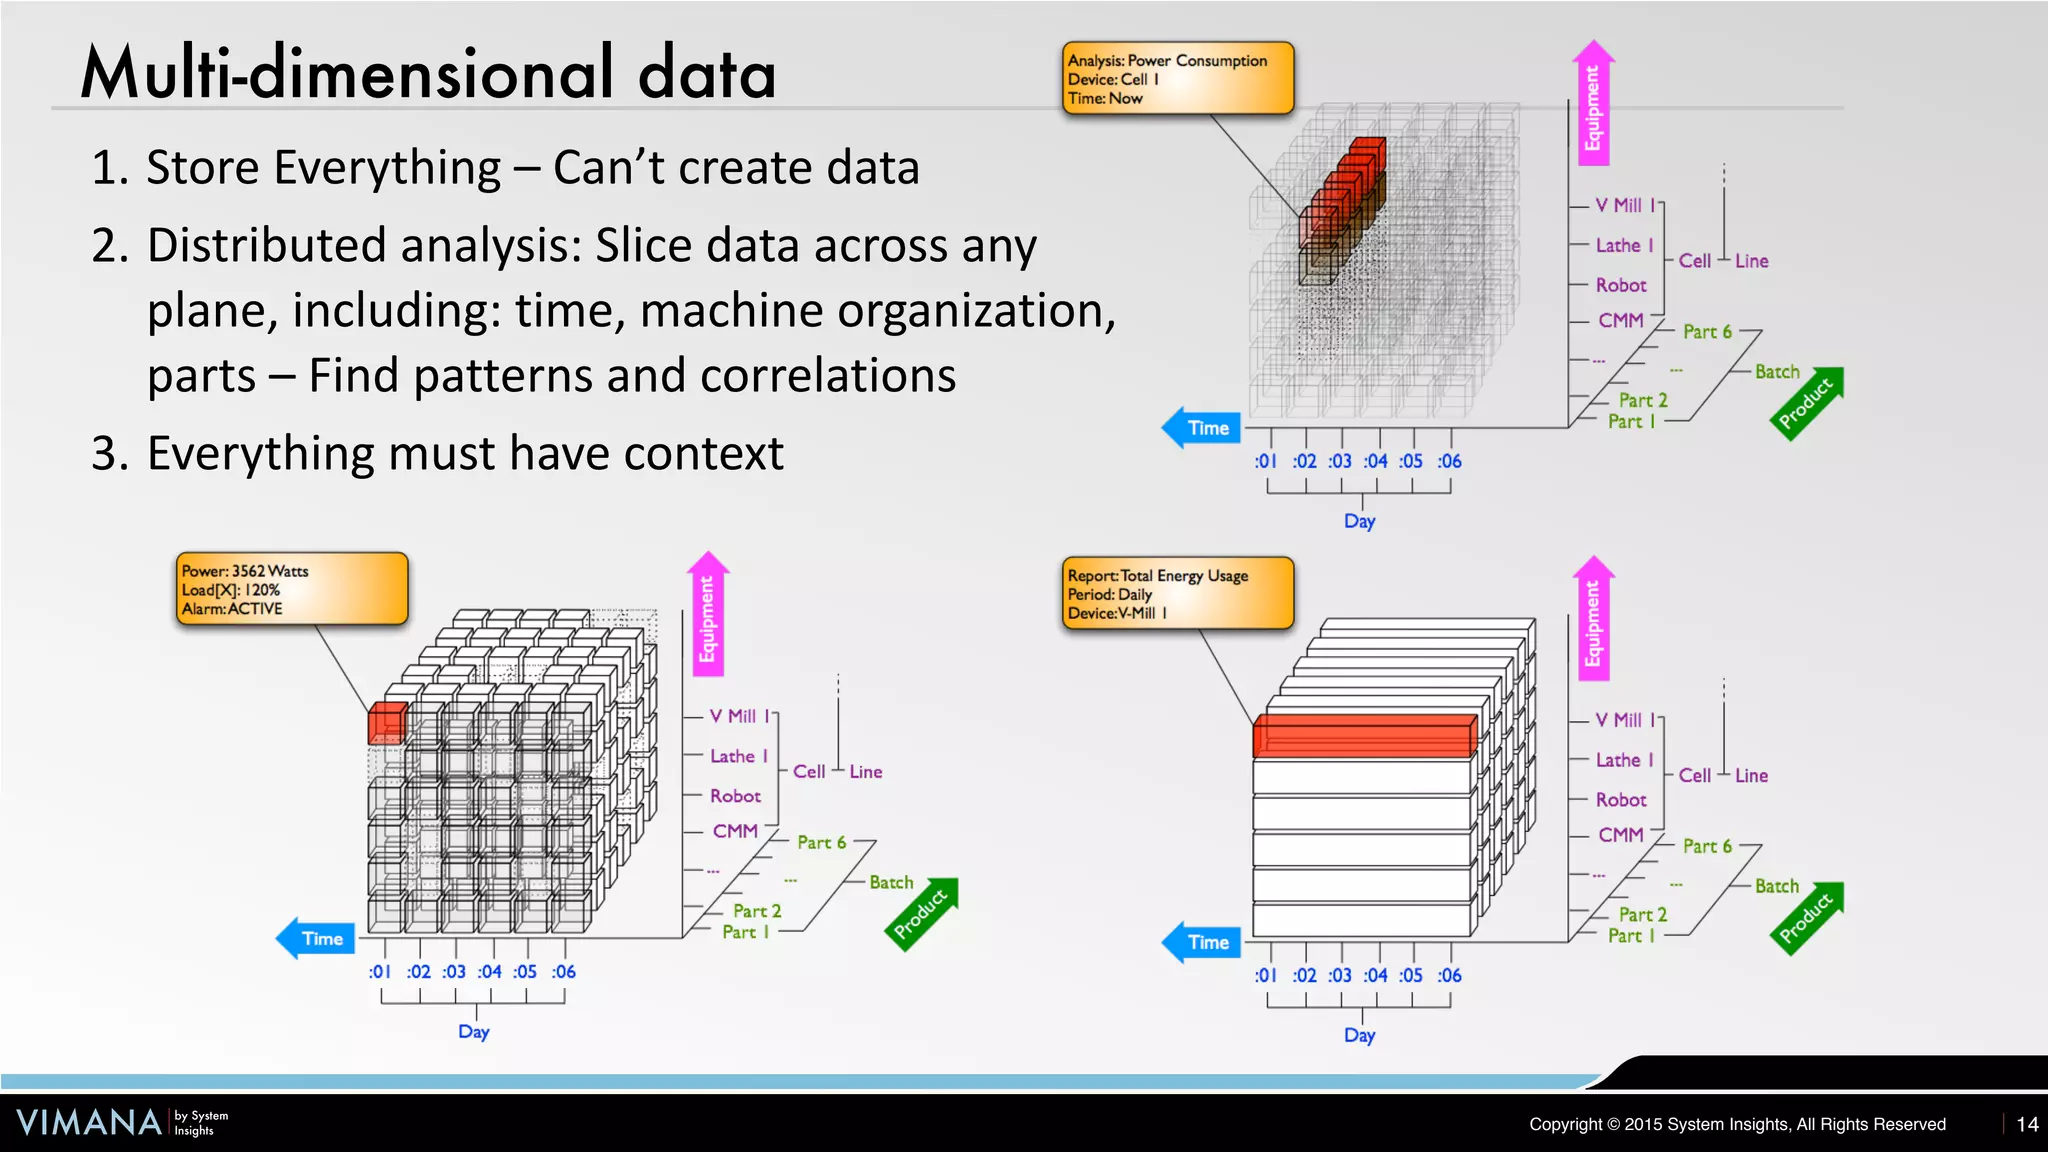
:01 :02 :03 :04 :05 :06
V Mill 1
Lathe 1
Robot
CMM
Cell
Day
Line
Part 1
Part 2
Part 6
......
Batch
Execution:ACTIVE
Load[X]: 120%
Feedrate[Override]: 80%
Time
Equipment
Product
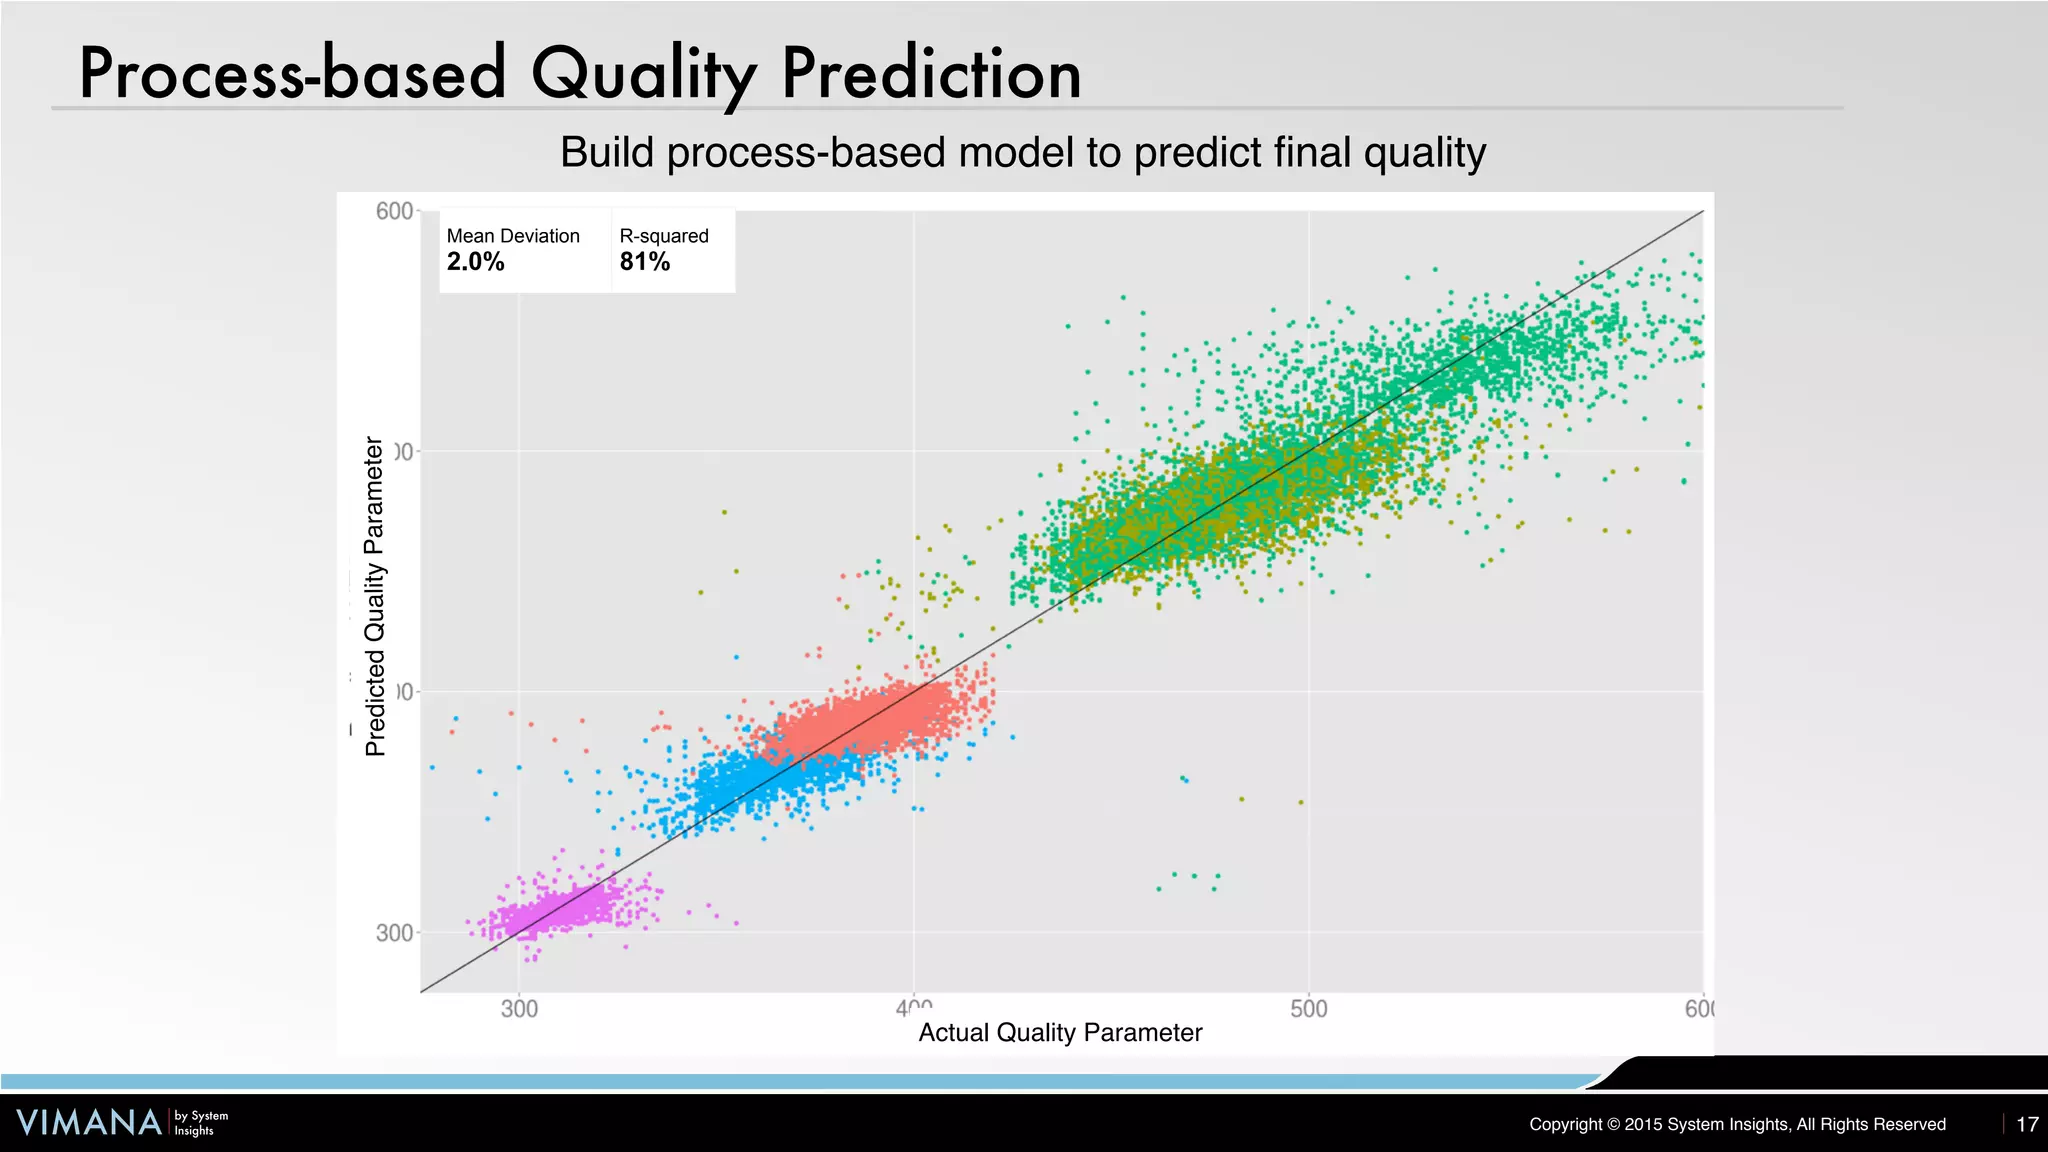
Analysis Predictive
Prognositcs
Value
Information
Data Enrichment
part XY32 – part AB56 –
Producing part AB56
at avg. SS of 2500 RPM
Producing
unknown part
Producing part XY32
at avg. SS of 2160 RPM
–
Not Producing Producing
Producing State – Device: When All Paths Producing
Path 1
Path 2
MULTI-PATH Device
Not Producing Producing
Producing State – Device: When Any Paths Producing](https://image.slidesharecdn.com/iotbizmeetuppresentation18-160414182454/75/Predictive-Analytics-and-the-Industrial-Internet-of-Manufacturing-Things-with-Will-Sobel-37-2048.jpg)
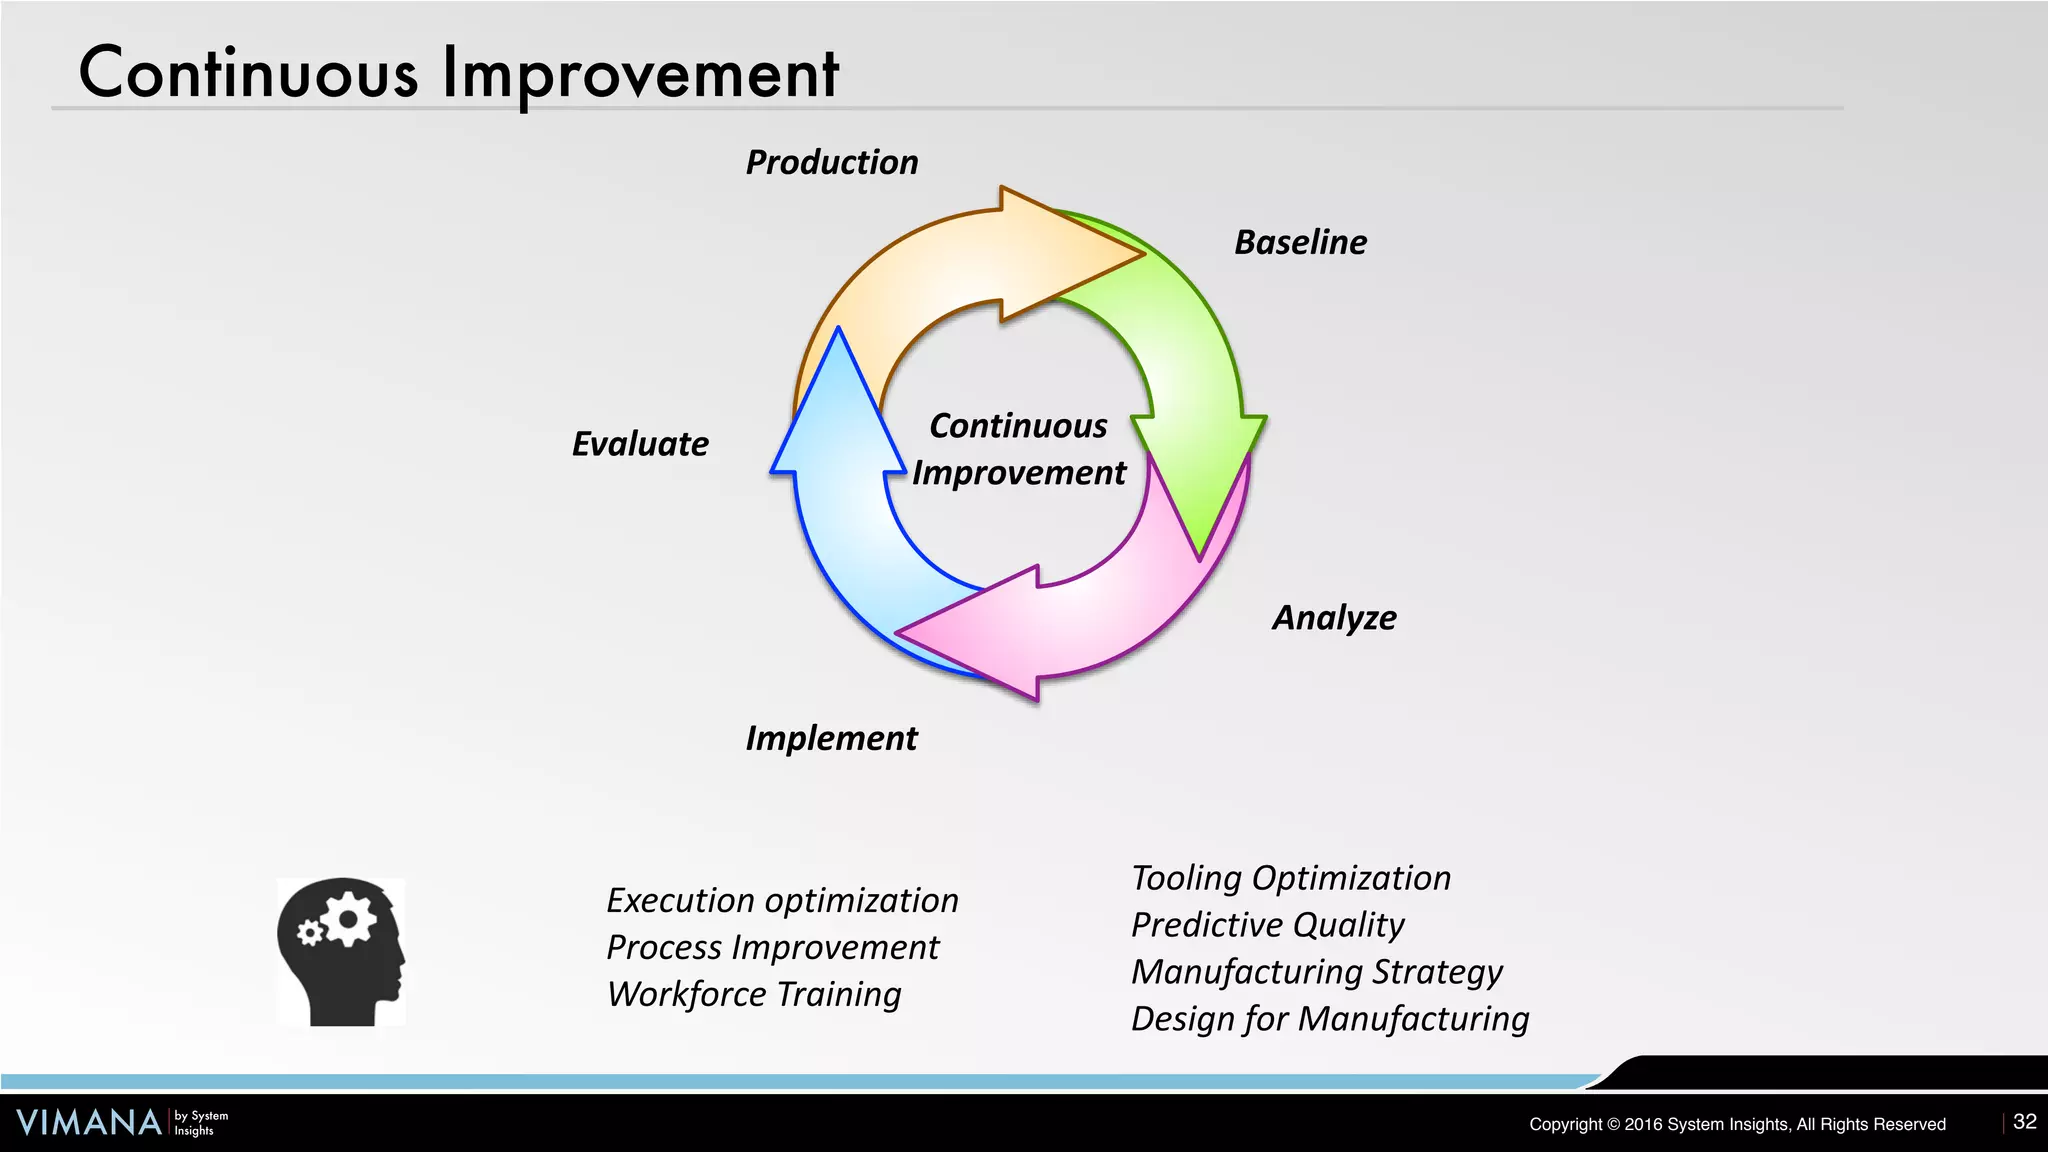

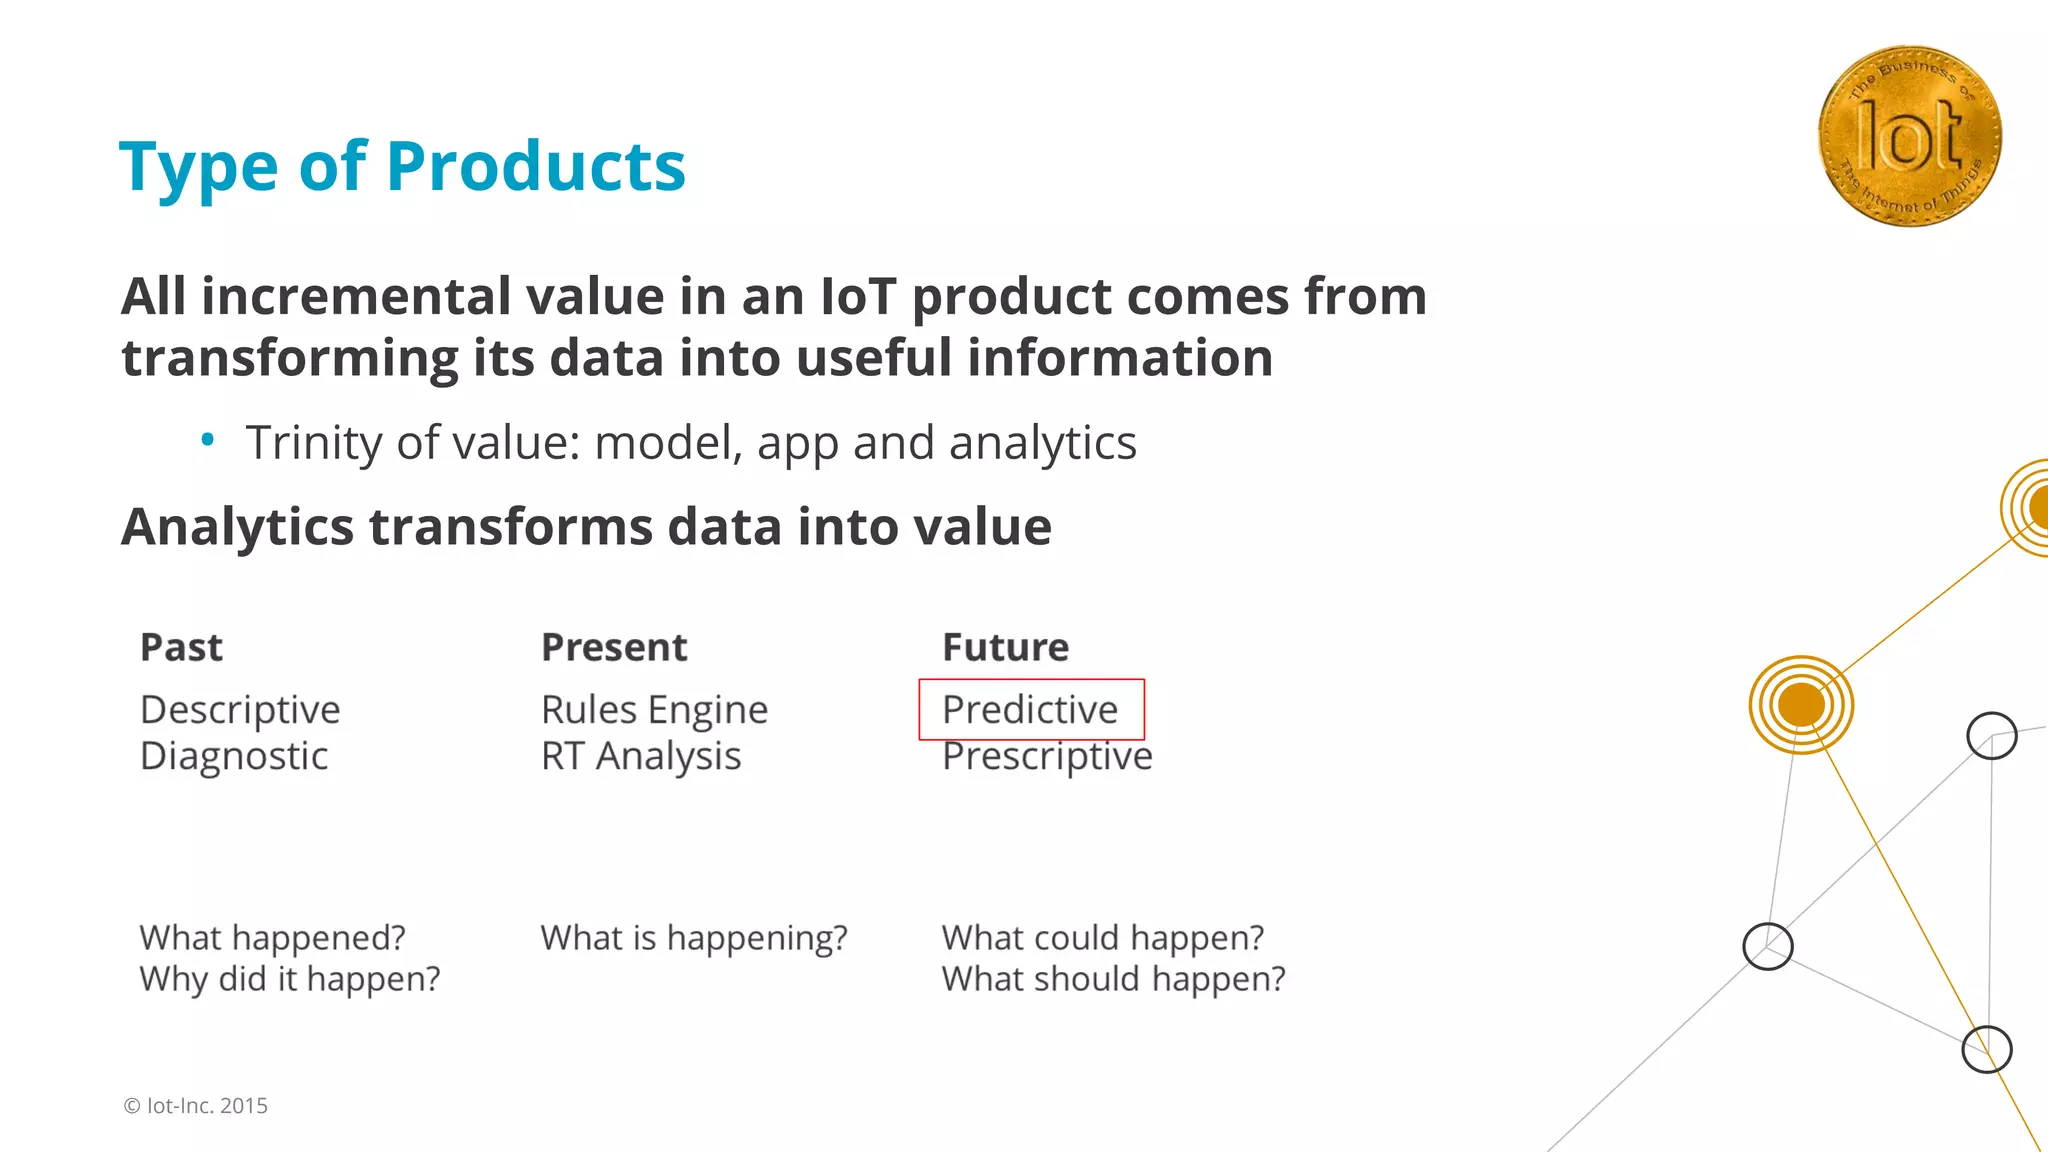
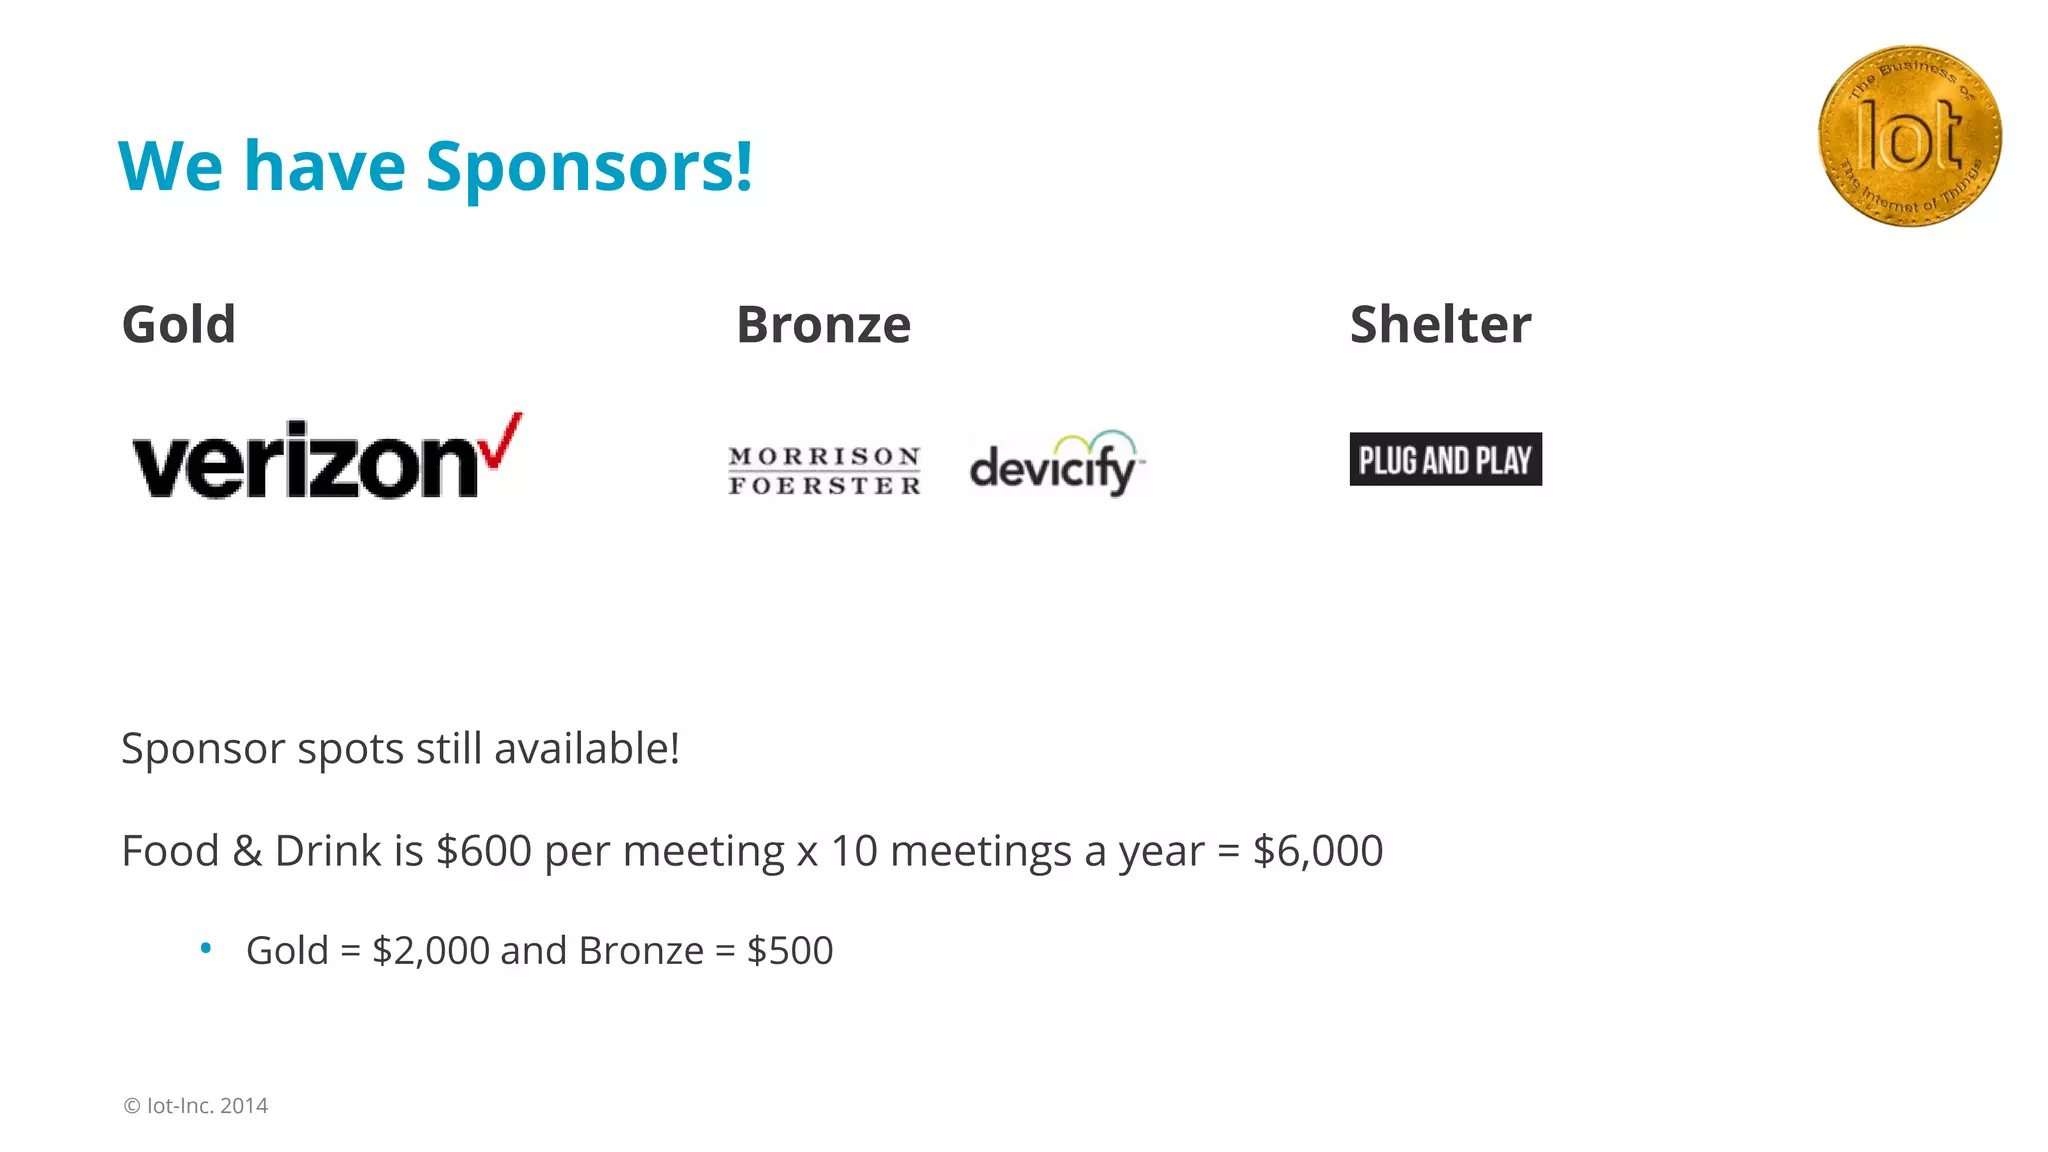
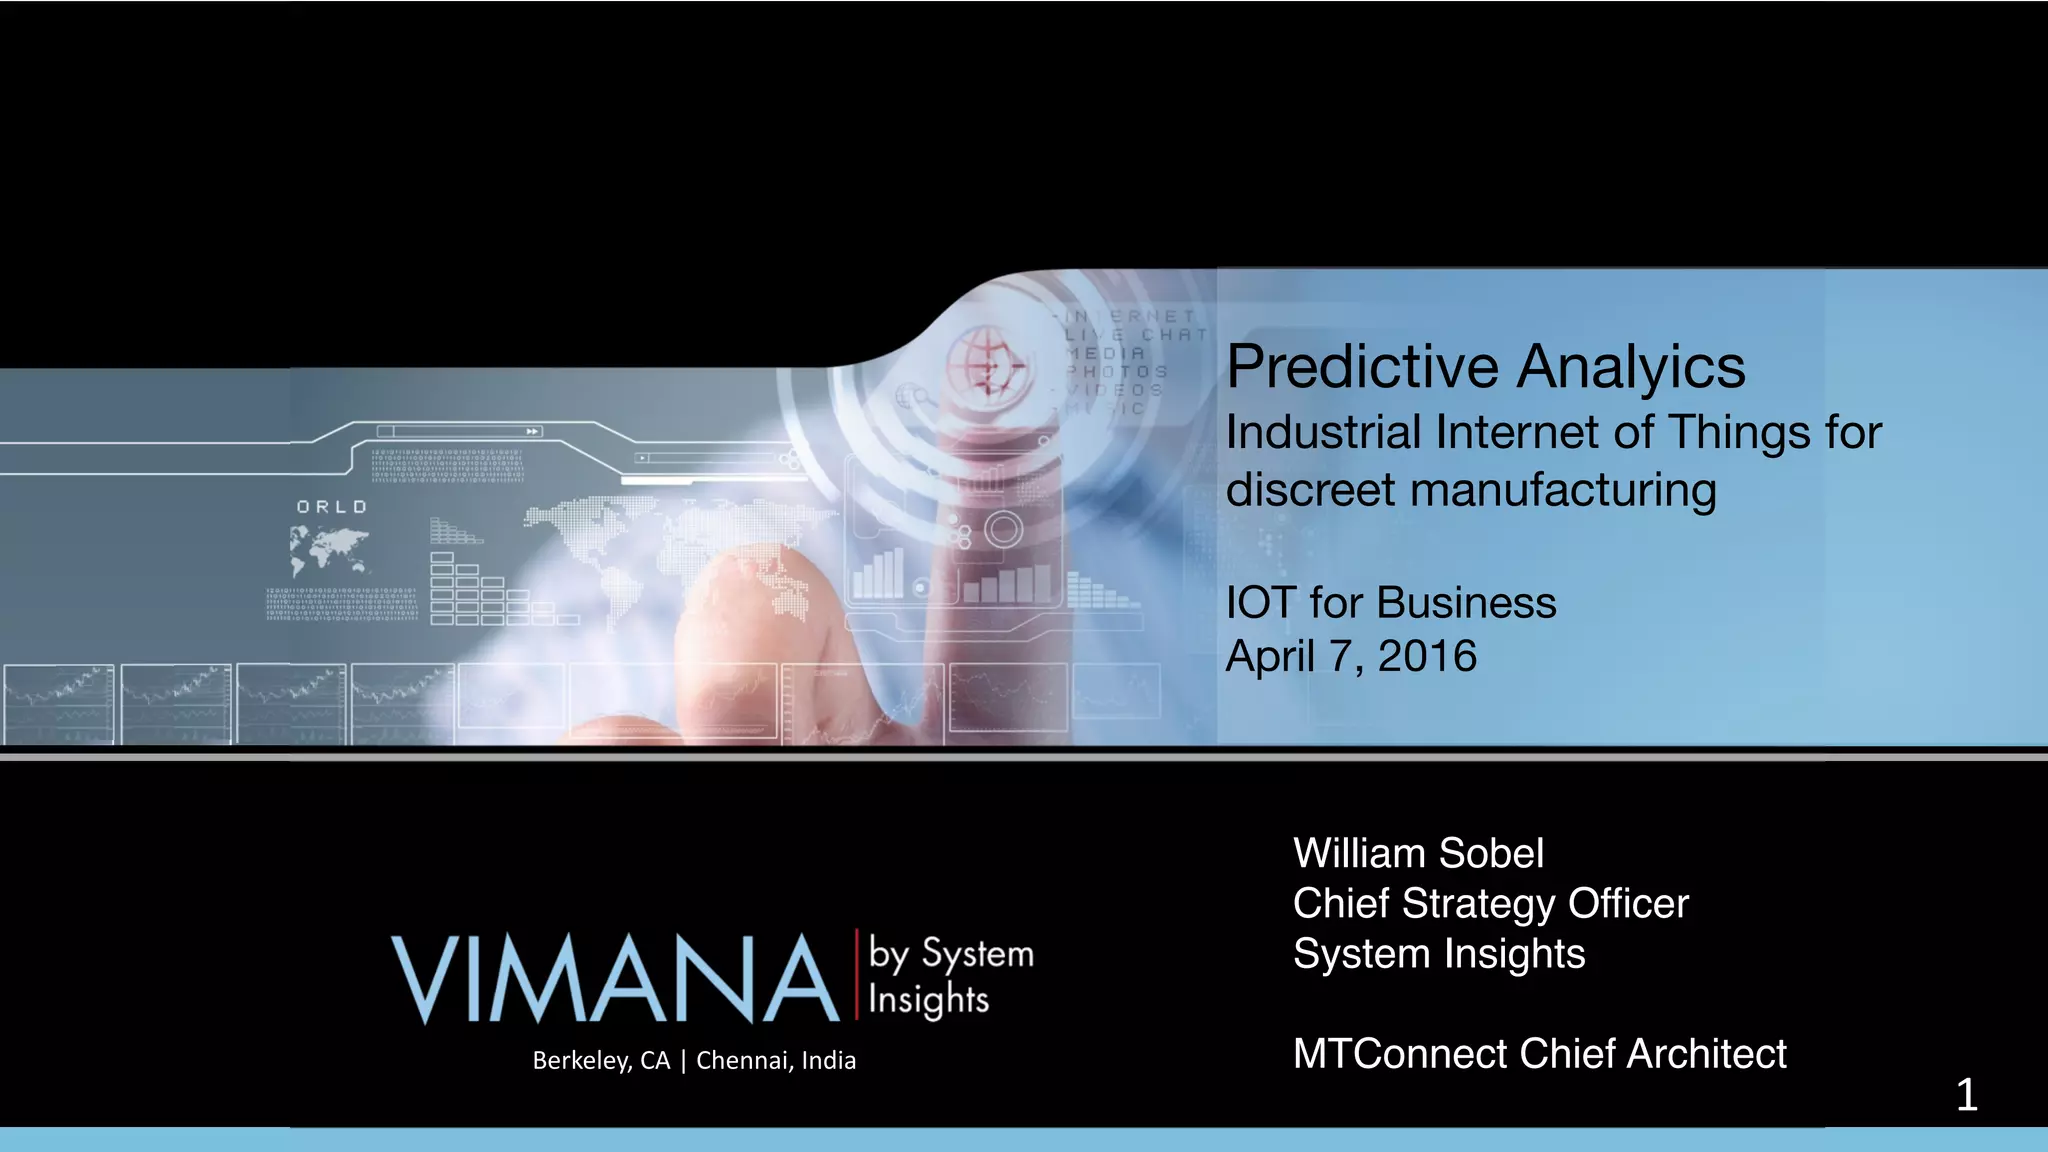
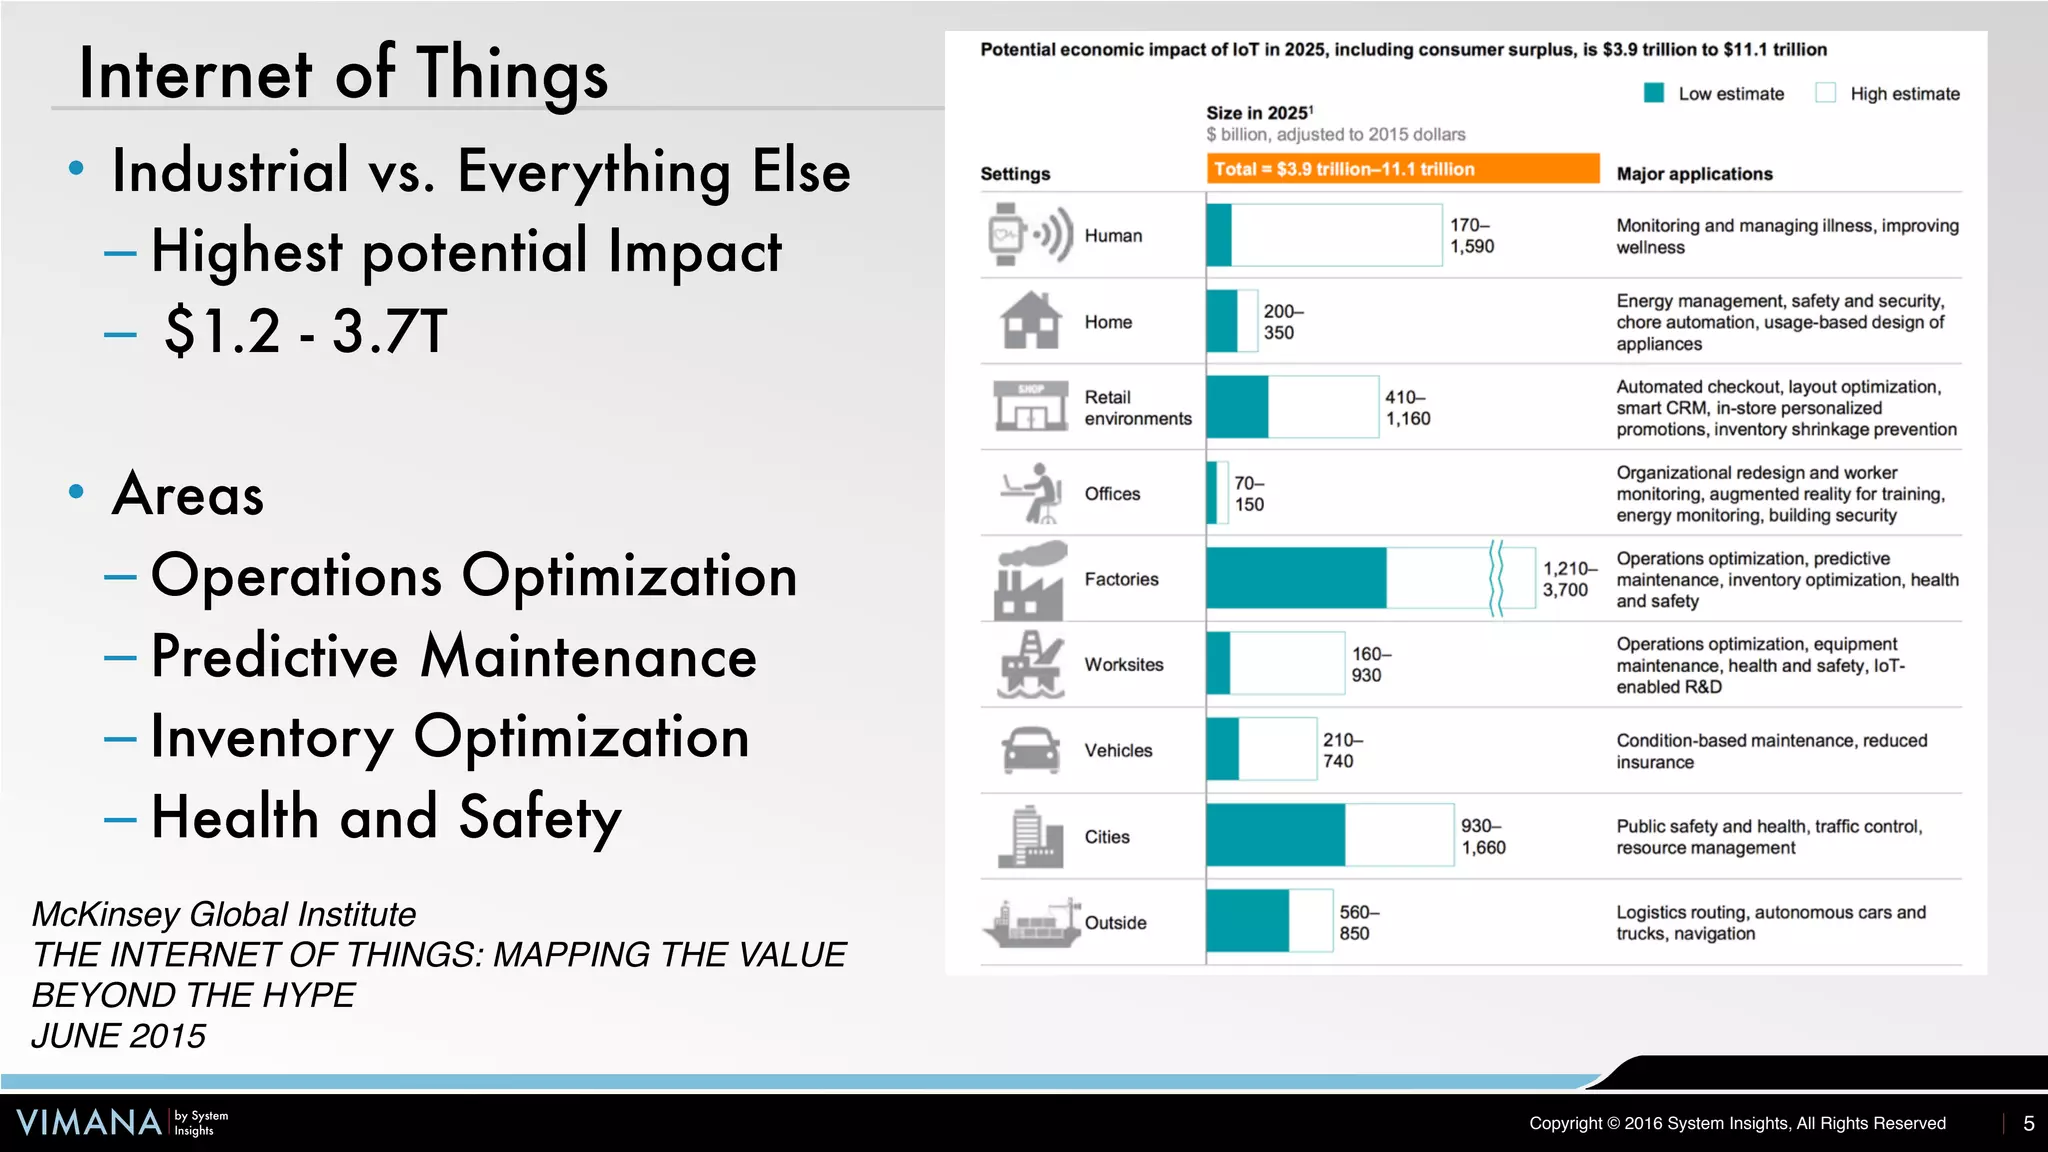
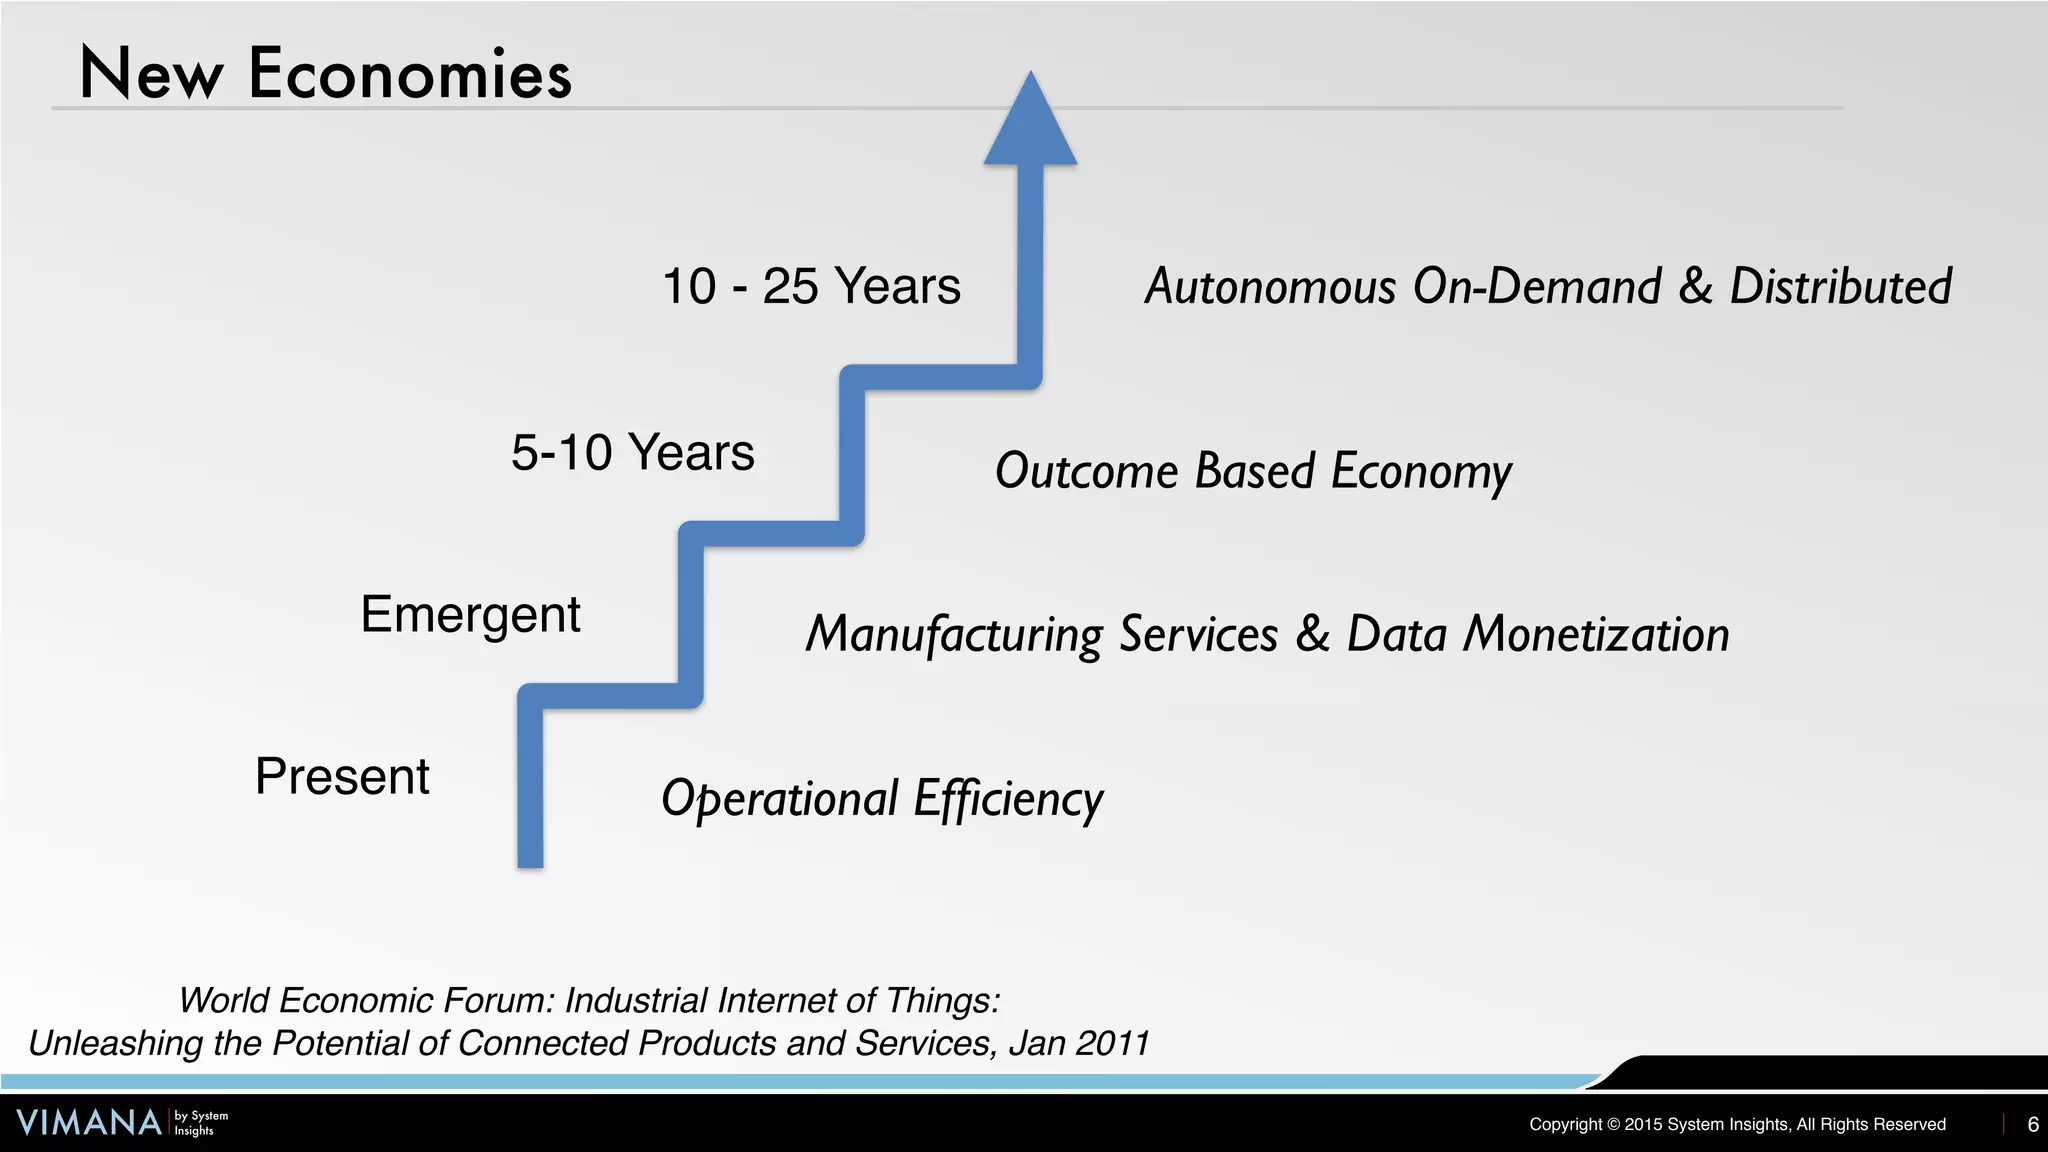
The IoT Inc Business Meetup in Silicon Valley focused on discussions around transforming data into valuable information for IoT products, highlighting the importance of analytics, modeling, and apps. Bruce Sinclair organized the meetup aiming to connect business professionals in the IoT sector, and future events are planned, including a mega meetup in July 2016. A presentation by William Sobel explored predictive analytics in manufacturing, emphasizing operational efficiencies and potential economic savings through enhanced data utilization.


