Download as PDF, PPTX


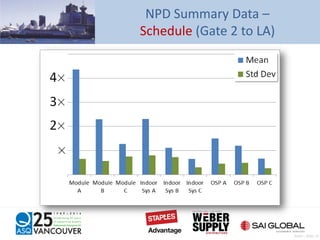
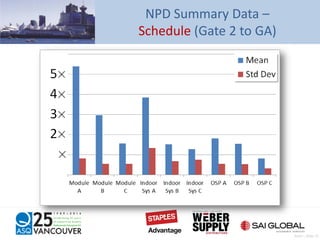
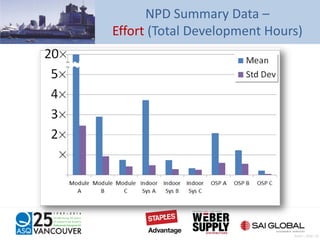
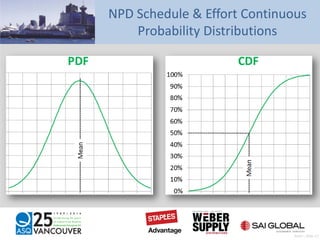


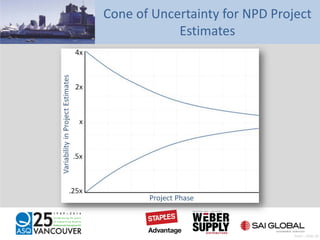
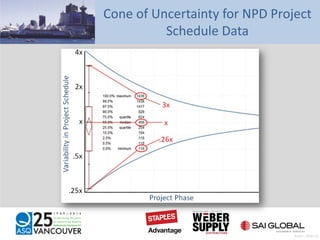
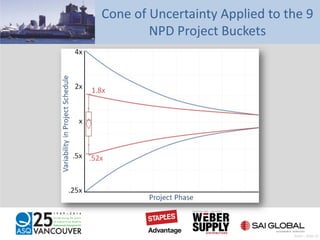

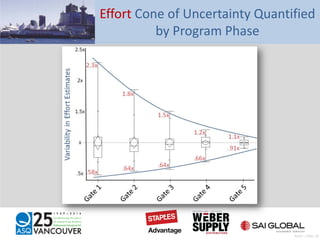


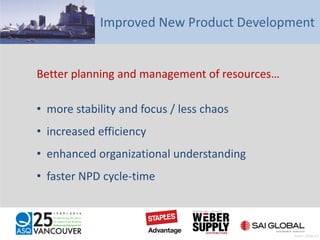


The document presents an analysis of the new product development (NPD) cycle-time at Alpha Technologies, focusing on performance benchmarks and methods for efficiency improvement. It details the phase-gate NPD process, data collected, and tools used, including statistical analysis to identify factors impacting schedule and effort. The findings emphasize the need for better estimation practices and resource management to enhance NPD cycle-time and overall project performance.


![Dyson [Markets & Strategy]](https://cdn.slidesharecdn.com/ss_thumbnails/ddce79f7-12d8-4e45-9198-2fe01d63a536-150730105922-lva1-app6891-thumbnail.jpg?width=640&height=640&fit=bounds)


