Download to read offline
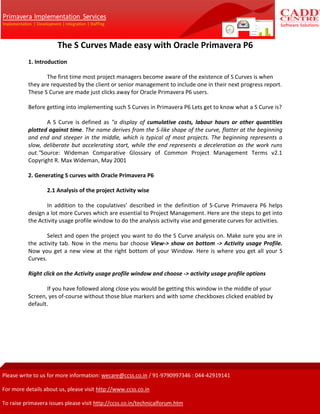
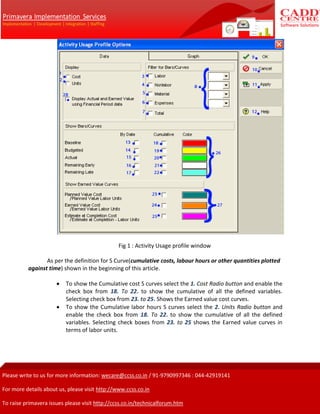
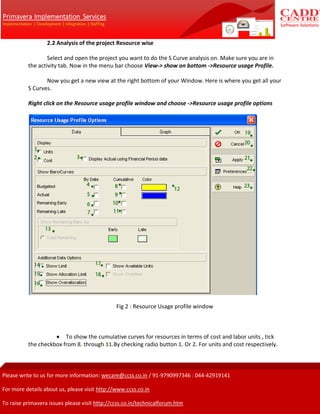
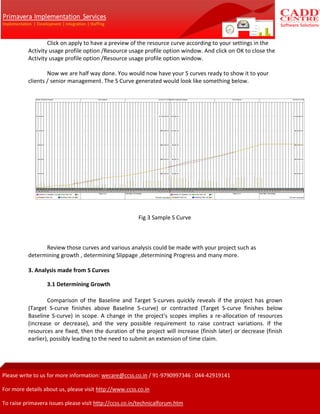
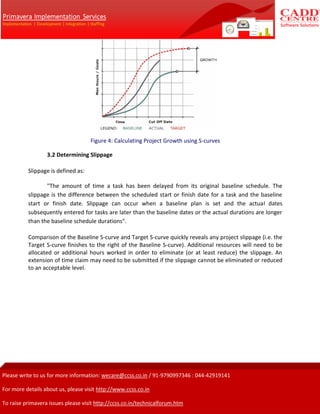
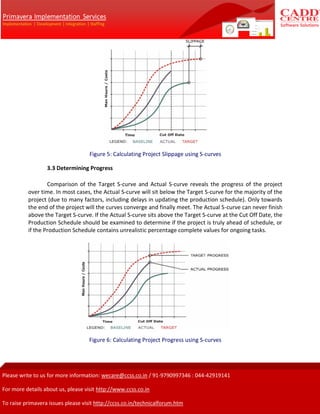
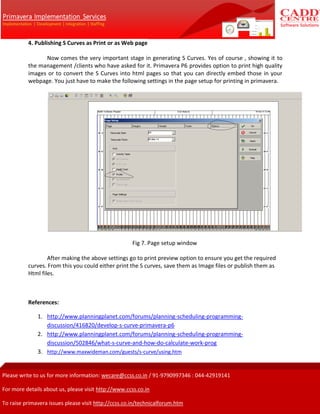

The document discusses how to generate S-curves in Oracle Primavera P6 to analyze project progress and performance. S-curves show cumulative costs, labor hours, or other metrics plotted against time and typically have an S-shape. In Primavera P6, S-curves can be generated by activity or resource in the usage profile windows. Various analysis can then be done by comparing baseline, target, and actual S-curves to determine project growth, slippage, and progress. The S-curves can also be published from Primavera P6 as prints or embedded in webpages.