Downloaded 17 times
![Add a Task
Now you’re ready to add a task. Just hit the Add Task button in the SmartPanel and type in a description for your
task. You can hit Add Task again or simply hit the down arrow key and type to add another task. Repeat this until
you’ve added all your main tasks to the chart. These are the big, over-arching tasks that need to get done.
However, these larger tasks often cannot be completed until several smaller tasks are done first.
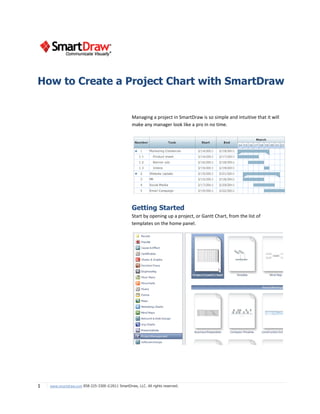
Switching to Mind Map View
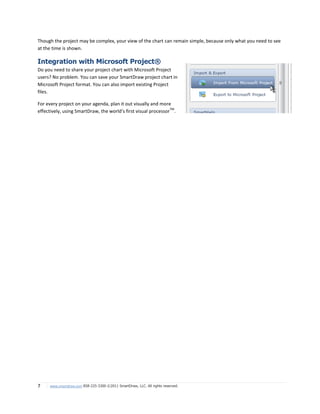
The best way to figure out each of these subtasks is to do so visually using a mind map. SmartDraw easily lets you
switch to a Mind Map view of your project if you select View As Mind Map from the SmartPanel.
Once in the mind map view, you’ll see each of your tasks represented as a box on a mind map. Select one of your
tasks and hit Add Subtopic in the SmartPanel or use [CTRL] and the right arrow key to do the same. If you have
one of the new subtopics selected, you can keep hitting [ENTER] to add more subtopics under the same task.
You can either use the SmartPanel buttons or simply the arrow keys to build out your entire project plan.
Use the arrow keys to navigate between tasks and use [CTRL] and the arrow keys to add more subtopics where you
want to.
3 www.smartdraw.com 858-225-3300 ©2011 SmartDraw, LLC. All rights reserved.](https://image.slidesharecdn.com/how-to-manage-projects-with-smartdraw-110622150307-phpapp02/85/How-to-Manage-Projects-with-SmartDraw-3-320.jpg)
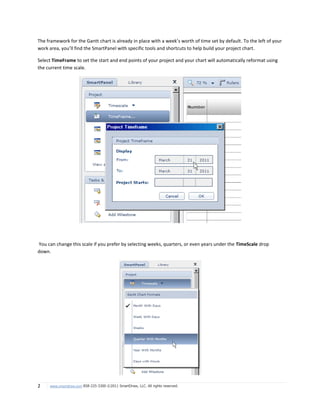
![Adjust Task Due Dates
To adjust how long a task will take, simply
type in a start or end date on your chart and
a bar representing the task will be
automatically added to the chart. You can
also adjust the duration of a task using the
bar itself, just grab an end with the mouse
and drag.
Add Dependencies
If you have a task that can’t begin until another is completed, you’ll want to add a dependency. To do this, hold
down CTRL and select the bar representing the task that you need completed and the bar representing the task
that depends on this completion and hit Add Dependency in the SmartPanel.
You can see that it automatically resets the starting point of the dependent task. Continue on with your estimates
and due dates, adding dependencies where necessary.
Insert a Task
You can insert a task between two existing task by selecting the top one and hitting the [CTRL] and down arrow key
or clicking the Add Task button. Your chart will automatically expand to make room for the new task.
View Your Project
Chart as a Timeline
You can view the chart as a timeline
for yet another perspective by
selecting View As Timeline from the
SmartPanel.
Define Working Days
and Holidays
Define your work week and non-working holidays by clicking on the Properties button on the SmartPanel.
5 www.smartdraw.com 858-225-3300 ©2011 SmartDraw, LLC. All rights reserved.](https://image.slidesharecdn.com/how-to-manage-projects-with-smartdraw-110622150307-phpapp02/85/How-to-Manage-Projects-with-SmartDraw-5-320.jpg)

This document provides a comprehensive guide on how to create and manage a project chart using SmartDraw. It covers steps such as adding tasks, visualizing tasks through mind maps, adjusting task durations, and adding dependencies between tasks. Additionally, it highlights features like timeline views, task grouping, and integration with Microsoft Project for effective project management.


![5G Explained! A High Level Overview [Introduction]](https://cdn.slidesharecdn.com/ss_thumbnails/5gexplainedahighleveloverview-260119165306-cc137a3e-thumbnail.jpg?width=640&height=640&fit=bounds)
