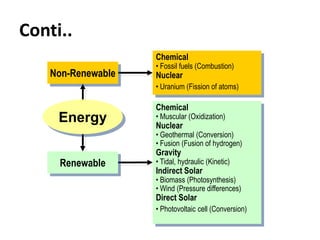
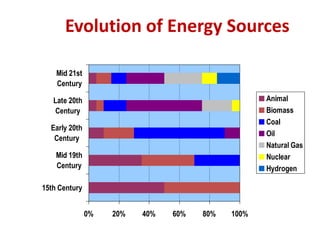
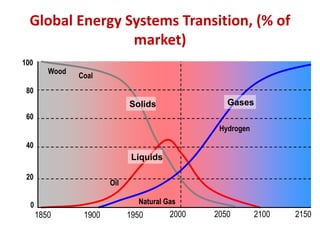
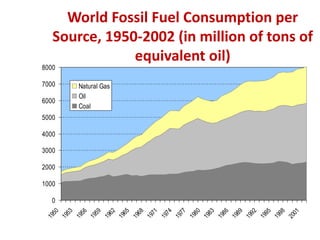
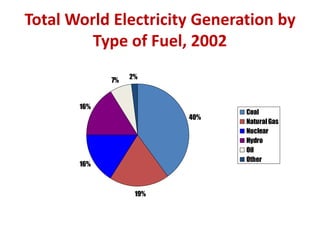
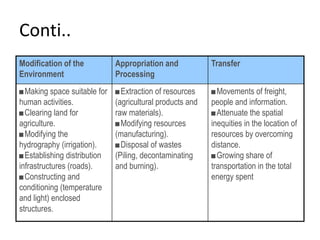
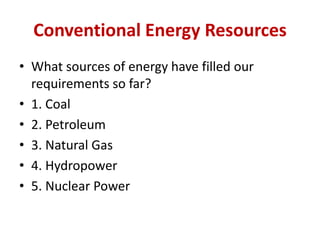
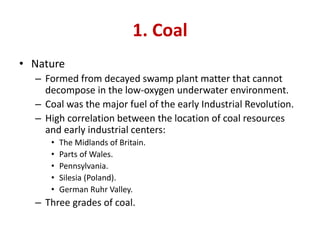
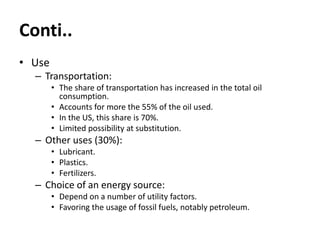
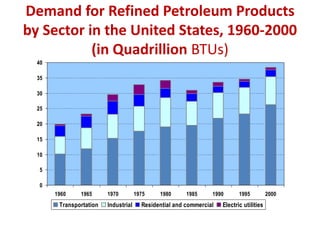
1. The lecture discusses conventional energy resources including coal, petroleum, natural gas, hydropower, and nuclear power. Coal was a major fuel during the industrial revolution and petroleum currently fuels over 55% of transportation.
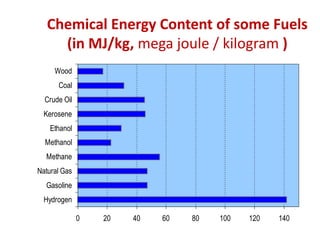
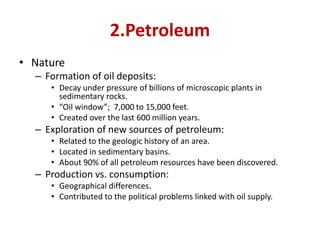
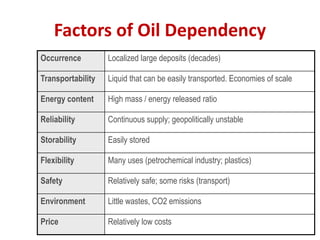
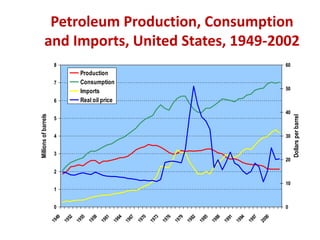
2. Petroleum formed from decayed plants and is found in sedimentary basins, with over 90% already discovered. It is highly energy dense and easily transported.
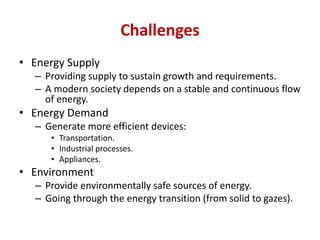
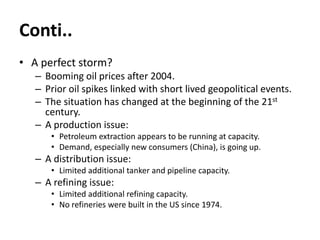
3. Major challenges include meeting growing energy demand sustainably while transitioning to cleaner sources as many conventional reserves are being depleted.