2. Ta b l e o f C o n t e n t s I n t r o d u cti o n
Introduction: Peel Back the Truth 1 The United States Potato Board (USPB) was established in 1971 by a group of
potato growers to promote the many benefits of eating potatoes. The USPB
Potato Nutrition Facts 2
Vitamin C, Potassium and Gluten-Free 2 was one of the first commodity groups to develop and use an FDA-approved
Vitamin B6, Fiber and Resistant Starch 4 nutrition label and has long since promoted positive nutrition messages. As a
Antioxidants 6
result of these efforts, consumer attitudes toward potatoes remained mostly
Glycemic Index 8
Satiety and Weight Management 11 positive for over 30 years. Then, the low-carbohydrate diet craze swept the
Type 2 Diabetes 14 nation beginning in the early 2000s and took a toll on the relationship between
Potatoes in the American Diet 15
America and its beloved potato, as indicated by a slight, yet noticeable,
Potatoes 101 17 decrease in potato consumption. This caused the potato industry to ramp up its
History of the Potato 18
consumer marketing efforts, focusing on dispelling the myth that potatoes are
How to Buy and Store Potatoes 19
Fresh Potato Types 20 fattening and educating the public about the inherent goodness of America’s
Favorite Vegetable.
Cooking With Potatoes 23
The Basics 24
How to Bake a Potato 25 In 2004, the USPB began a formal Nutrition This handbook is a compilation of all-things-
Perfect Mashed Potatoes and How to Bake Fries 26 Science Program which compiled key potato potato as it relates to nutrition research and more.
Potato Salad Possibilities and Grilling With Potatoes 27 research studies and began funding university Beginning with potato nutrition facts and ending
Restaurant Chefs Love Potatoes 28 research projects to protect the reputation of the with a monthly calendar of ideas for news features,
potato. The USPB positions itself at the forefront newsletters and blog posts, these pages are
of potato nutrition research and monitors research brimming with historical potato facts, techniques
Potato Story Ideas 31
and trends in the U.S. and overseas that could for cooking the potato in today’s “30-minute meal”
A Month-By-Month Calendar of Ideas to Put Potatoes in the News 32
impact potato consumption in America. mentality, and healthy recipes to keep the potato
naturally nutritious and delicious.
Healthy Potato Recipes 35 In 2007, the USPB adopted an industry-wide
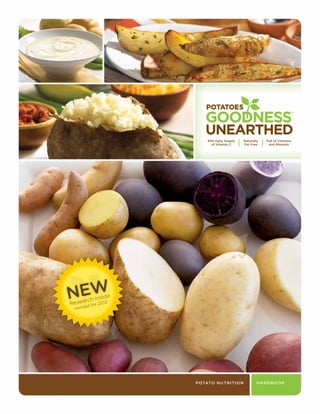
Recipes and Photos 36 signature, “Potatoes…Goodness Unearthed®,” to
promote the nutritional benefits of the potato. It’s
the first unified endeavor by the entire U.S. potato
Research Abstracts 43
industry to clearly identify the U.S. potato as a
Summary of USPB-Funded and Non-Funded Research 44
nutrition powerhouse.
References 55
USPB Contact Information 59 For more information, visit
www.potatogoodness.com.
1
3. P e e l B ac k t h e T r u t h :
P otato N u t r iti o n Fact s provide one of the most concentrated and potassium intake, the subjects on the LNAHK diet
affordable sources of potassium (Table 2). — and OD diets were given a list of potassium rich
significantly more than those foods commonly foods and instructed to eat a potato a day. The
It’s a surprise for many to discover Gluten-Free
associated with being high in potassium results indicated that both the LNAHK and OD
that one medium potato (5.3 oz) According to the 2011 USPB Attitudes & Usage
(e.g., bananas, oranges, mushrooms, etc.) produced decreases in blood pressure (compared
Study, only 19% of Americans rate potatoes as
with the skin contains 45 percent of (Drewnowski et al. 2011). Research suggests to the HC diet); however the decrease was
excellent for being gluten-free. In fact, potatoes
that diets rich in potassium and low in sodium greatest in the LNAHK diet. With the speculation
the daily value for vitamin C; as much are 100% gluten-free! According to the National
reduce the risk of hypertension and stroke that the blood pressure lowering effects of the
or more potassium (620 mg) than Foundation for Celiac Awareness, an estimated
(Appel et al. 1997, FDA, Food & Nutrition Board LNAHK and OD diets were due to an increase in
either bananas, spinach, or broccoli; 3 million Americans suffer from side effects
2004). Accumulating evidence also suggests dietary potassium as a direct result of including a
associated with eating foods that contain gluten.
10 percent of the daily value of B6; that increasing dietary potassium can negate daily potato dish, Nowson and colleagues recently
To make it easier for those who suffer from this
and trace amounts of thiamin, some of the negative effects of dietary sodium re-examined the data. The results confirmed that
disease to find delicious, gluten-free recipes, the
on blood pressure (Geleijnse et al. 2003), there was an inverse relationship between potato
riboflavin, folate, magnesium, USPB has created a gluten-free recipe collection
and reducing sodium along with increasing consumption and blood pressure. Specifically, it
phosphorous, iron, and zinc — all for on their website www.potatogoodness.com, which
potassium provides greater heart disease was demonstrated that a 100-g/d higher intake of
includes more than 80 gluten-free recipes from
only 110 calories and no fat (Table 1). protection than intervention alone (Cook et al. potatoes (an average potato is approx. 150 grams)
several ethnic cuisines, many of which can be
2009, Nowson et al. 2004). was associated with a 2.6 mm Hg lower diastolic
prepared in 30 minutes or less.
Table 1: FDA Data for a 5.3 oz Potato with the Skin* blood pressure (Nowson et al. 2008).
Table 2: Potassium Content of Selected “High”
Potassium Foods*
Calories (kcal) 110 % Daily Value Vitamin C
Fat (g) 0 – Potatoes provide 27 mg of vitamin C (45 percent
Food Source Potassium (mg) Potatoes Lead Potassium
Cholesterol (mg) 0 – of the current daily value), which can contribute
Potato (1, 5.3 oz) 620
.................. Produce Picks ..................
Sodium (mg) 0 – to total daily requirements. This water-soluble
Broccoli (1 med stalk) 460 The recommended intake for potassium was
Potassium (mg) 620 18% vitamin acts as an antioxidant, stabilizing or recently increased to 4,700 mg from 3,500
Banana (1 med) 450 per day. Potatoes rank highest among the
Vitamin C (mg) 27 45% eliminating free radicals, thus helping to prevent 20 top-selling fruits and vegetables
Sweet Potato (1 med) 440
Vitamin B6 (mg) 0.2 10% cellular damage. Vitamin C also aids in collagen Potassium content per serving
Tomato (1 med) 340
Fiber (g) 2 8% production, a process that helps to maintain
Mushrooms (5 med) 300
healthy gums and is important in healing wounds.
Orange (1 med) 250
*It should be noted that the FDA label represents a composite of varietals Finally, vitamin C assists with the absorption of
Cantaloupe (1/4 med) 240 Potatoes
(“market-basket approach”) based on typical U.S. consumption patterns iron and may help support the body’s immune 620 mg
(i.e., 70 percent russet, 18 percent white, and 12 percent red). Grapefruit (1/2 med) 160
system (Gropper 2008). Although potatoes do Broccoli
460 mg
Bananas
not rival the vitamin C content of citrus fruits and *www.fda.gov/food/labelingnutrition
450 mg
Based on the FDA label (Table 1), the following
peppers, they do contribute significantly to daily
claims can be made for the potato: Tomatoes
vitamin C requirements. In fact, data from the Given their high potassium content, potatoes may 340 mg
• An excellent source (> 20 percent of the DV) most recent Continuing Survey of Food Intakes by contribute to a heart healthy diet. Nowson et al.
of vitamin C Individuals (1994-1996) indicates that potatoes (2004) examined the effect on blood pressure of Source: United States Potato Board
• A good source (> 10 percent of the DV) rank in the top 5 of dietary sources of vitamin C two different self-selected diets: (1) a low-sodium,
of potassium The health benefits of potassium go beyond
for Americans (Cotton et al. 2004). high-potassium diet rich in fruit and vegetables
• A good source (> 10 percent of the DV) cardiovascular health. Research indicates that
(LNAHK) and (2) a high-calcium diet rich in low-
of vitamin B6 diets high in potassium-rich fruits and vegetables
Potassium fat dairy foods (HC) with a (3) moderate-sodium,
• Low (< 140 mg/serving) in sodium may help maintain lean body mass and bone
It is estimated that less than 3% of Americans high-potassium, high-calcium DASH-type diet
and cholesterol mineral density as we age (Dawson-Hughes et al.
are meeting the current adequate intake (AI) high in fruits, vegetables and low-fat dairy foods
• Fat-free (< 0.5 g fat/serving) 2008, Tucker et al. 1999).
for potassium (4700 mg/d) (USDA). Potatoes (OD) for four weeks. In order to achieve a higher
2 3
4. Vitamin B6 Resistant Starch reductions in blood lipid levels, increases in Table 3: Resistant Starch Content of Various Foods*
Potatoes are a good source of vitamin B6, a water Resistant starch is the starch that is ‘resistant’ satiety and potential uses in weight management
Food RS (g/100g food)
soluble vitamin that is often low in the diets of to enzymatic digestion in the small intestine. (Higgins 2004, Bodinham et al. 2010).
certain groups of women (DRIs 1997). Vitamin B6 Resistant starch is found naturally in foods such as Puffed Wheat 6.2
plays important roles in carbohydrate and protein legumes, bananas (especially under-ripe, slightly In fact, the potential health benefits are so White Beans (cooked) 4.2
metabolism. It helps the body make nonessential green bananas), potatoes, and some unprocessed promising that the Joint Food and Agricultural
Banana (raw) 4.0
amino acids needed to make various body whole grains. Natural resistant starch is insoluble, Organization of the United Nations/World Health
proteins. It is also a cofactor for several enzymes fermented in the large intestine and a prebiotic Organization Expert Consultation on Human Potato Chips 3.5
involved in energy metabolism, and it is required fiber (i.e., it may stimulate the growth of beneficial Nutrition concluded that resistant starch is “…one
Lentils (cooked) 3.4
for the synthesis of hemoglobin – an essential bacteria in the colon). Other types of resistant of the major developments in our understanding
component of red blood cells (DRIs 1997). starch may be soluble or insoluble, and may or of the importance of carbohydrates for health in Corn Flakes 3.2
may not have prebiotic properties (Higgins 2004). the past twenty years.” (FAO 1998) Potato (cooked & cooled) 3.2
Fiber
The amount of resistant starch found in potatoes is Rye Bread 3.2
One medium potato with the skin contributes The physiological effects and potential health
highly dependent upon processing and preparation
two grams of fiber or eight percent of the daily benefits of resistant starch have been studied in Potato (fried) 2.8
methods. For example, cooking and then cooling
value. Dietary fiber is a complex carbohydrate animals and humans for over 30 years (Murphy
potatoes leads to nearly a two-fold increase in Chickpeas (cooked) 2.6
and is the part of the plant material that cannot et al. 2008). Resistant starch appears to exert
resistant starch—Table 3 (Englyst et al. 1992, Peas 1.9
be digested and absorbed in the bloodstream. beneficial effects within the colon as well as
Murphy et al. 2008). Even processed potatoes (e.g.,
Dietary fiber has been shown to have numerous body wide. Health benefits in the colon include Potato (boiled) 1.3
potato flakes) appear to retain a significant amount
health benefits, including improving blood lipid enhanced laxation, extensive fermentation and
of resistant starch with the potential to confer Wheat Bread 1.2
levels, regulating blood glucose, and increasing the production of important short chain fatty
health benefits.
satiety, which may help with weight loss (Food acids and increased synthesis of a variety of Potato (baked) 1.0
and Nutrition Board 2002). “good” bacteria (Murphy et al. 2008, Cummings
et al. 1996, Nofrarias et al. 2007) both of which * Adapted from Murphy 2008
are believed to protect the colon from harmful
microorganisms and even cancer (Hylla et al.
1998). Systemic effects include improvements
in glucose tolerance and insulin sensitivity,
4 5
5. CAROTENOIDS ANTHOCYANINS
Antioxidants A number of scientists have developed specific Comprise a large group of compounds produced by plants Are a class of plant pigments that can be classified
chemically as both flavonoids and phenolics
In addition to vitamins and minerals, potatoes also research programs to examine the antioxidant
contain an assortment of phytochemicals with content of different varieties of potatoes with
antioxidant potential, most notably carotenoids the ultimate goal of developing new potato Imparts yellow-to-red hues to various plants, including Widely distributed among flowers, fruits, and vegetables
fruits, tubers and roots and contribute to every color but green (Hou 2003)
and anthocyanins (Brown et al. 2001, 2004). varieties that maximize antioxidant potential.
Anthocyanins are found in the greatest quantities Dr. Cecil Stushnoff and his team at Colorado
in purple and red potatoes while carotenoids are State University have examined nearly 100 Play a function in plants as accessory pigments, Play several major roles in plants, including attracting
photosynthesis and protect against photosensitization in insects for pollination, acting as a UV screen to protect
found largely in yellow and red potatoes, although different selections and varieties of potatoes for plants and animals. In humans, carotenoids are thought the plant’s DNA from damage by sunlight, and acting as
to have a variety of function including antioxidant activity, feeding deterrents
small amounts are also found in white potatoes antioxidant content and free radical scavenging immunoenhancement and perhaps protection against some
capacity and have found that pigmented potatoes forms of cancer (DRIs 2000)
(Brown et al. 2004).
contain a variety of substances with antioxidant
Wu and colleagues (2004a) examined total potential (Stushnoff et al. 2007). Potato cultivars
antioxidant capacity (TAC) in more than 100 with particularly high phenolic contents include:
different foods, including fruits, vegetables, nuts,
•Purple Majesty
The effects of pigmented potato consumption on Does cooking potatoes impact
dried fruits, spices, cereals, and other foods. biomarkers of oxidative stress, inflammation and
In addition, the researchers measured total
(recently released purple-skinned variety) antioxidant content?
immune response were recently studied in a sample
•Mountain Rose
phenolic content of these foods to evaluate their of healthy adult males who received daily doses What is the impact of cooking and other forms
(not yet released red-skinned variety)
contribution to total antioxidant capacity. Out (150 grams) of either white, yellow or purple-fleshed of processing on the phenolic content and
•Rio Grande
of the 42 vegetables that were tested, beans (not widely available russet variety) potatoes daily (Kaspar 2011). The results indicated antioxidant activity of potato varieties? There
(including small red, kidney, and pinto) and that consuming pigmented potatoes can reduce is no clear-cut answer as the current data are
artichokes ranked highest in total antioxidant Researchers are also focusing on breeding species inflammation and DNA damage as well as modulate conflicting. Results from Dr. Brown’s lab indicate
capacity, while russet potatoes ranked fifth, of potatoes that have improved antioxidant immune cell phenotype in healthy adult males. that boiling increases the extractable total
coming in ahead of vegetables that are more capacity and have successfully developed potato carotenoids and the accompanying antioxidant
commonly known for their antioxidant potential, tubers with increased levels of flavonoids and Dr. Roy Navarre and researchers from Washington
values (Brown 2007). On the other hand, data
such as broccoli, cabbage, and tomatoes. carotinoids (Lukaszewicz et al. 2004, Brown State University recently began using a technique
from Dr. Miller’s lab indicates that boiling is the
2004, Navarre 2007). known as “metabolic profiling.” They examine
only cooking method that severely negatively
genetic variations in potatoes and then use
Potato Nutrition: The potential role of potato antioxidants in this information to maximize their nutritional
More than skin deep immune function and disease prevention have potential. In his lab, metabolic profiling is
A common misconception is also been studied. For example, Reddivari et being used to screen potatoes for genotypes
that all of the potato’s nutrients
al. (2007) examined the effects of a purple with elevated amounts of vitamins and
are found in the skin. While the
potato anthocyanin fraction on prostate phytonutrients. Substantial differences in
skin does contain approximately
cancer cell proliferation and apoptosis phytonutrients among different genotypes
half of the total dietary fiber, the
majority (> 50 percent) of the
(i.e., cancer cell death) in vitro. The results were observed for some phenolic compounds,
nutrients are found within the potato indicated that cancer cell proliferation was including flavonol, differing in concentration
itself. As is true for most vegetables, decreased by the anthocyanin fraction, and by well more than tenfold. More modest
cooking does impact the bioavailability apoptosis was increased. Current studies are differences were found in folate, with about
of certain nutrients, particularly water-soluble focusing on identifying the individual components a threefold difference between high and low
vitamins and minerals, and nutrient loss is greatest
of the anthocyanin fraction responsible for the folate genotypes. Comparisons have also been
when cooking involves water (boiling) and/or
induction of apoptosis in prostate cancer cells and made between wild species and cultivars,
extended periods of time (baking). To maintain the
on developing potato cultivars that over-express and marked differences were found in a
most nutrition in a cooked potato, steaming and
these bioactive compounds. variety of compounds, including glycoalkaloid
microwaving are best.
composition (Navarre et al. 2007).
6 7
6. impacts antioxidant content. Microwaving and determination of GI, which severely limits the simple affect its GI. Decreasing the pH of a starch (e.g.,
baking appear to cause minimal destruction/ classification of a given food as high, medium or by adding acid) can lower the GI; thus, adding
reduction in antioxidant content. Dr. Miller low on the GI, as well as the application of the GI for vinegar to potatoes (such as when making
hypothesizes that the boiling causes a loss of the purpose of food selection (Franz 2006). First potato salad) will lower the GI of the potatoes.
the water-soluble antioxidants in the water. Wu and foremost, it must be emphasized that the GI is Similarly, acetylation or the addition of beta-
and colleagues (2004b) found that cooking had not an inherent property of a food but, rather, the cyclodestrin has been shown to decrease the GI
a variable effect on the hydrophilic antioxidant metabolic response of an individual to a food (Pi- of potato starch (Raben et al. 1997).
capacity of the four different vegetables tested Sunyer 2002). Thus, the GI of a carbohydrate-rich
Preparation: Cooking has been shown to exert
(russet potato, broccoli, carrots and tomato). food can vary greatly depending on a number of
a differential effect on GI of a carbohydrate-
Specifically, potatoes and tomatoes had significant factors, including:
rich food, particularly one that is high in starch.
increases in antioxidant content after cooking,
Variety: Different varieties of a given For example, a recent study by Fernandes et al.
while carrots had a significant decrease, and
carbohydrate-rich food (e.g., short-grain vs. (2005) examined the effect of cooking on the
broccoli was unchanged.
long-grain rice, linguini pasta vs. rotini pasta, GI of potatoes prepared in a variety of different
red potatoes vs. russet potatoes) can produce ways including mashed; baked; reheated; boiled;
Glycemic Index
significantly different GIs. According to the most boiled and cooled; and fried. The results indicated
If low carbohydrate was the diet trend at the start Between-Subject Variability: Research clearly
recently published international table of GI values that the GI values of potatoes varied significantly
of the decade, then low glycemic index (GI) has shows that individuals can vary significantly
(Atkinson et al. 2008), the GIs for potato varieties depending on both the variety and cooking
certainly been the trend to round it out. The GI is in their glycemic responses to the same food
range from a low of 56 for a boiled Pontiac potato method used, ranging from intermediate (boiled
defined as “the incremental area under the blood (Wolever 2003). Nonetheless, in laboratory
from Australia to a high of 111 for a baked U.S. red potatoes consumed cold: 56) to moderately
glucose response curve of 50 grams available studies, this source of variation is reduced to the
Russet Burbank. high (roasted white potatoes: 73; baked russet
carbohydrate portion of a test food relative to 50 point where it is no longer statistically significant
potatoes: 72). Similarly, Kinnear et al. (2011)
grams of a reference food (e.g., glucose or white by expressing an individual’s glycemic response to
Origin: Ironically, even for presumably the same
investigated the effects of cooking and cooling
bread)” (Jenkins et al. 1981). Potatoes have been the food of interest relative to that of a reference
variety, the GI value can vary widely depending
on the GI of four novel potato varieties and found
unfairly criticized for their ranking on the GI. In fact, food (e.g. white bread or glucose). For example,
on where it was grown. For example, russet
significant variability in the effects. Specifically,
there are a number of complexities in the measure Wolever and colleagues (1991) examined the
potatoes grown in Australia have a GI ranging
cooking and cooling reduced the GI of two potato
and methodological weaknesses inherent in the glycemic responses (AUC) and GI (i.e., the AUC
from 87-101, placing them in the high category,
varieties by 40-50%, while it produced only a
whereas russets grown in the U.S. and Canada of the test food expressed relative to white
8-10% reduction in the other two varieties.
have GIs ranging from 56-77, placing them in the bread) of three different foods (white bread, rice,
more moderate category (Foster-Powell et al. and spaghetti) in 12 subjects with diabetes. The
2009; Fernandes 2005). average coefficient of variation (a representation
of the variability in responses between subjects)
Processing: Grinding, rolling, pressing, mashing, for the AUC (for the same food) was 45 percent,
and even thoroughly chewing a starch-rich whereas for the GI it was only 10 percent. While
carbohydrate will disrupt the amylase and/ mathematically correcting for differences in
or amylopectin molecules, making them more glycemic responses makes for a nice, consistent
available for hydrolysis and thereby increasing GI, it is artificial and masks a very important
the GI (Collier & O’Dea 1982, Pi-Sunyer 2002, and practical consideration — individuals differ
Wolever et al. 2001). For example, Wolever significantly in their blood glucose responses to
and colleagues showed that the GI of a one- the same food.
inch cube of potato could increase by almost 25
percent simply by mashing the cube. Chemically
modifying a carbohydrate-rich food can also
8 9
7. Within-Subject Variability: Not only Satiety and Weight Management
do blood glucose responses to similar
Given the ever increasing prevalence of obesity in the U.S.
foods differ between individuals,
(68 percent of Americans are overweight or obese) (Flegal
they can vary significantly in the
same person on different occasions. 2010), it is not surprising that weight management is top
In fact, the within-subject variation of mind among consumers and health professionals
can sometimes be greater than the
alike. One of the most highly researched factors believed
between-subject variation. Wolever
et al. (1985) showed that for repeated
to impact weight management is satiety. Satiety is
tests of 50 grams of carbohydrate generally defined as the physiological and psychological
from glucose or bread, the coefficient experience of “fullness” that comes after eating and/
of variation of AUC was approximately
or drinking. A number of factors have been shown to
15 percent in subjects with Type 2
Diabetes, 23-25 percent in nondiabetic influence the experience of satiety, including gastric
subjects, and 30 percent in subjects distention, elevations in blood glucose, and alterations
with Type 1 Diabetes. Similarly, Vega- in circulating hormones (e.g., increased insulin and
Lopez et al. (2006) examined the
cholecystokinin and decreased glucagon). The GI of a
inter-individual variability and intra-
individual reproducibility of GI values food has also been hypothesized to influence satiety,
for commercial white bread among 23 healthy Time of Day: The time of day during which despite a paucity of valid research to support the
adults (aged 20-70 years) and found that the glycemic response is measured may impact not
connection. Due to potatoes’ supposed high GI, they
inter-individual coefficient of variation (CV) was only the absolute glycemic response (i.e., the
AUC) but also the relative glycemic response (i.e., have been accused of not being satiating and, thus, have
17.8 percent, while the intra-individual CV was
42.8 percent. In a study recently published in the GI) (Gannon et al. 1998; Wolever 1996). For been pegged as fattening. However, available research does
the British Journal of Nutrition, Williams (2008) example, Wolever and Bolognesi (1996) compared not support this contention.
examined the reliability of the GI among four the glycemic responses to two different breakfast
different foods (white bread, glucose, chickpeas cereals under two conditions: after a 12-hour
A frequently cited study by Holt and colleagues white bread and multiplying by 100. The results
and mashed potatoes) using the intra-class fast and at midday, four hours after consuming
(1995) examined the satiating effects of 38 indicated that there were significant differences
coefficient (ICC), a measure having values a standard breakfast. The AUCs at midday were
commonly eaten foods grouped into six different in satiety scores not only between but also within
between zero and one, with values closer to one significantly less than those after the 12-hour fast,
categories (fruits, bakery products, cereals, snack food groups. The food that scored highest on the
indicating a better reliability and values closer despite the fact that the subjects consumed the
foods, protein-rich foods, and carbohydrate-rich satiety index was, in fact, boiled potatoes, with a
to zero indicating poor reliability. The ICC for exact same foods. More specifically, the mean
foods). Subjects consumed 240 kcal (1,000 kj) score seven times greater than croissants, which
white bread, glucose, and chickpeas were 0.50, AUC response to the high-fiber cereal was 50
portions of each food item, and their feelings of had the lowest SI score. The authors also found no
0.49, and 0.28, respectively, while the ICC for percent lower than that of the low-fiber cereal
hunger/satiety were assessed every 15 minutes for significant relationships between satiety, plasma
mashed potatoes was significantly lower at after the 12-hour fast, while this difference shrank
a total of 120 minutes using an equilateral seven- glucose, or glycemic responses among the 38
0.02, indicating a very poor repeatability. It to just 10 percent at midday.
point rating scale that ranged from “extremely test foods. However, a negative correlation was
bears noting that these studies were all done in
For the GI to be considered a useful dietary planning hungry” to “extremely full.” The subjects were then found between insulin responses and ad libitum
a laboratory under highly controlled conditions
tool, it must have a predictable effect on blood allowed to eat ad libitum from a standard range food intake at 120 minutes, which suggests that
(i.e., using 50 grams of a single food at the same
glucose; it must not only be valid but reliable. As of foods and drinks. A Satiety Index (SI) score test foods producing a higher insulin response
time of day, etc.). The variation would likely be
the research described above documents, for many was calculated for each food by dividing the area were associated with less food intake and thus,
much greater under less controlled or more “real
foods, this is clearly not the case. under the satiety response curve (AUC) for the indirectly, greater satiety.
life” conditions.
given food by the group mean satiety AUC for
10 11
8. The Holt et al. (1995) study has been criticized The twelve week study was conducted in three differences between the low-GL and high-GL diet
for not controlling for macronutrient and water phases. Phase 1 consisted of a seven-week groups in terms of body fat percentage, hunger,
content of the test foods (i.e., not selecting foods baseline period during which subjects were satiety, or satisfaction with the amount and type
with similar amounts of protein, fat, fiber and water instructed to maintain a stable weight and of foods provided.
content). It has been argued that these factors may continue eating their usual diet so as to assess
Potatoes have been unjustly singled out as a food
have overshadowed the effect of the GI on satiety. baseline energy requirements (using a technique
to avoid when attempting to manage body weight
In an attempt to address this methodological known as “doubly labeled water,” which is
due to their supposedly high GI and GL. A study
shortcoming, Dr. Allan Geliebter and colleagues considered the “gold standard” in assessing free-
presented at the 2010 Obesity Society meeting
(2008) investigated the satiety of common living energy expenditure). Following Phase 1,
assessed the role of GI and potatoes in weight
carbohydrate-rich side dishes with varying GIs. subjects were randomly assigned to either a high-
loss (Randolph, et al. 2010). In a 12-week, 3-arm,
Twelve subjects consumed five test meals with or low-GL calorie-restricted diet for 24 weeks.
randomized control trial, 86 overweight men and
similar calorie and macronutrient contents (baked
All food was provided to the subjects at women were randomly assigned to one of three
potato, mashed potato, pasta, brown rice, white
70 percent of individual baseline weight- dietary interventions: (1) low GI, calorie reduced
bread) in randomized order followed by an ad
maintenance energy requirements (i.e., a 30 diet (500 kcal/d); (2) high GI, calorie reduced
libitum lunch meal two hours later. Appetite ratings Indeed, a number of recent studies have failed
percent calorie reduction). The third and final diet (500 kcal/d); (3) control group (counseled
were taken prior to the test meal and at 0, 15, 30, to find a weight loss advantage from low
phase of the study consisted of a 24-week to follow basic dietary guidance including the
60, 90, and 120 minutes. Subjects reported a lower GI diets. (Aston et al. 2008, Das et al. 2007,
calorie-restricted period, during which subjects Dietary Guidelines for Americans and the Food
desire to eat following the potato meals compared Randolph et al. 2010, 2011). For example, Aston
were instructed to follow the dietary patterns Guide Pyramid). All three groups were instructed
with the pasta meal. Similarly, at 120 minutes, and colleagues (2008) examined the effect of
they had in Phase 2 but were no longer provided to consume five-to-seven servings of potatoes
the subjects reported being able to eat less food diets differing in GI on satiety and weight loss in
with the foods (i.e., “self-selected food” period). per week and were provided with a variety of
following the potato meal compared with the overweight women (n=19) over a 12-week period.
The results indicated that both groups reduced recipes for potato dishes. Modest weight loss was
brown rice meal. Nonetheless, despite differences Lower or higher GI versions of key carbohydrate-
their energy intake during the calorie-restriction observed in all three groups (~2% of initial body
in some of the appetite ratings, total energy rich foods (breads, breakfast cereals, rice and
periods, although neither achieved the 30 percent weight) with no significant difference in weight
intake at the subsequent lunch meal did not differ pasta/potatoes) were provided to subjects to
reduction prescribed, and adherence decreased loss between the groups.
between the test meals and was not correlated be incorporated into habitual diets in ad libitum
with time. Both groups lost weight (approximately
with fullness. Subjective experience of fullness was quantities. The results indicated no differences in
energy intake, body weight, or body composition
8 percent of initial body weight), and there was The results of these studies clearly
not significantly correlated to GI.
no significant difference in weight loss between
between treatments. On laboratory investigation show what nutrition professionals
From an obesity perspective, it is important to the groups. In addition, there were no significant
days, there were no differences in subjective
determine if differences in short-term satiety as
have always known: when it comes to
ratings of hunger or fullness, or in energy intake
a result of different GIs actually have an impact at the snack or lunch meal. weight loss it is calories that count—
on body weight regulation. Unfortunately, much
i.e., if you consume more calories
of the currently existing research examining The effects of calorie-restricted diets (30 percent
the impact of GI on weight loss is hampered by calorie reduction) differing in GL on body weight than you expend you will gain weight.
methodological shortcomings, including small and body fat losses was examined by Das et Conversely, if you consume fewer
sample sizes, inadequate controls, and insufficient al. (2007). Subjects included overweight but
otherwise healthy men and women (n-34) who
calories than you expend, you will
durations. Nonetheless, after a critical examination
of the available data, the 2010 Dietary Guidelines were part of a larger, multicenter trial known as lose weight.
Advisory Committee concluded that, “Strong and “CALERIE” (Comprehensive Assessment of the
consistent evidence shows that glycemic index Long-term Effects of Restricting Intake of Energy),
and/or glycemic load are not associated with body designed to examine the effects of calorie
weight and do not lead to greater weight loss or restriction on human health and aging.
better weight maintenance” (D5-21).
12 13
9. Diabetes Potatoes in the American Diet
Largely because of their supposed high glycemic indicated that, after adjusting for potential In early 2011, the Department of Health and Human plate) and places a strong emphasis on fruits
index, potatoes have been implicated in the confounding demographic and lifestyle factors, Services and the United States Department of and vegetables by filling half the plate with
development of type 2 diabetes and are often one there was no observed association between the Agriculture (USDA) released the 2010 Dietary these two important food groups. Research
of the first foods to be eliminated from the diabetic frequency of potato (baked, boiled and mashed) Guidelines for Americans. A strong emphasis indicates that putting potatoes on the plate
diet. Nonetheless, existing research examining consumption and the prevalence of type 2 diabetes. was made on reducing calorie consumption and can improve the overall diet quality of both
the role of GI in the genesis and/or management increasing physical activity. The other two areas adults and children. Using dietary intake
The American Dietetic Association does not
of type 2 diabetes is controversial, rendering of strong focus were consuming more “healthy data from the NHANES database, Dr. Adam
endorse the elimination of any food or food
definitive conclusions of the subject difficult. foods” like fruits and vegetables, as well as Drewnowski and colleagues (Drewnowski et
groups, but rather supports a “total diet approach”
Indeed, there are equally as many studies showing consuming less sodium, saturated and trans fats, al. 2011, Drewnowski and Rehm 2011) from the
where “all foods can fit if consumed in moderation
a beneficial role of GI for type 2 diabetes as those added sugars and refined grains. Potatoes fit University of Washington examined the nutrient
with the appropriate portions sizes” (Freeland-
showing no benefit (van Wouldenbergh 2011, squarely among all the recommendations. intakes and diet quality of adults and children
Graves et al. 2007). Likewise, the American
Marsh et al. 2011, Mosdol et al. 2007). classified by the
Diabetes Association conducted an extensive Overweight and obesity frequency of potato
Moreover, many of the studies implicating GI and, review of scientific studies and concluded that, in the U.S. exceeds two- consumption.
more specifically potatoes, in the development for people with type 2 diabetes monitoring thirds of the population, The results
of type 2 diabetes have been epidemiological in carbohydrate intake, whether by carbohydrate so it’s no surprise the indicated those
nature (demonstrating only an association and not counting or experience-based estimation, remains 2010 Dietary Guidelines who consumed
causation), have not differentiated between potato a key strategy in achieving glycemic control for Americans also baked, boiled and
products (i.e., highly processed potatoes vs. fresh (American Diabetes Association). highlight the importance roasted potatoes
potatoes) and/or have not adequately controlled of weight management. had higher intakes
Determining how much carbohydrate you need
for potential confounding dietary and other As described previously, of potassium and
each day depends on many things including how
lifestyle factors (e.g., fat intake, fruit and vegetable potatoes can be a part of vitamin C and
active you are and what, if any, medicines you take.
intake, red meat intake, fiber intake, physical a weight loss program. consumed more
activity, socioeconomic status, etc.) (Halton et al. A good place to start is to aim for about 45- Moreover, potatoes also total vegetables in
2006, Drewnowski 2011). 60 grams of carbohydrate at a meal (American provide two of the key a day compared to
Diabetes Association). You may need more or less “shortfall” nutrients those who did not
Indeed, when these confounding factors are
carbohydrate at meals depending on how you identified by the 2010 consume potatoes.
controlled, any relationship between potatoes
manage your type 2 diabetes. Once you know how Dietary Guidelines
and type 2 diabetes seems to disappear. In a
much carbohydrate to eat at a meal, choose your Advisory Committee — potassium and fiber
recent study Drewnowski (2011) used data from
food and the portion size to match. And don’t shy — which are nutrients currently consumed in
two cycles of NHANES (2003-4 and 2005-6)
away from potatoes; they can make a significant inadequate amounts by Americans. The number
to evaluate the association between potato
contribution to your daily vitamin and mineral one listed food source for potassium is potatoes,
consumption frequency and incidence of type 2
requirements. A 5.3 oz potato, eaten with the skin, with 738 mg for a standard portion. (Note: USDA
diabetes. Statistical
delivers 45% of the Daily Value for vitamin C, 2 and FDA use different potato portions in their
adjustment was
grams of fiber and more potassium than a banana databases).
made for potential
(620 mg). The following potato servings provide
confounding To further illustrate the 2010 Dietary Guidelines
about 15 grams of carbohydrate:
factors including for Americans, the USDA replaced the
race/ethnicity, • otato, boiled, 1/2 cup or 1/2 medium (3 oz.)
P multicolored pyramid with MyPlate. This icon
education, diet • otato, baked with skin, 1/4 large (3 oz.)
P provides a visual representation of the food
quality, and physical • otato, mashed, 1/2 cup
P groups that should make up a meal (i.e., a
activity. The results
14 15
12. F r e s h p otato T Y P ES
Yellows
This type, well-known throughout Europe and fast gaining popularity in
There are hundreds of potato varieties planted around the
the U.S., boasts golden skin and golden flesh. One favored use is grilling.
world today. The seven main potato types consumers most Its crispy skin enhances the dense and buttery texture of the flesh.
often see at the store today are: Grilling brings out this quality best, dazzling the palate with its slightly
sweet, caramelized flavor. That naturally smooth and buttery texture also
lends itself well to lighter versions of baked or roasted potatoes.
Russets
Russets are the most widely used potato type in the United States,
characterized by a brown, netted skin and white flesh. One favored Purples/Blues
use for russets is baking. The delicious result has a light and fluffy Relative newcomers to the produce department, purple potatoes have
center, surrounded by a tasty, robust and crispy roasted skin. The a deep purple skin with flesh that ranges from purple to lavender to
delicate potato flavor and grainy texture of a baked russet makes almost white. The rich, vibrant color and luscious taste make tossed
it the ideal partner for a variety of toppings, as flavor infusion is salads a favored use for this type. The moist, firm flesh retains its
so natural to this type. Russets also create light and fluffy mashed shape while adding rich colors to any salad. Because of their mild, yet
potatoes and traditional crispy, pan-fried potatoes. distinctly nutty flavor, purple potatoes naturally complement green
salad flavors. Purple potatoes are also sensational roasted – or try
combining purples with fingerlings or reds to instantly create a colorful
Reds side dish bursting with flavor!
This variety, once only available in late summer and early fall,
is widely known for its rosy red skin and white flesh. One of its
favored uses is in soups and stews. Its moist, waxy flesh stays Fingerlings
firm throughout the cooking process and the vibrant red skin This category of potatoes encompasses a wide variety of small, slender
adds an appealing color to enhance the presentation of any dish. “finger-sized” potatoes, typically ranging from 2 to 4 inches in length.
The slightly sweet and always-tender texture also absorbs the These varieties come in a wide range of skin and flesh colors – red,
hearty flavors of the stock. In addition to savory soups and stews, orange, purple, yellow and white – and most possess a firm, waxy texture.
reds are frequently used to make tender, yet firm potato salad or Pan-frying, one favored use, enhances their robust flavor and showcases
creamy mashed potatoes. their wonderful nutty or buttery tastes. Roasting creates a similarly
delightful flavor sensation. Even consider fingerlings as a change-of-pace
foundation for a truly unique potato salad.
Whites
This all-purpose potato type has a white flesh and white (sometimes
light tan) skin. Mashing is one favored use. These slightly dense Petites
and creamy potatoes have a subtly sweet flavor. Their delicate, thin Petites are small, even “bite-sized” potatoes and share the same
skins add just the right amount of texture to a mashed potato dish characteristics – color, flavor and texture – as their full-sized cousins.
without the need for peeling. Also, try grilling whites to bring out Petites can be found in red, white, yellow, brown and purple. Don’t let
a more full-bodied flavor, or use them in soups and stews as they their size fool you, because their flavors are actually more concentrated
become tender, yet hold their shape well. and they cook more quickly, which makes potato salads a favored use for
these types. Petites also make colorful, delicious and fun roasted potatoes.
20 21
13. Ta b l e o f C o n t e n t s
C oo k ing with
potato e s
23