Download as PDF, PPTX

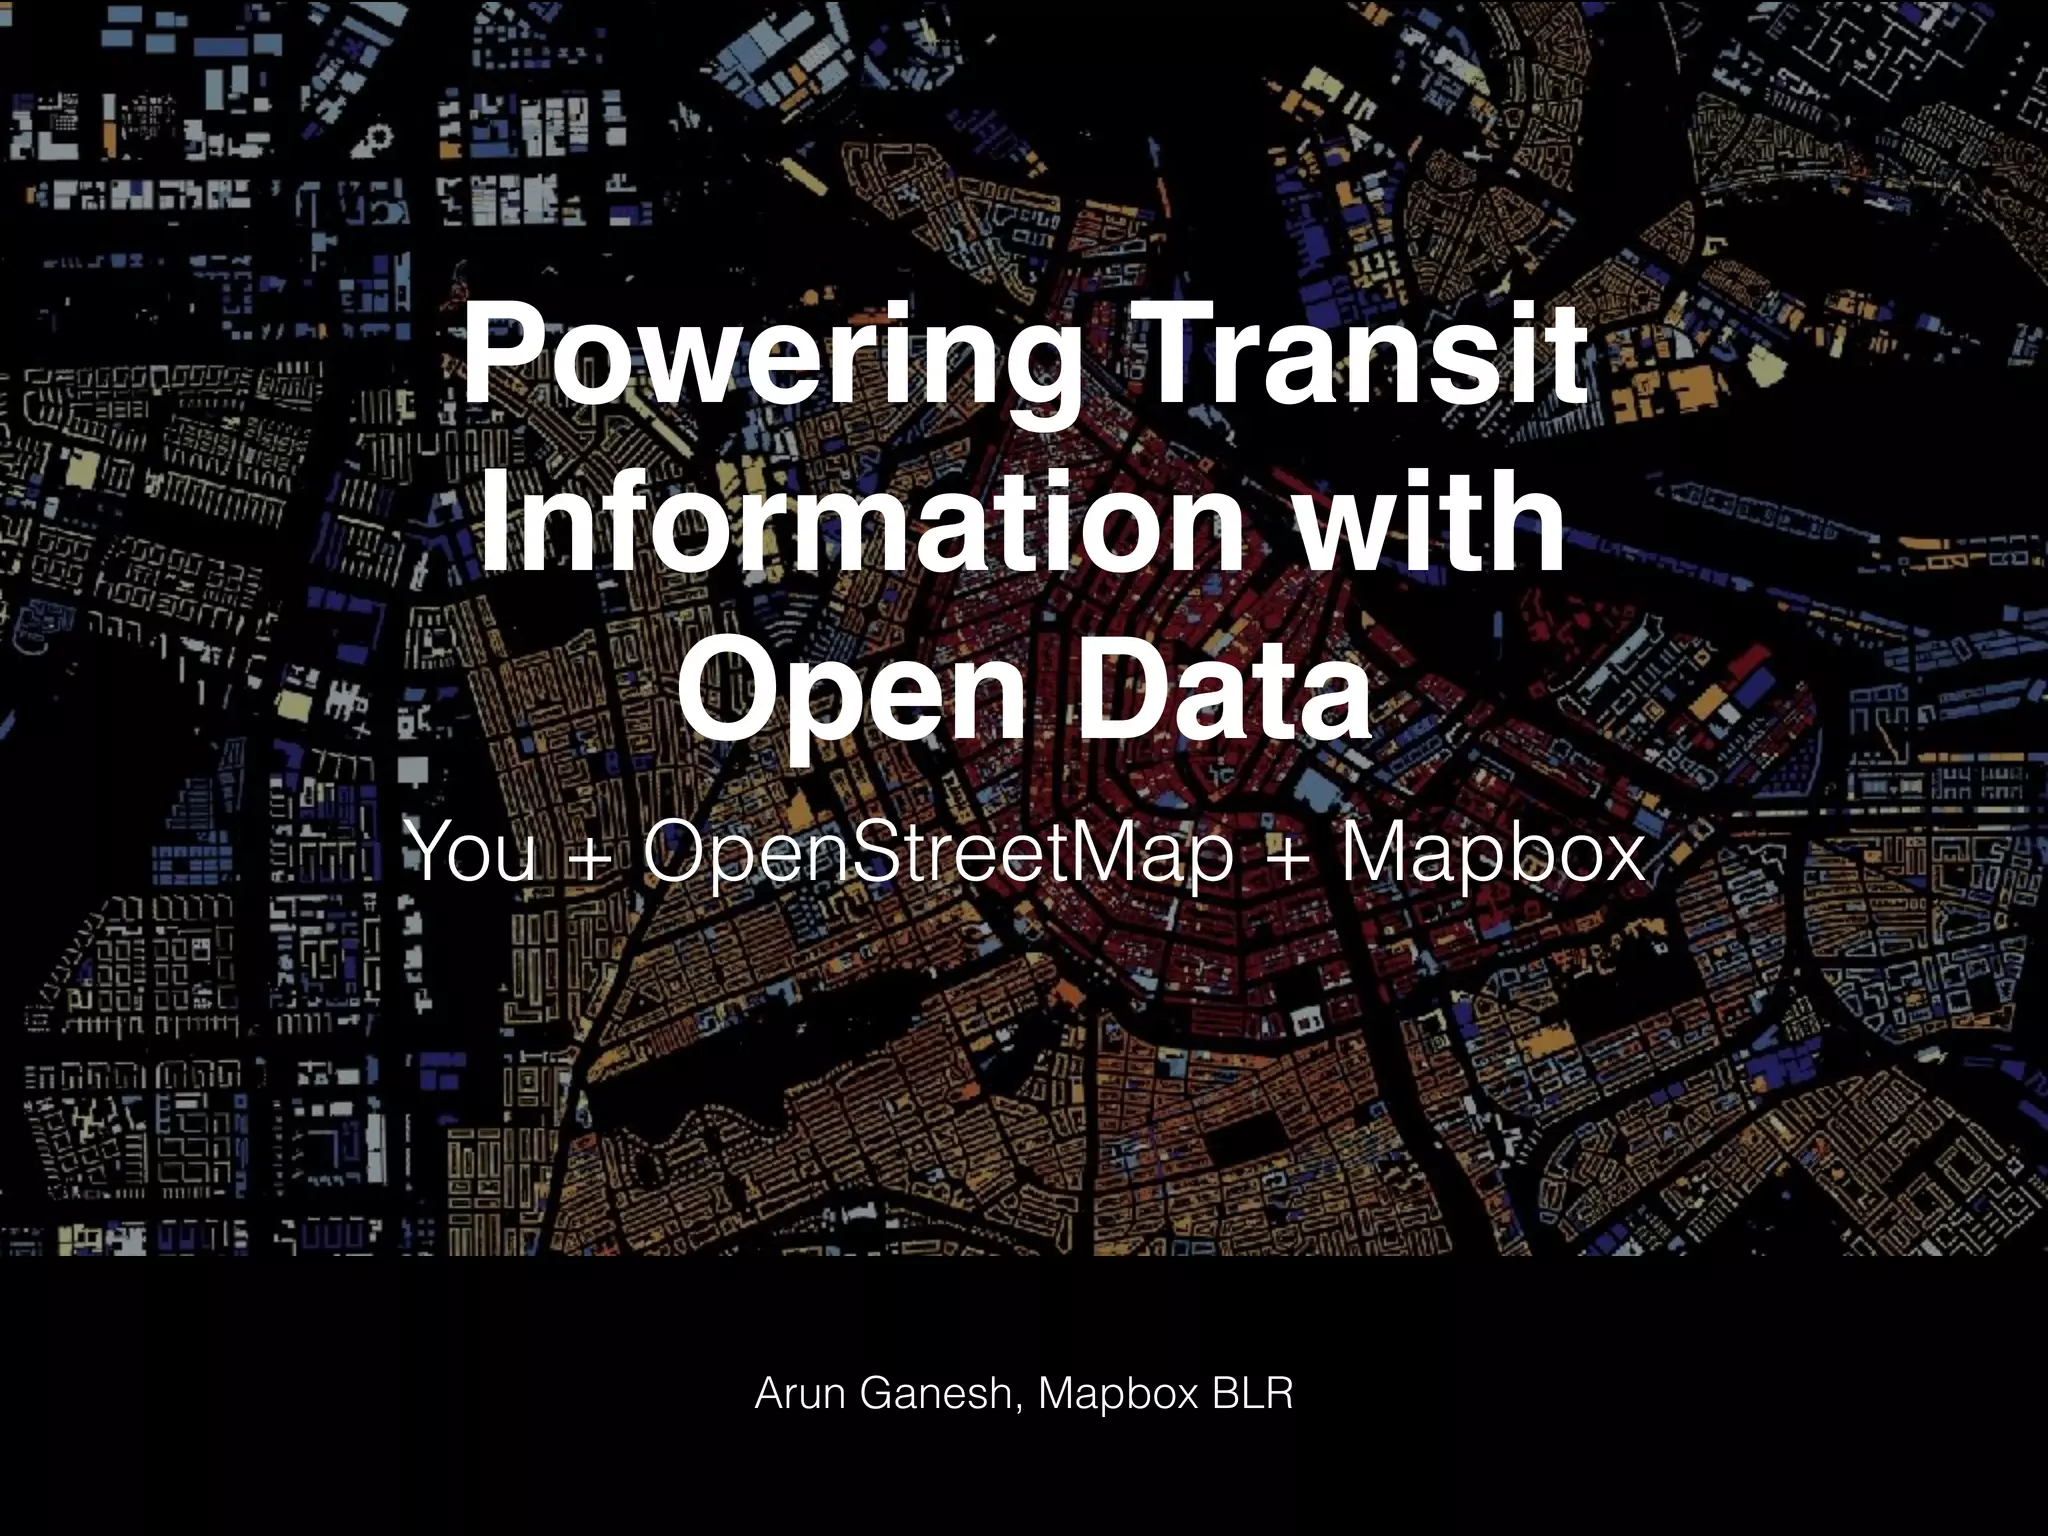
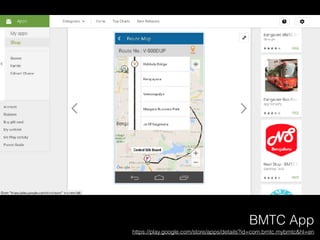
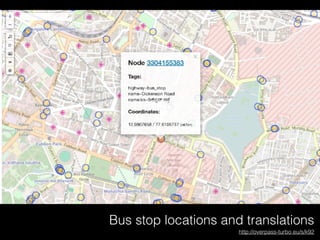
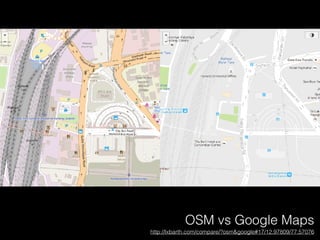
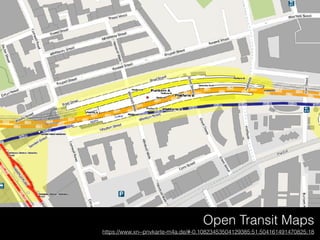
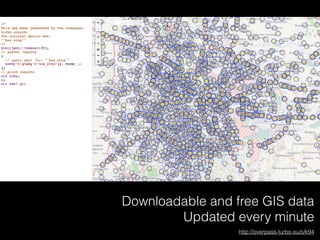
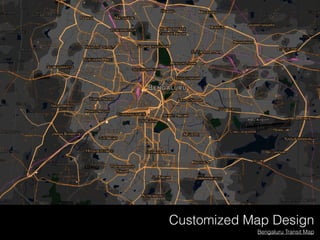
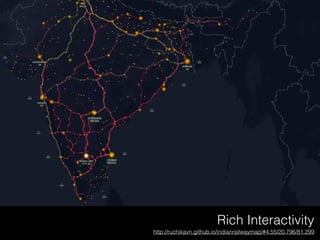
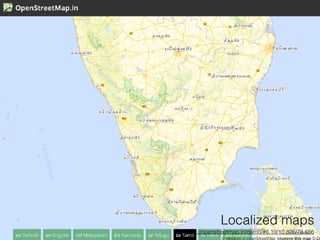

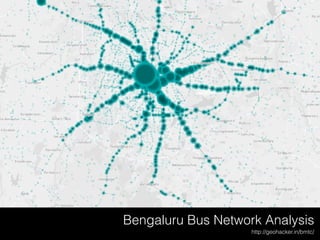
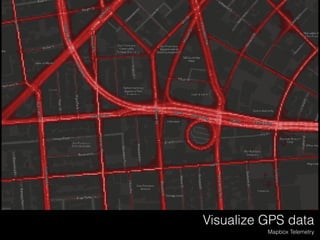
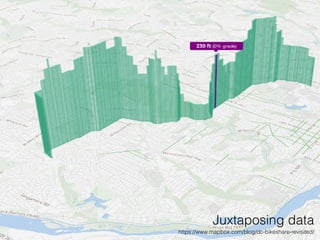

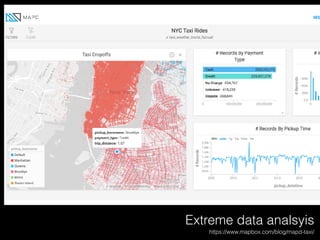
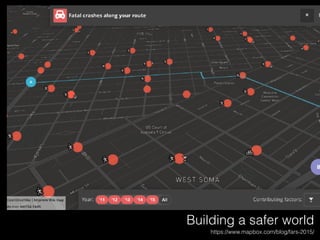
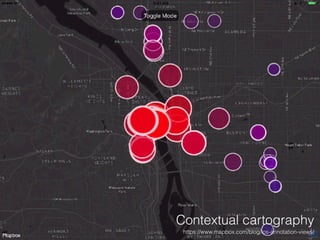
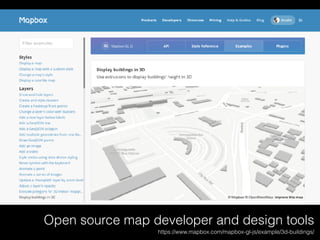

The document discusses the integration of open data with mapping tools like OpenStreetMap and Mapbox to enhance transit information, specifically focusing on the Bengaluru bus network. It highlights various resources for accessing and visualizing transit data, such as map design and GPS telemetry. The emphasis is on the power of open-source tools to create customized and interactive maps for improved public transportation experience.