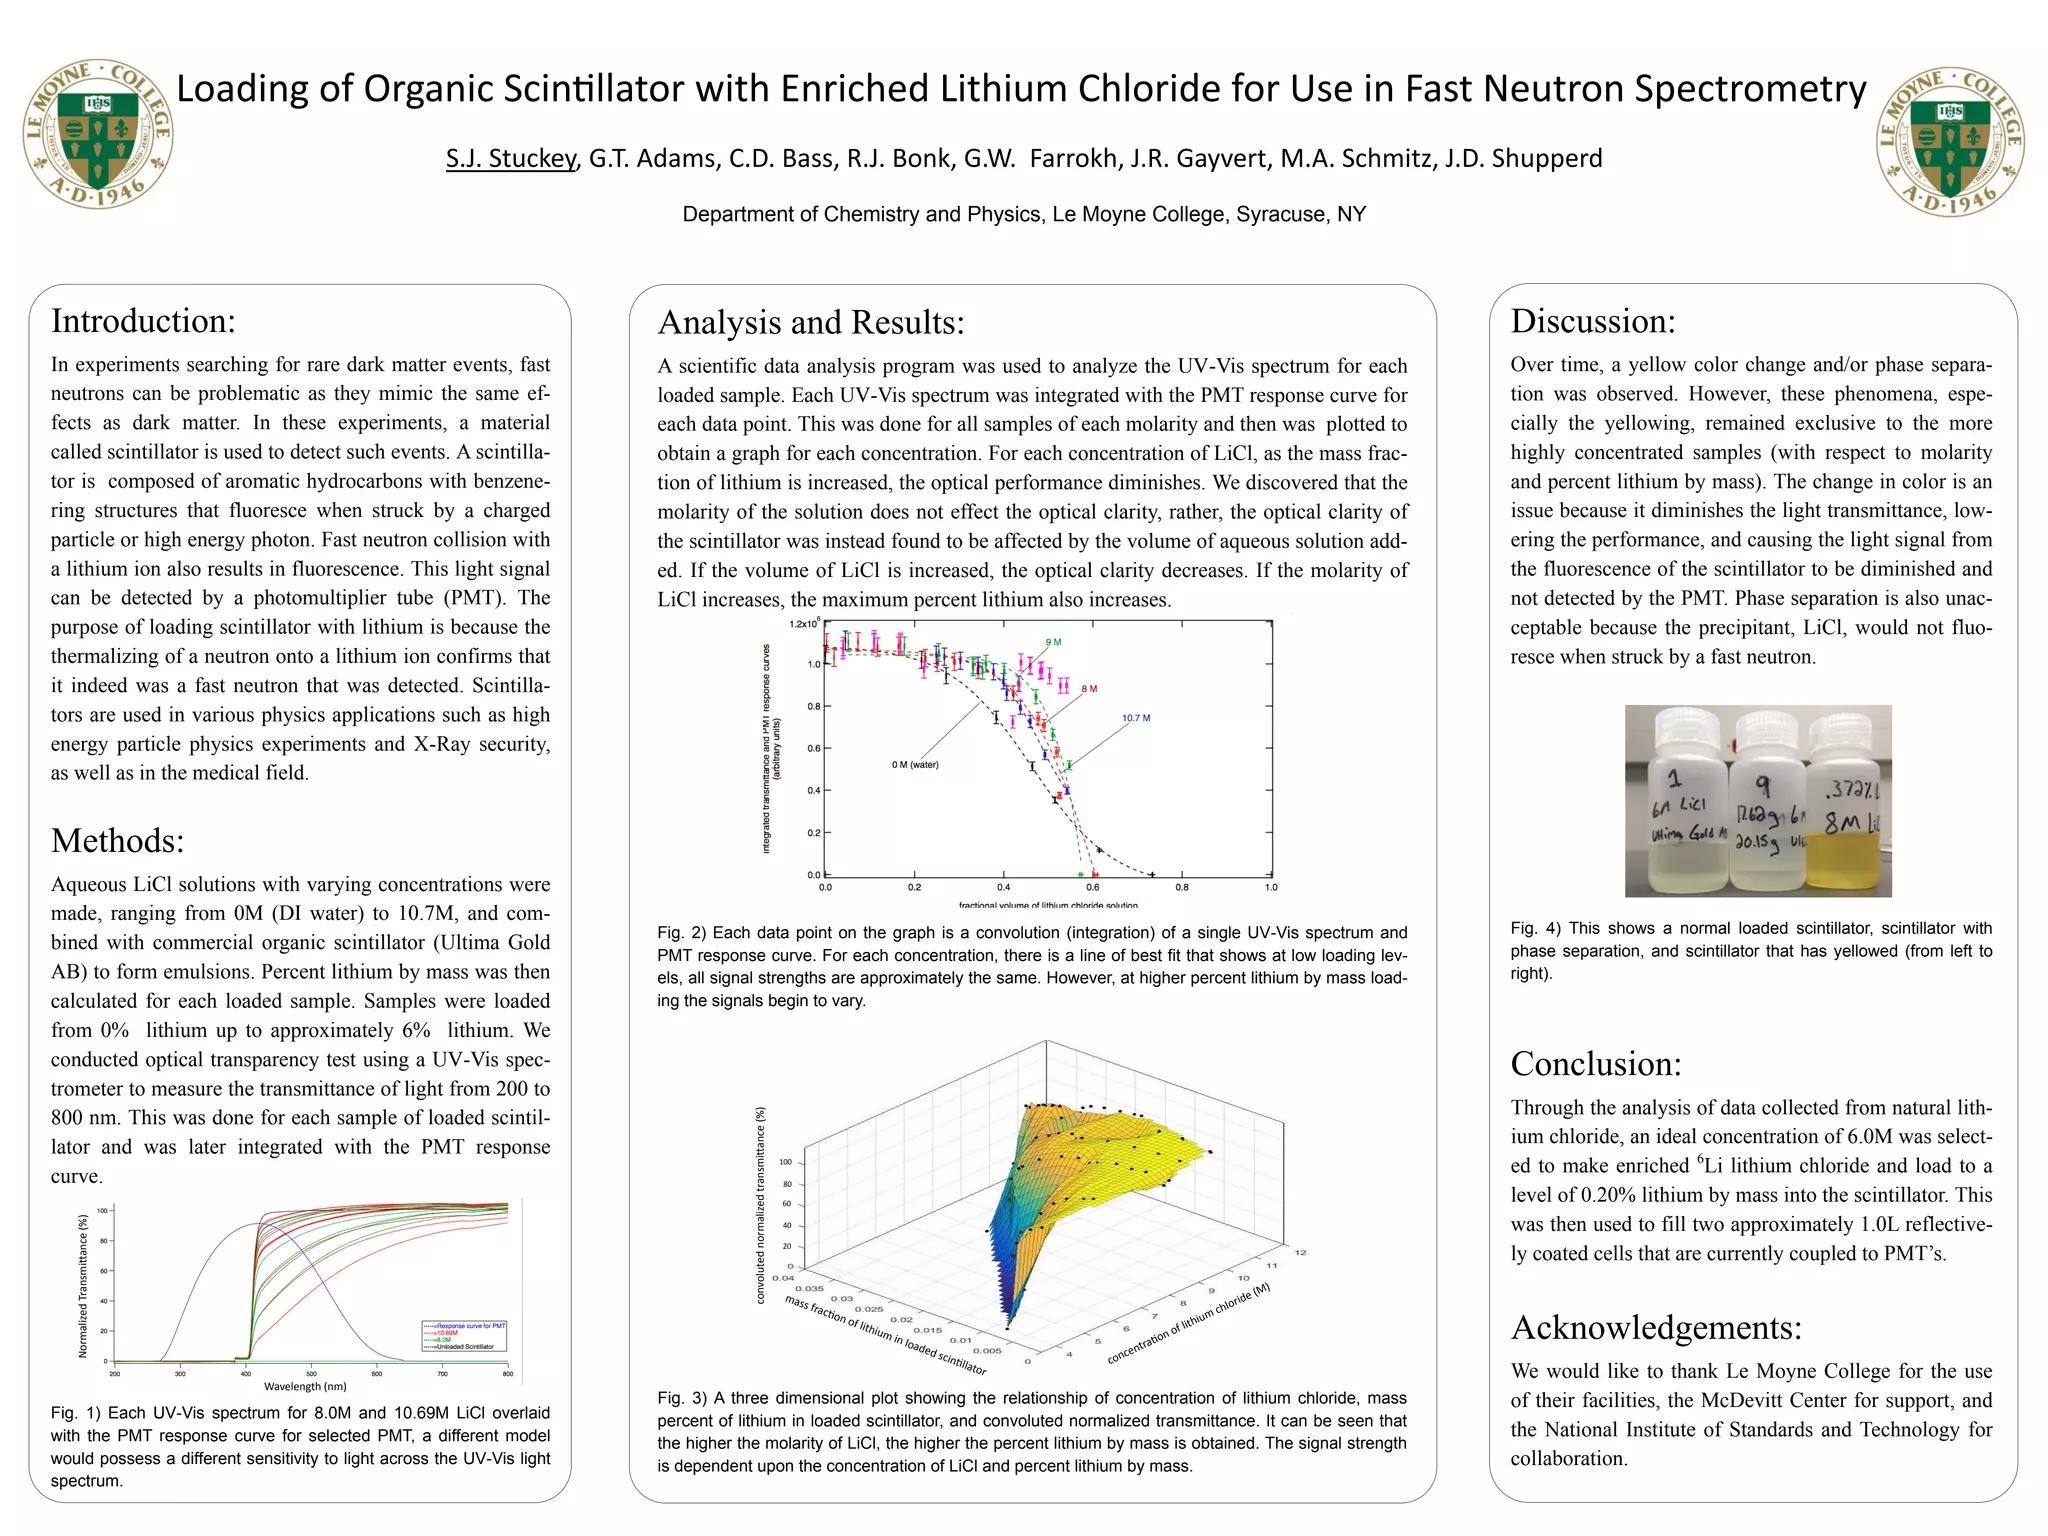
Loading of Organic Scintillator with Enriched Lithium Chloride for Use in Fast Neutron Spectrometry
S.J. Stuckey, G.T. Adams, C.D. Bass, R.J. Bonk, G.W. Farrokh, J.R. Gayvert, M.A. Schmitz, J.D. Shupperd
Department of Chemistry and Physics, Le Moyne College, Syracuse, NY
Introduction:
In experiments searching for rare dark matter events, fast
neutrons can be problematic as they mimic the same ef-
fects as dark matter. In these experiments, a material
called scintillator is used to detect such events. A scintilla-
tor is composed of aromatic hydrocarbons with benzene-
ring structures that fluoresce when struck by a charged
particle or high energy photon. Fast neutron collision with
a lithium ion also results in fluorescence. This light signal
can be detected by a photomultiplier tube (PMT). The
purpose of loading scintillator with lithium is because the
thermalizing of a neutron onto a lithium ion confirms that
it indeed was a fast neutron that was detected. Scintilla-
tors are used in various physics applications such as high
energy particle physics experiments and X-Ray security,
as well as in the medical field.
Methods:
Aqueous LiCl solutions with varying concentrations were
made, ranging from 0M (DI water) to 10.7M, and com-
bined with commercial organic scintillator (Ultima Gold
AB) to form emulsions. Percent lithium by mass was then
calculated for each loaded sample. Samples were loaded
from 0% lithium up to approximately 6% lithium. We
conducted optical transparency test using a UV-Vis spec-
trometer to measure the transmittance of light from 200 to
800 nm. This was done for each sample of loaded scintil-
lator and was later integrated with the PMT response
curve.
Fig. 1) Each UV-Vis spectrum for 8.0M and 10.69M LiCl overlaid
with the PMT response curve for selected PMT, a different model
would possess a different sensitivity to light across the UV-Vis light
spectrum.
Discussion:
Over time, a yellow color change and/or phase separa-
tion was observed. However, these phenomena, espe-
cially the yellowing, remained exclusive to the more
highly concentrated samples (with respect to molarity
and percent lithium by mass). The change in color is an
issue because it diminishes the light transmittance, low-
ering the performance, and causing the light signal from
the fluorescence of the scintillator to be diminished and
not detected by the PMT. Phase separation is also unac-
ceptable because the precipitant, LiCl, would not fluo-
resce when struck by a fast neutron.
Fig. 4) This shows a normal loaded scintillator, scintillator with
phase separation, and scintillator that has yellowed (from left to
right).
Conclusion:
Through the analysis of data collected from natural lith-
ium chloride, an ideal concentration of 6.0M was select-
ed to make enriched 6
Li lithium chloride and load to a
level of 0.20% lithium by mass into the scintillator. This
was then used to fill two approximately 1.0L reflective-
ly coated cells that are currently coupled to PMT’s.
Acknowledgements:
We would like to thank Le Moyne College for the use
of their facilities, the McDevitt Center for support, and
the National Institute of Standards and Technology for
collaboration.
Analysis and Results:
A scientific data analysis program was used to analyze the UV-Vis spectrum for each
loaded sample. Each UV-Vis spectrum was integrated with the PMT response curve for
each data point. This was done for all samples of each molarity and then was plotted to
obtain a graph for each concentration. For each concentration of LiCl, as the mass frac-
tion of lithium is increased, the optical performance diminishes. We discovered that the
molarity of the solution does not effect the optical clarity, rather, the optical clarity of
the scintillator was instead found to be affected by the volume of aqueous solution add-
ed. If the volume of LiCl is increased, the optical clarity decreases. If the molarity of
LiCl increases, the maximum percent lithium also increases.
Fig. 2) Each data point on the graph is a convolution (integration) of a single UV-Vis spectrum and
PMT response curve. For each concentration, there is a line of best fit that shows at low loading lev-
els, all signal strengths are approximately the same. However, at higher percent lithium by mass load-
ing the signals begin to vary.
Fig. 3) A three dimensional plot showing the relationship of concentration of lithium chloride, mass
percent of lithium in loaded scintillator, and convoluted normalized transmittance. It can be seen that
the higher the molarity of LiCl, the higher the percent lithium by mass is obtained. The signal strength
is dependent upon the concentration of LiCl and percent lithium by mass.
Wavelength (nm)
NormalizedTransmittance(%)
concentration of lithium chloride (M)
mass fraction of lithium in loaded scintillator
convolutednormalizedtransmittance(%)
20
40
60
80
100

poster presentation stuckey

  • 1.
    Loading of OrganicScintillator with Enriched Lithium Chloride for Use in Fast Neutron Spectrometry S.J. Stuckey, G.T. Adams, C.D. Bass, R.J. Bonk, G.W. Farrokh, J.R. Gayvert, M.A. Schmitz, J.D. Shupperd Department of Chemistry and Physics, Le Moyne College, Syracuse, NY Introduction: In experiments searching for rare dark matter events, fast neutrons can be problematic as they mimic the same ef- fects as dark matter. In these experiments, a material called scintillator is used to detect such events. A scintilla- tor is composed of aromatic hydrocarbons with benzene- ring structures that fluoresce when struck by a charged particle or high energy photon. Fast neutron collision with a lithium ion also results in fluorescence. This light signal can be detected by a photomultiplier tube (PMT). The purpose of loading scintillator with lithium is because the thermalizing of a neutron onto a lithium ion confirms that it indeed was a fast neutron that was detected. Scintilla- tors are used in various physics applications such as high energy particle physics experiments and X-Ray security, as well as in the medical field. Methods: Aqueous LiCl solutions with varying concentrations were made, ranging from 0M (DI water) to 10.7M, and com- bined with commercial organic scintillator (Ultima Gold AB) to form emulsions. Percent lithium by mass was then calculated for each loaded sample. Samples were loaded from 0% lithium up to approximately 6% lithium. We conducted optical transparency test using a UV-Vis spec- trometer to measure the transmittance of light from 200 to 800 nm. This was done for each sample of loaded scintil- lator and was later integrated with the PMT response curve. Fig. 1) Each UV-Vis spectrum for 8.0M and 10.69M LiCl overlaid with the PMT response curve for selected PMT, a different model would possess a different sensitivity to light across the UV-Vis light spectrum. Discussion: Over time, a yellow color change and/or phase separa- tion was observed. However, these phenomena, espe- cially the yellowing, remained exclusive to the more highly concentrated samples (with respect to molarity and percent lithium by mass). The change in color is an issue because it diminishes the light transmittance, low- ering the performance, and causing the light signal from the fluorescence of the scintillator to be diminished and not detected by the PMT. Phase separation is also unac- ceptable because the precipitant, LiCl, would not fluo- resce when struck by a fast neutron. Fig. 4) This shows a normal loaded scintillator, scintillator with phase separation, and scintillator that has yellowed (from left to right). Conclusion: Through the analysis of data collected from natural lith- ium chloride, an ideal concentration of 6.0M was select- ed to make enriched 6 Li lithium chloride and load to a level of 0.20% lithium by mass into the scintillator. This was then used to fill two approximately 1.0L reflective- ly coated cells that are currently coupled to PMT’s. Acknowledgements: We would like to thank Le Moyne College for the use of their facilities, the McDevitt Center for support, and the National Institute of Standards and Technology for collaboration. Analysis and Results: A scientific data analysis program was used to analyze the UV-Vis spectrum for each loaded sample. Each UV-Vis spectrum was integrated with the PMT response curve for each data point. This was done for all samples of each molarity and then was plotted to obtain a graph for each concentration. For each concentration of LiCl, as the mass frac- tion of lithium is increased, the optical performance diminishes. We discovered that the molarity of the solution does not effect the optical clarity, rather, the optical clarity of the scintillator was instead found to be affected by the volume of aqueous solution add- ed. If the volume of LiCl is increased, the optical clarity decreases. If the molarity of LiCl increases, the maximum percent lithium also increases. Fig. 2) Each data point on the graph is a convolution (integration) of a single UV-Vis spectrum and PMT response curve. For each concentration, there is a line of best fit that shows at low loading lev- els, all signal strengths are approximately the same. However, at higher percent lithium by mass load- ing the signals begin to vary. Fig. 3) A three dimensional plot showing the relationship of concentration of lithium chloride, mass percent of lithium in loaded scintillator, and convoluted normalized transmittance. It can be seen that the higher the molarity of LiCl, the higher the percent lithium by mass is obtained. The signal strength is dependent upon the concentration of LiCl and percent lithium by mass. Wavelength (nm) NormalizedTransmittance(%) concentration of lithium chloride (M) mass fraction of lithium in loaded scintillator convolutednormalizedtransmittance(%) 20 40 60 80 100