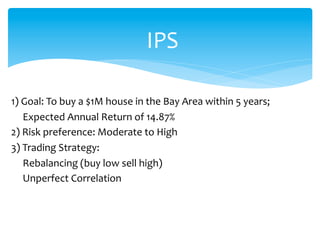
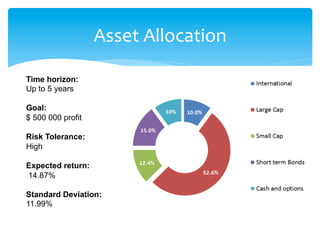
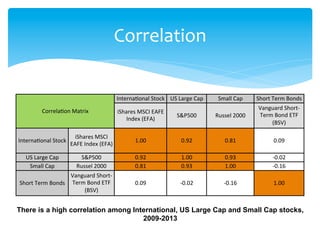
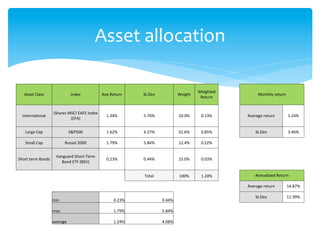
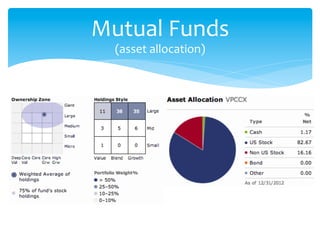
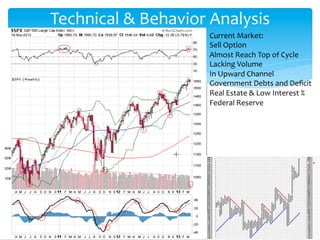
Gangming	
  Liang	


StockTrak	
  Presentation	
  
Portfolio	
  Management
1)	
  Goal:	
  To	
  buy	
  a	
  $1M	
  house	
  in	
  the	
  Bay	
  Area	
  within	
  5	
  years;	


  Expected	
  Annual	
  Return	
  of	
  14.87%	
  	
  
2)	
  Risk	
  preference:	
  Moderate	
  to	
  High	
  
3)	
  Trading	
  Strategy:	


  Rebalancing	
  (buy	
  low	
  sell	
  high)	


  Unperfect	
  Correlation	


IPS
Asset	
  Allocation
Time horizon:
Up to 5 years
Goal:
$ 500 000 profit
Risk Tolerance:
High
Expected return:
14.87%
Standard Deviation:
11.99%
Correlation
Correla'on	
  Matrix	
  
Interna'onal	
  Stock	
   US	
  Large	
  Cap	
   Small	
  Cap	
   Short	
  Term	
  Bonds	
  
iShares	
  MSCI	
  EAFE	
  
Index	
  (EFA)	
  
S&P500	
   Russel	
  2000	
  
Vanguard	
  Short-­‐
Term	
  Bond	
  ETF	
  
(BSV)	
  
Interna'onal	
  Stock	
  
iShares	
  MSCI	
  
EAFE	
  Index	
  (EFA)	
  
1.00	
   0.92	
   0.81	
   0.09	
  
US	
  Large	
  Cap	
   S&P500	
   0.92	
   1.00	
   0.93	
   -­‐0.02	
  
Small	
  Cap	
   Russel	
  2000	
   0.81	
   0.93	
   1.00	
   -­‐0.16	
  
Short	
  Term	
  Bonds	
  
Vanguard	
  Short-­‐
Term	
  Bond	
  ETF	
  
(BSV)	
  
0.09	
   -­‐0.02	
   -­‐0.16	
   1.00	
  
There is a high correlation among International, US Large Cap and Small Cap stocks,
2009-2013
Asset	
  allocation	
  
Asset	
  Class	
   Index	
   Ave.Return	
   St.Dev	
   Weight	
  
Weighted	
  
Return	
  
Monthly	
  return	
  
Interna'onal	
  	
  
iShares	
  MSCI	
  EAFE	
  Index	
  
(EFA)	
  
1.34%	
   5.76%	
   10.0%	
   0.13%	
   Average	
  return	
   1.24%	
  
Large	
  Cap	
   S&P500	
   1.62%	
   4.27%	
   52.6%	
   0.85%	
   St.Dev	
   3.46%	
  
Small	
  Cap	
   Russel	
  2000	
   1.79%	
   5.84%	
   12.4%	
   0.22%	
  
Short	
  term	
  Bonds	
  
Vanguard	
  Short-­‐Term	
  
Bond	
  ETF	
  (BSV)	
  
0.23%	
   0.44%	
   15.0%	
   0.03%	
  
Total	
   100%	
   1.24%	
   Annualized	
  Return	
  
Average	
  return	
   14.87%	
  
min	
   0.23%	
   0.44%	
  
St.Dev	
   11.99%	
  
max	
   1.79%	
   5.84%	
  
average	
   1.24%	
   4.08%	
  
1)	
  Stocks:	
  P/E	
  <	
  20	
  &	
  PEG	
  >	
  1	


  Market	
  Up:	
  Beta	
  >	
  1	


  Market	
  Down:	
  Beta	
  <	
  1	
  
2)	
  Funds:	
  Top	
  10%	
  Rank	
  &	
  5	
  Morning	
  Stars	


  Diversified	
  Emerging,	
  Small	
  Cap,	
  Large	
  Cap	
  
3)	
  Bonds:	
  High	
  Yield	
  &	
  Short-­‐	
  Term	
  
4)	
  Options:	
  Protective	
  Put,	
  Out-­‐	
  of-­‐	
  Money	

Selection	
  Requirements
Bonds
Mutual	
  Funds
Mutual	
  Funds	
  
(asset	
  allocation)
*  IBM	
  	
  
*  Beta	


*  Alpha	
  
*  Sharpe	
  ratio	
  
*  Treynor	
  ratio	
  
Ratios
p
fp
σ
RR
ratioSharpe
−
=
p
fp
β
RR
ratioTreynor
−
=
Beta	
   0.7030 	
  
Alpha	
   0.0006 	
  
Sharpe Ratio	
   -0.0848 	
  
Treynor Ratio	
   -0.0226 	
  
 
Protect	
  Put:
*  Protect	
  the	
  losses	
  for	
  Decreasing	
  Prices	
  
*  Narrow	
  Range	
  of	
  Bollinger	
  Bands:	
  Long	
  Options	
  
*  Out-­‐	
  of-­‐	
  Money:	
  K>S	

Protective	
  Put
Long	
  IBM+	
  Long	
  Put=	
  Long	
  Call	
  
Technical	
  &	
  Behavior	
  Analysis
Current	
  Market:	
  
Sell	
  Option	
  
Almost	
  Reach	
  Top	
  of	
  Cycle	
  
Lacking	
  Volume	
  
In	
  Upward	
  Channel	
  
Government	
  Debts	
  and	
  Deficit	
  
Real	
  Estate	
  &	
  Low	
  Interest	
  %	
  
Federal	
  Reserve	
  	
  
1)	
  Selection:	
  	
  Beta	
  v.s.	
  Market	
  Movement	


  Allocation	
  v.s.	
  Risks	


  History	
  v.s.	
  BlackSwan	
  Event	
  
2)	
  Trading:	


  Costs	
  Control	


  Timing	


  Option	
  Demand	


Learning	
  Process

Portfolio Management

  • 1.
            Gangming  Liang     StockTrak  Presentation   Portfolio  Management
  • 2.
    1)  Goal:  To  buy  a  $1M  house  in  the  Bay  Area  within  5  years;            Expected  Annual  Return  of  14.87%     2)  Risk  preference:  Moderate  to  High   3)  Trading  Strategy:            Rebalancing  (buy  low  sell  high)            Unperfect  Correlation               IPS
  • 3.
    Asset  Allocation Time horizon: Upto 5 years Goal: $ 500 000 profit Risk Tolerance: High Expected return: 14.87% Standard Deviation: 11.99%
  • 4.
    Correlation Correla'on  Matrix   Interna'onal  Stock   US  Large  Cap   Small  Cap   Short  Term  Bonds   iShares  MSCI  EAFE   Index  (EFA)   S&P500   Russel  2000   Vanguard  Short-­‐ Term  Bond  ETF   (BSV)   Interna'onal  Stock   iShares  MSCI   EAFE  Index  (EFA)   1.00   0.92   0.81   0.09   US  Large  Cap   S&P500   0.92   1.00   0.93   -­‐0.02   Small  Cap   Russel  2000   0.81   0.93   1.00   -­‐0.16   Short  Term  Bonds   Vanguard  Short-­‐ Term  Bond  ETF   (BSV)   0.09   -­‐0.02   -­‐0.16   1.00   There is a high correlation among International, US Large Cap and Small Cap stocks, 2009-2013
  • 5.
    Asset  allocation   Asset  Class   Index   Ave.Return   St.Dev   Weight   Weighted   Return   Monthly  return   Interna'onal     iShares  MSCI  EAFE  Index   (EFA)   1.34%   5.76%   10.0%   0.13%   Average  return   1.24%   Large  Cap   S&P500   1.62%   4.27%   52.6%   0.85%   St.Dev   3.46%   Small  Cap   Russel  2000   1.79%   5.84%   12.4%   0.22%   Short  term  Bonds   Vanguard  Short-­‐Term   Bond  ETF  (BSV)   0.23%   0.44%   15.0%   0.03%   Total   100%   1.24%   Annualized  Return   Average  return   14.87%   min   0.23%   0.44%   St.Dev   11.99%   max   1.79%   5.84%   average   1.24%   4.08%  
  • 6.
    1)  Stocks:  P/E  <  20  &  PEG  >  1                                          Market  Up:  Beta  >  1                Market  Down:  Beta  <  1   2)  Funds:  Top  10%  Rank  &  5  Morning  Stars                                        Diversified  Emerging,  Small  Cap,  Large  Cap   3)  Bonds:  High  Yield  &  Short-­‐  Term   4)  Options:  Protective  Put,  Out-­‐  of-­‐  Money  Selection  Requirements
  • 7.
  • 8.
  • 9.
  • 10.
    *  IBM     *  Beta                                                                                                           *  Alpha   *  Sharpe  ratio   *  Treynor  ratio   Ratios p fp σ RR ratioSharpe − = p fp β RR ratioTreynor − = Beta   0.7030   Alpha   0.0006   Sharpe Ratio   -0.0848   Treynor Ratio   -0.0226  
  • 11.
  • 12.
  • 13.
    *  Protect  the  losses  for  Decreasing  Prices   *  Narrow  Range  of  Bollinger  Bands:  Long  Options   *  Out-­‐  of-­‐  Money:  K>S  Protective  Put Long  IBM+  Long  Put=  Long  Call  
  • 14.
    Technical  &  Behavior  Analysis Current  Market:   Sell  Option   Almost  Reach  Top  of  Cycle   Lacking  Volume   In  Upward  Channel   Government  Debts  and  Deficit   Real  Estate  &  Low  Interest  %   Federal  Reserve    
  • 15.
    1)  Selection:    Beta  v.s.  Market  Movement                                                    Allocation  v.s.  Risks                                                    History  v.s.  BlackSwan  Event   2)  Trading:        Costs  Control                                                    Timing                                                    Option  Demand                                        Learning  Process