The document summarizes key concepts about populations including:
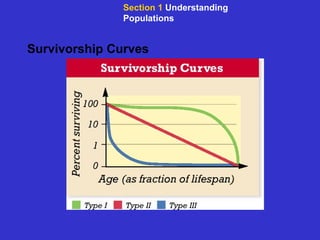
- Populations have properties like size, density, dispersion, age structure, and survivorship that scientists measure
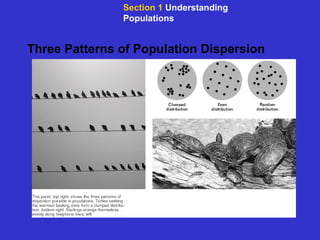
- There are three patterns of population dispersion: random, uniform, and clumped
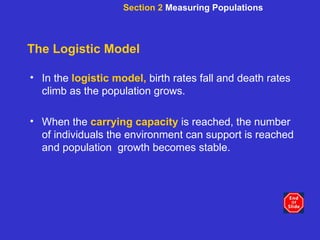
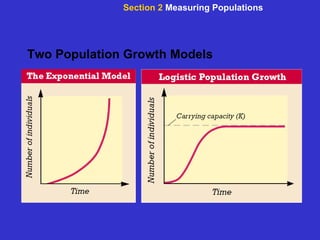
- Populations can have exponential or logistic growth patterns
- Small populations are more vulnerable to extinction due to low genetic diversity