

Recommended
More Related Content
Similar to Pop dist and dens rev 2012
Similar to Pop dist and dens rev 2012 (11)
More from enidwray
More from enidwray (20)
Recently uploaded
Recently uploaded (20)
Pop dist and dens rev 2012
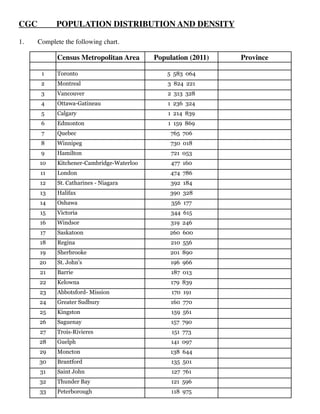
- 1. CGC POPULATION DISTRIBUTION AND DENSITY 1. Complete the following chart. Census Metropolitan Area Population (2011) Province 1 Toronto 5 583 064 2 Montreal 3 824 221 3 Vancouver 2 313 328 4 Ottawa-Gatineau 1 236 324 5 Calgary 1 214 839 6 Edmonton 1 159 869 7 Quebec 765 706 8 Winnipeg 730 018 9 Hamilton 721 053 10 Kitchener-Cambridge-Waterloo 477 160 11 London 474 786 12 St. Catharines - Niagara 392 184 13 Halifax 390 328 14 Oshawa 356 177 15 Victoria 344 615 16 Windsor 319 246 17 Saskatoon 260 600 18 Regina 210 556 19 Sherbrooke 201 890 20 St. John's 196 966 21 Barrie 187 013 22 Kelowna 179 839 23 Abbotsford- Mission 170 191 24 Greater Sudbury 160 770 25 Kingston 159 561 26 Saguenay 157 790 27 Trois-Rivieres 151 773 28 Guelph 141 097 29 Moncton 138 644 30 Brantford 135 501 31 Saint John 127 761 32 Thunder Bay 121 596 33 Peterborough 118 975
- 2. (a) Plot these cities, Census Metropolitan Areas (CMA's), on the attached map of Canada. Group the cities as follows for the purposes of mapping them: Cities with population > 1 000 000 Cities with population between 500 000 - 999 999 Cities with population between 100 000 - 499 999 Use a different colour and symbol for each of the three categories. Remember the rules for map-making in finishing your map construction!! (b) Which province contains the greatest number of CMA's? __________________________________________ (c) Which province(s) or territories have: (i) no top 20 cities? ___________________________________ (ii) no top 10 cities? ___________________________________ (d) How many cities are there in each group: Cities with population > 1 000 000 ________ Cities with population between 500 000 - 999 999 ________ Cities with population between 100 000 - 499 999 ________ (d) Which of the following best describes the distribution of the top 20 cities? Circle your answer. (i) evenly distributed (ii) unevenly distributed (iii) concentrated (iv) both (i) and (ii) (v) both (ii) and (iii) (e) Describe the location of these cities with respect to the U.S. _____________________________________________________________ _____________________________________________________________ (f) Is this location relative to the U.S. important? Yes No Why? ________________________________________________________ ________________________________________________________ ________________________________________________________
- 3. (e) Why do you think Toronto, Montreal (and Vancouver) are so much larger than the other cities? (f) Which cities would you expect to grow the most in the next 10 years? Why? (Hint: Refer to the data set on page ___ of your workbook for some historical perspective) 2. Complete the following chart: POPULATION PROVINCE/TERR AREA (KM2) DENSITY 2011 Census CANADA 33 476 688 Newfoundland 514 536 PEI 140 204 Nova Scotia 921 727 New Brunswick 751 171 Quebec 7 903 001 Ontario 12 851 821 Manitoba 1 208 268 Saskatchewan 1 033 381 Alberta 3 645 257 BC 4 400 057 Yukon Terr 33 897 NW Terr 41 462 Nunavut Terr 31 906