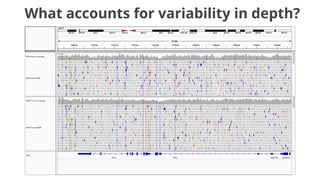
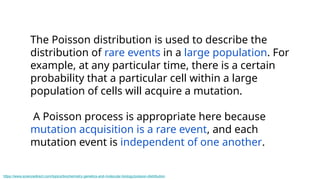
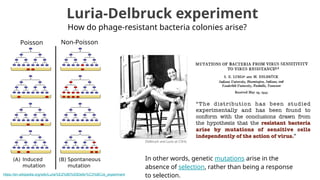
The document discusses the application of Poisson processes in biology, particularly in modeling random events such as mutations and other occurrences in large populations. It explains the utility of the Poisson distribution to predict the occurrence of rare events and provides various examples, including the expected number of mutations in genetic sequences and the analysis of sports statistics. Additionally, it explores how Poisson distributions can be used in experimental setups like single-cell sequencing to optimize the loading of cells in droplets.


![Poisson Distribution. One parameter.
Lambda
Expresses the probability of a given
number of events occurring in a fixed
interval of time or space if these
events occur with a known constant
rate
P(2 earthquakes in one month) = e-2
(12
/2!)
# Plug lambda and k into the
equation
1^2 * exp(-1) / factorial(2)
[1] 0.1839397
# Shortcut (dpois)
dpois(x=2,lambda=1)
[1] 0.1839397](https://image.slidesharecdn.com/poissonrandomvariablesinbiology-241204071124-605bf765/85/Poisson-random-variables-in-biology-pptx-8-320.jpg)
![Mutations at autosomal nucleotide sites are roughly 10 9
−
per year.
Consider a position in your genome. If you could trace its ancestry
back across the last 109
years, what is the probability that you
would find no mutations?
The expected number of mutations is λ = ut, where u = 10 9
−
and t =
109
. Thus, λ = 1. The probability of no mutations at the site you
chose is:
What about the probability of one
or more mutations?
1^0 * exp(-1) /
factorial(0)
[1] 0.3678794
dpois(x=0,lambda=1)
[1] 0.3678794
Alan Rogers](https://image.slidesharecdn.com/poissonrandomvariablesinbiology-241204071124-605bf765/85/Poisson-random-variables-in-biology-pptx-10-320.jpg)


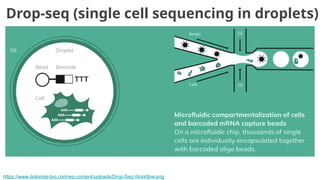
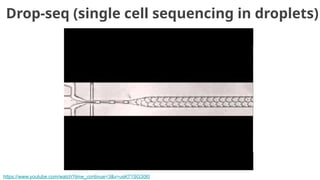
![Goal: one cell per droplet
Should one load
shooting for an average
of one cell per droplet
(lambda = 1)?
Let's simulate.
sc_sim <- rpois(2000, lambda=1)
barplot(table(sc_sim),
col="dodgerblue")
Lot's of droplets
with >1 cell.
"doublets",
"triplets".
What fraction
are expected to
be this way?
What about (lambda =
0.5)?
sc_sim <- rpois(2000, lambda=0.5)
barplot(table(sc_sim),
col="chartreuse4")
Better, but still
many cells with
>1 cell.
What about (lambda =
0.1)?
sc_sim <- rpois(2000, lambda=0.1)
barplot(table(sc_sim), col="darkred")
> dpois(x=1,
lambda=0.1)
[1] 0.09048374
> 0.09048374 * 2000
[1] 180.9675](https://image.slidesharecdn.com/poissonrandomvariablesinbiology-241204071124-605bf765/85/Poisson-random-variables-in-biology-pptx-26-320.jpg)
![Goal: one cell and one bead per droplet
Lamdba = 0.1 to minimize
>1 cell per droplet
> dpois(x=1,
lambda=0.1)
[1] 0.09048374
Lamdba = 0.1 to minimize
>1 bead per droplet
> dpois(x=1,
lambda=0.1)
[1] 0.09048374
X = 0.008
1](https://image.slidesharecdn.com/poissonrandomvariablesinbiology-241204071124-605bf765/85/Poisson-random-variables-in-biology-pptx-27-320.jpg)