Download to read offline


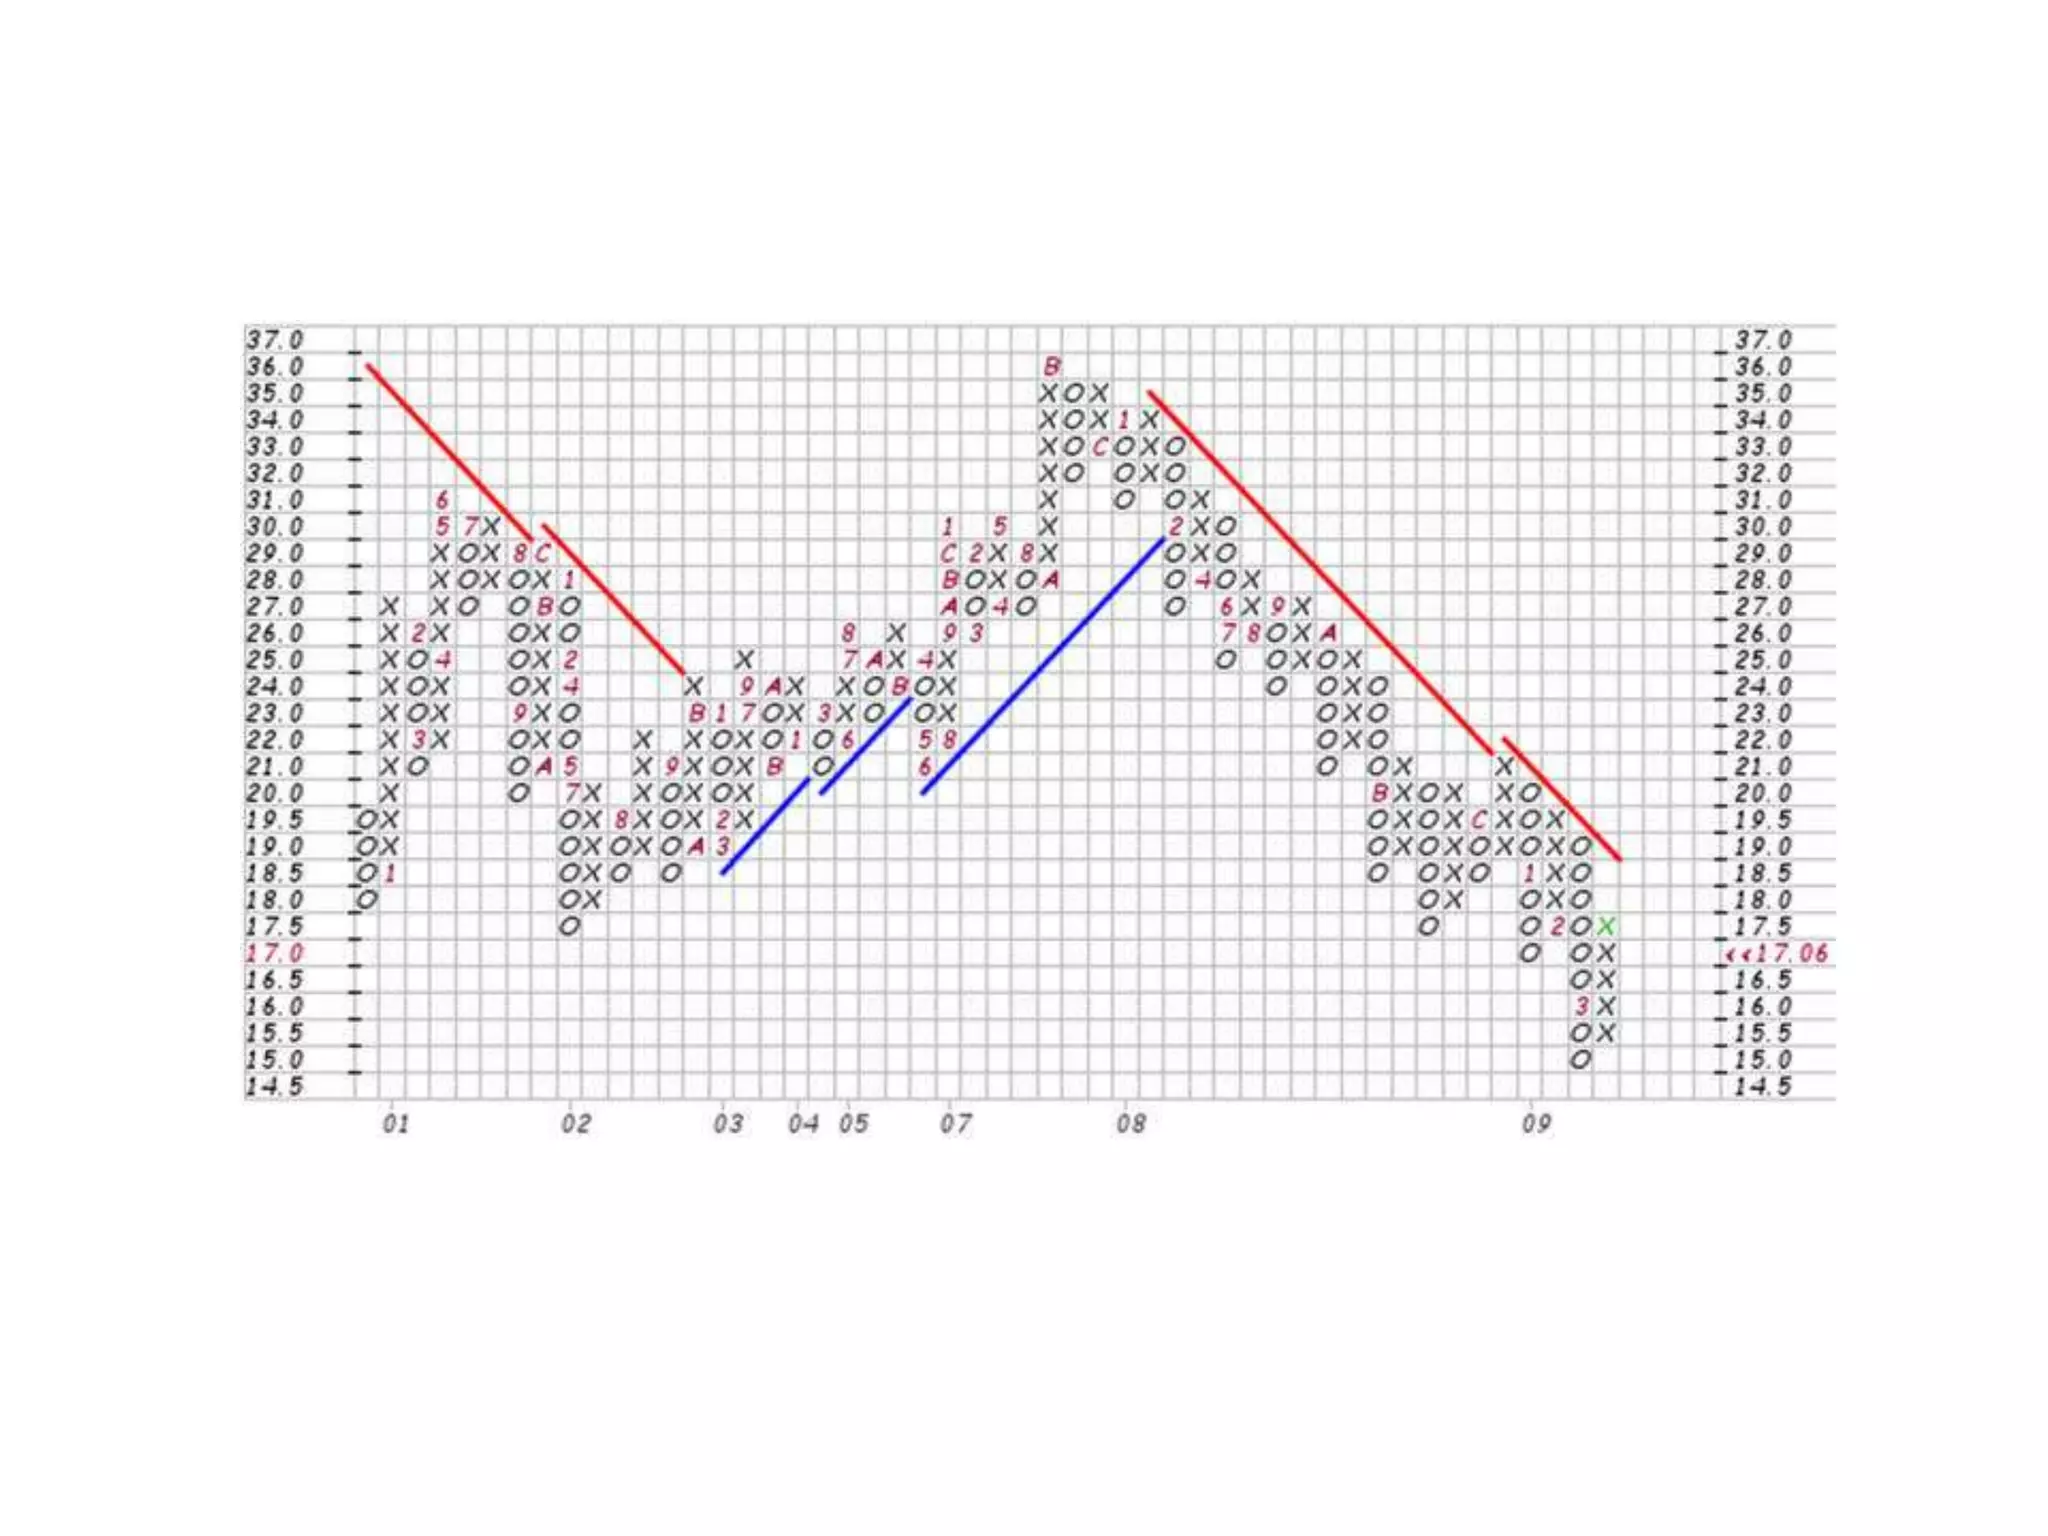


Point and figure charting is a forex trading technique that helps traders analyze market trends without relying on time, focusing only on price movements. This method provides clear buy and sell signals, is simple to construct, and enables traders to set price objectives effectively. However, those using the Metatrader 4 platform may need to download an additional indicator to access point and figure charting features.