Download to read offline


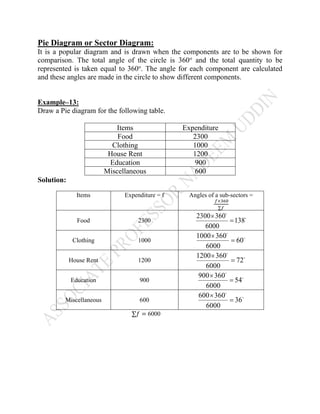
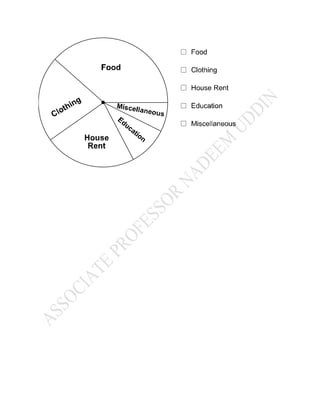

A pie diagram, or sector diagram, is used to compare components of a whole. The total angle of the circle is 360 degrees, representing the total quantity. Each component's proportion is calculated by dividing its value by the total and multiplying by 360, determining the angle of its sector slice in the circle. The document provides an example pie diagram depicting expenditures on food, clothing, rent, education, and miscellaneous items based on their values and percentages of a total budget.


