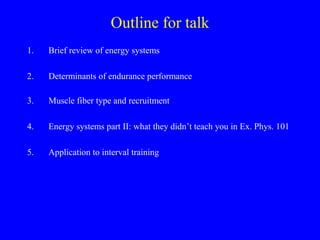
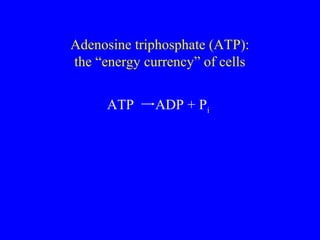
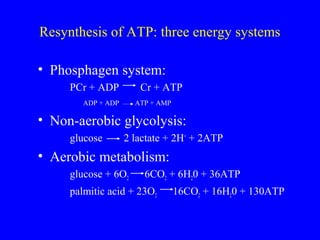
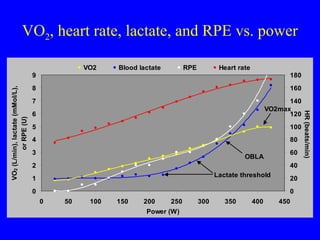
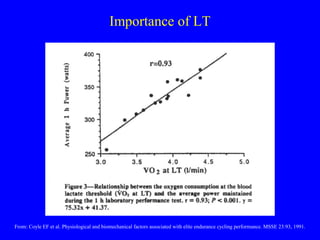
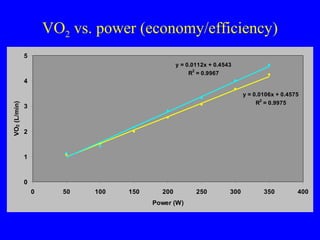
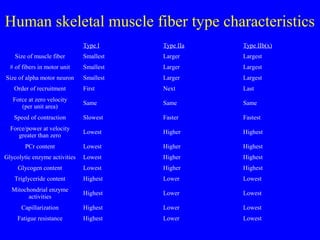
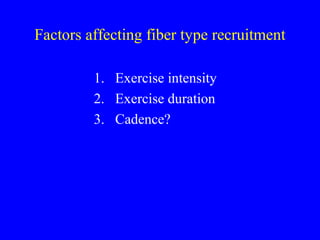
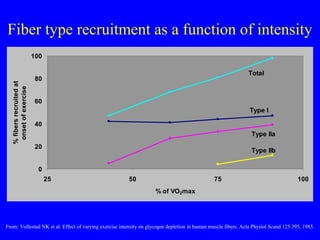
“The science of exercise
and
the art of coaching”
Outline for talk
1.

Brief review of energy systems

2.

Determinants of endurance performance

3.

Muscle fiber type and recruitment

4.

Energy systems part II: what they didn’t teach you in Ex. Phys. 101

5.

Application to interval training
Adenosine triphosphate (ATP):
the “energy currency” of cells
ATP

ADP + Pi
Resynthesis of ATP: three energy systems
• Phosphagen system:
PCr + ADP

Cr + ATP

ADP + ADP

ATP + AMP

• Non-aerobic glycolysis:
glucose

2 lactate + 2H+ + 2ATP

• Aerobic metabolism:
glucose + 6O2

6CO2 + 6H20 + 36ATP

palmitic acid + 23O2

16CO2 + 16H20 + 130ATP
Three energy systems: relative contributions

From: Gastin PB. Energy system interaction and relative contribution during maximal exercise. Sports Med 31:725, 2001
VO2, heart rate, lactate, and RPE vs. power
VO2

Blood lactate

RPE

Heart rate

VO2 (L/min), lactate (mMol/L),
or RPE (U)

180

8

160

7
6

140
VO2max
120

5

100

4

80

3

OBLA

2

60
40

Lactate threshold

1
0

20
0

0

50

100

150

200

250

Power (W)

300

350

400

450

HR (beats/min)

9
Importance of LT

From: Coyle EF et al. Physiological and biomechanical factors associated with elite endurance cycling performance. MSSE 23:93, 1991.
VO2 vs. power (economy/efficiency)
5
y = 0.0112x + 0.4543
R2 = 0.9967

VO2 (L/min)

4
y = 0.0106x + 0.4575
R2 = 0.9975

3

2

1

0
0

50

100

150

200
Power (W)

250

300

350

400
Effect of efficiency on performance

From: Horowitz JF, Sidossis LS, Coyle EF. High efficiency of type I fibers improves performance. Int. J. Sports Med. 15:152, 1994.
Human skeletal muscle fiber type characteristics
Type I

Type IIa

Type IIb(x)

Size of muscle fiber

Smallest

Larger

Largest

# of fibers in motor unit

Smallest

Larger

Largest

Size of alpha motor neuron

Smallest

Larger

Largest

Order of recruitment

First

Next

Last

Force at zero velocity
(per unit area)

Same

Same

Same

Speed of contraction

Slowest

Faster

Fastest

Force/power at velocity
greater than zero

Lowest

Higher

Highest

PCr content

Lowest

Higher

Highest

Glycolytic enzyme activities

Lowest

Higher

Highest

Glycogen content

Lowest

Higher

Highest

Triglyceride content

Highest

Lower

Lowest

Mitochondrial enzyme
activities

Highest

Lower

Lowest

Capillarization

Highest

Lower

Lowest

Fatigue resistance

Highest

Lower

Lowest
Factors affecting fiber type recruitment
1. Exercise intensity
2. Exercise duration
3. Cadence?
Fiber type recruitment as a function of intensity

% fibers recruited at
onset of exercise

100
Total

80
60

Type I
40
Type IIa
20

Type IIb

0
25

50

75

100

% of VO2max

From: Vollestad NK et al. Effect of varying exercise intensity on glycogen depletion in human muscle fibers. Acta Physiol Scand 125:395, 1985.
Energy systems part II:
What they didn’t teach you in
Exercise Physiology 101
Three energy systems: relative contributions

From: Gastin PB. Energy system interaction and relative contribution during maximal exercise. Sports Med 31:725, 2001
Three energy systems: absolute contributions

From: Gastin PB. Energy system interaction and relative contribution during maximal exercise. Sports Med 31:725, 2001
Three energy systems: all-out vs. constant intensity

From: Gastin PB. Energy system interaction and relative contribution during maximal exercise. Sports Med 31:725, 2001
Half-time of PCr resynthesis
Half-lives of physiological responses
Power (force and/or velocity)

(0 s)

Heart rate/cardiac output:

~25 s

Sweating:

~25 s

VO2:

~30 s

VCO2:

~45 s

Ventilation:

~50 s

Temperature (core):

~70 s
Metabolic response to “micro” intervals
Energy metabolism during 30 s sprints

mmol of ATP

1000
Lactate production
PCr breakdown
Aerobic metabolism

750
59%

500

21%
16%
15%

250

63%

26%

0
1

2

3

Sprint bout number

From: Putman CT et al. Skeletal muscle pyruvate dehydrogenase activity during maximal exercise in humans. Am J Physiol 269:E458, 1995.
Analysis of different interval training sessions
• LT intervals: 2 x 20:00/5:00
• VO2max intervals: 6 x 5:00/2:30
• LT intervals: 8 x 5:00/1:00
• Anaerobic capacity intervals: 10 x 1:00/3:00
LT intervals: 2 x 20:00/5:00
VO2max intervals: 6 x 5:00/2:30
LT intervals: 8 x 5:00/1:00
Anaerobic capacity intervals: 10 x 1:00/3:00

Physiological bases for training colorado springs

  • 1.
    “The science ofexercise and the art of coaching”
  • 2.
    Outline for talk 1. Briefreview of energy systems 2. Determinants of endurance performance 3. Muscle fiber type and recruitment 4. Energy systems part II: what they didn’t teach you in Ex. Phys. 101 5. Application to interval training
  • 3.
    Adenosine triphosphate (ATP): the“energy currency” of cells ATP ADP + Pi
  • 4.
    Resynthesis of ATP:three energy systems • Phosphagen system: PCr + ADP Cr + ATP ADP + ADP ATP + AMP • Non-aerobic glycolysis: glucose 2 lactate + 2H+ + 2ATP • Aerobic metabolism: glucose + 6O2 6CO2 + 6H20 + 36ATP palmitic acid + 23O2 16CO2 + 16H20 + 130ATP
  • 5.
    Three energy systems:relative contributions From: Gastin PB. Energy system interaction and relative contribution during maximal exercise. Sports Med 31:725, 2001
  • 6.
    VO2, heart rate,lactate, and RPE vs. power VO2 Blood lactate RPE Heart rate VO2 (L/min), lactate (mMol/L), or RPE (U) 180 8 160 7 6 140 VO2max 120 5 100 4 80 3 OBLA 2 60 40 Lactate threshold 1 0 20 0 0 50 100 150 200 250 Power (W) 300 350 400 450 HR (beats/min) 9
  • 7.
    Importance of LT From:Coyle EF et al. Physiological and biomechanical factors associated with elite endurance cycling performance. MSSE 23:93, 1991.
  • 8.
    VO2 vs. power(economy/efficiency) 5 y = 0.0112x + 0.4543 R2 = 0.9967 VO2 (L/min) 4 y = 0.0106x + 0.4575 R2 = 0.9975 3 2 1 0 0 50 100 150 200 Power (W) 250 300 350 400
  • 9.
    Effect of efficiencyon performance From: Horowitz JF, Sidossis LS, Coyle EF. High efficiency of type I fibers improves performance. Int. J. Sports Med. 15:152, 1994.
  • 10.
    Human skeletal musclefiber type characteristics Type I Type IIa Type IIb(x) Size of muscle fiber Smallest Larger Largest # of fibers in motor unit Smallest Larger Largest Size of alpha motor neuron Smallest Larger Largest Order of recruitment First Next Last Force at zero velocity (per unit area) Same Same Same Speed of contraction Slowest Faster Fastest Force/power at velocity greater than zero Lowest Higher Highest PCr content Lowest Higher Highest Glycolytic enzyme activities Lowest Higher Highest Glycogen content Lowest Higher Highest Triglyceride content Highest Lower Lowest Mitochondrial enzyme activities Highest Lower Lowest Capillarization Highest Lower Lowest Fatigue resistance Highest Lower Lowest
  • 11.
    Factors affecting fibertype recruitment 1. Exercise intensity 2. Exercise duration 3. Cadence?
  • 12.
    Fiber type recruitmentas a function of intensity % fibers recruited at onset of exercise 100 Total 80 60 Type I 40 Type IIa 20 Type IIb 0 25 50 75 100 % of VO2max From: Vollestad NK et al. Effect of varying exercise intensity on glycogen depletion in human muscle fibers. Acta Physiol Scand 125:395, 1985.
  • 13.
    Energy systems partII: What they didn’t teach you in Exercise Physiology 101
  • 14.
    Three energy systems:relative contributions From: Gastin PB. Energy system interaction and relative contribution during maximal exercise. Sports Med 31:725, 2001
  • 15.
    Three energy systems:absolute contributions From: Gastin PB. Energy system interaction and relative contribution during maximal exercise. Sports Med 31:725, 2001
  • 16.
    Three energy systems:all-out vs. constant intensity From: Gastin PB. Energy system interaction and relative contribution during maximal exercise. Sports Med 31:725, 2001
  • 17.
    Half-time of PCrresynthesis
  • 18.
    Half-lives of physiologicalresponses Power (force and/or velocity) (0 s) Heart rate/cardiac output: ~25 s Sweating: ~25 s VO2: ~30 s VCO2: ~45 s Ventilation: ~50 s Temperature (core): ~70 s
  • 19.
    Metabolic response to“micro” intervals
  • 20.
    Energy metabolism during30 s sprints mmol of ATP 1000 Lactate production PCr breakdown Aerobic metabolism 750 59% 500 21% 16% 15% 250 63% 26% 0 1 2 3 Sprint bout number From: Putman CT et al. Skeletal muscle pyruvate dehydrogenase activity during maximal exercise in humans. Am J Physiol 269:E458, 1995.
  • 21.
    Analysis of differentinterval training sessions • LT intervals: 2 x 20:00/5:00 • VO2max intervals: 6 x 5:00/2:30 • LT intervals: 8 x 5:00/1:00 • Anaerobic capacity intervals: 10 x 1:00/3:00
  • 22.
    LT intervals: 2x 20:00/5:00
  • 23.
  • 24.
    LT intervals: 8x 5:00/1:00
  • 25.