Wikipedia is a complex environment. The servers are in the United States, which does not include a "rule of the shorter term" making some works inadmissible even though they are in the public domain in India. There are any number of quirks in this largely perhaps outdated law.
Slides from talk on November 7 2016 at Regional Museum of Natural History Mysore as part of a two day meeting and exhibition on ‘Empire and Environmental Heritage of India’.
In 1849, Edward Balfour and others began to examine the role of forests in the water balance of southern India. A debate ensued and that led to the creation of the forest department and the idea of government forest conservation.
Geiger muller a thin end window tube radiation detectoreSAT Journals
Abstract After various nuclear accidents in different places like Mayapuri locality, Delhi in India (April 2010), San juan de Dios radiotherapy accident in Costa Rica (1996) etc. people are very concerned about their safety and health related issues like cancer, tumor and ultimately death as the radioactivity cannot be noticed by our five senses. To know how much radioactivity is there in a place we need a specific device, like the RADIATION SURVEY METER presented in the paper. It has been designed as economical, easy to use, and accurate for the non-technical public to keep at home or work place and monitors the radioactivity level in the area. This paper represents the use of a gas filled radiation detector, GM tube (Geiger Muller tube), which will sense the radioactivity, sense the gamma radiation, display its intensity and save the data in memory so that it can be further analyzed. The high DC voltages necessary to polarize GM tube (500 - 900 V) can be obtained from batteries or through boost converter with few and less expensive electronic components. The system has been designed using digital display technique using PIC microcontroller, LCD and keys. The system is also facilitated with USB interface. Keywords: Nuclear accidents, radioactivity, radiation survey meter, GM tube
Geiger–Müller Counter is a hand-held radiation survey instrument used in Radiation Dosimetry,Nuclear Physics,Experimental Physics & Radiological Protection.
gm counter .working principle of gm counter, construction, advantage and disadvantage of gm counter.
Scintillation counter, its history, solid and liquid scintillation, scintillation cocktail, photomultiplier tube, advantage, and disadvantage.
Why You Should Replace Windows 11 with Nitrux Linux 3.5.0 for enhanced perfor...SOFTTECHHUB
The choice of an operating system plays a pivotal role in shaping our computing experience. For decades, Microsoft's Windows has dominated the market, offering a familiar and widely adopted platform for personal and professional use. However, as technological advancements continue to push the boundaries of innovation, alternative operating systems have emerged, challenging the status quo and offering users a fresh perspective on computing.
One such alternative that has garnered significant attention and acclaim is Nitrux Linux 3.5.0, a sleek, powerful, and user-friendly Linux distribution that promises to redefine the way we interact with our devices. With its focus on performance, security, and customization, Nitrux Linux presents a compelling case for those seeking to break free from the constraints of proprietary software and embrace the freedom and flexibility of open-source computing.
LF Energy Webinar: Electrical Grid Modelling and Simulation Through PowSyBl -...DanBrown980551
Do you want to learn how to model and simulate an electrical network from scratch in under an hour?
Then welcome to this PowSyBl workshop, hosted by Rte, the French Transmission System Operator (TSO)!
During the webinar, you will discover the PowSyBl ecosystem as well as handle and study an electrical network through an interactive Python notebook.
PowSyBl is an open source project hosted by LF Energy, which offers a comprehensive set of features for electrical grid modelling and simulation. Among other advanced features, PowSyBl provides:
- A fully editable and extendable library for grid component modelling;
- Visualization tools to display your network;
- Grid simulation tools, such as power flows, security analyses (with or without remedial actions) and sensitivity analyses;
The framework is mostly written in Java, with a Python binding so that Python developers can access PowSyBl functionalities as well.
What you will learn during the webinar:
- For beginners: discover PowSyBl's functionalities through a quick general presentation and the notebook, without needing any expert coding skills;
- For advanced developers: master the skills to efficiently apply PowSyBl functionalities to your real-world scenarios.
Securing your Kubernetes cluster_ a step-by-step guide to success !KatiaHIMEUR1
Today, after several years of existence, an extremely active community and an ultra-dynamic ecosystem, Kubernetes has established itself as the de facto standard in container orchestration. Thanks to a wide range of managed services, it has never been so easy to set up a ready-to-use Kubernetes cluster.
However, this ease of use means that the subject of security in Kubernetes is often left for later, or even neglected. This exposes companies to significant risks.
In this talk, I'll show you step-by-step how to secure your Kubernetes cluster for greater peace of mind and reliability.
In his public lecture, Christian Timmerer provides insights into the fascinating history of video streaming, starting from its humble beginnings before YouTube to the groundbreaking technologies that now dominate platforms like Netflix and ORF ON. Timmerer also presents provocative contributions of his own that have significantly influenced the industry. He concludes by looking at future challenges and invites the audience to join in a discussion.
Enhancing Performance with Globus and the Science DMZGlobus
ESnet has led the way in helping national facilities—and many other institutions in the research community—configure Science DMZs and troubleshoot network issues to maximize data transfer performance. In this talk we will present a summary of approaches and tips for getting the most out of your network infrastructure using Globus Connect Server.
Pushing the limits of ePRTC: 100ns holdover for 100 daysAdtran
At WSTS 2024, Alon Stern explored the topic of parametric holdover and explained how recent research findings can be implemented in real-world PNT networks to achieve 100 nanoseconds of accuracy for up to 100 days.
zkStudyClub - Reef: Fast Succinct Non-Interactive Zero-Knowledge Regex ProofsAlex Pruden
This paper presents Reef, a system for generating publicly verifiable succinct non-interactive zero-knowledge proofs that a committed document matches or does not match a regular expression. We describe applications such as proving the strength of passwords, the provenance of email despite redactions, the validity of oblivious DNS queries, and the existence of mutations in DNA. Reef supports the Perl Compatible Regular Expression syntax, including wildcards, alternation, ranges, capture groups, Kleene star, negations, and lookarounds. Reef introduces a new type of automata, Skipping Alternating Finite Automata (SAFA), that skips irrelevant parts of a document when producing proofs without undermining soundness, and instantiates SAFA with a lookup argument. Our experimental evaluation confirms that Reef can generate proofs for documents with 32M characters; the proofs are small and cheap to verify (under a second).
Paper: https://eprint.iacr.org/2023/1886
Dev Dives: Train smarter, not harder – active learning and UiPath LLMs for do...UiPathCommunity
💥 Speed, accuracy, and scaling – discover the superpowers of GenAI in action with UiPath Document Understanding and Communications Mining™:
See how to accelerate model training and optimize model performance with active learning
Learn about the latest enhancements to out-of-the-box document processing – with little to no training required
Get an exclusive demo of the new family of UiPath LLMs – GenAI models specialized for processing different types of documents and messages
This is a hands-on session specifically designed for automation developers and AI enthusiasts seeking to enhance their knowledge in leveraging the latest intelligent document processing capabilities offered by UiPath.
Speakers:
👨🏫 Andras Palfi, Senior Product Manager, UiPath
👩🏫 Lenka Dulovicova, Product Program Manager, UiPath
Elevating Tactical DDD Patterns Through Object CalisthenicsDorra BARTAGUIZ
After immersing yourself in the blue book and its red counterpart, attending DDD-focused conferences, and applying tactical patterns, you're left with a crucial question: How do I ensure my design is effective? Tactical patterns within Domain-Driven Design (DDD) serve as guiding principles for creating clear and manageable domain models. However, achieving success with these patterns requires additional guidance. Interestingly, we've observed that a set of constraints initially designed for training purposes remarkably aligns with effective pattern implementation, offering a more ‘mechanical’ approach. Let's explore together how Object Calisthenics can elevate the design of your tactical DDD patterns, offering concrete help for those venturing into DDD for the first time!
State of ICS and IoT Cyber Threat Landscape Report 2024 previewPrayukth K V
The IoT and OT threat landscape report has been prepared by the Threat Research Team at Sectrio using data from Sectrio, cyber threat intelligence farming facilities spread across over 85 cities around the world. In addition, Sectrio also runs AI-based advanced threat and payload engagement facilities that serve as sinks to attract and engage sophisticated threat actors, and newer malware including new variants and latent threats that are at an earlier stage of development.
The latest edition of the OT/ICS and IoT security Threat Landscape Report 2024 also covers:
State of global ICS asset and network exposure
Sectoral targets and attacks as well as the cost of ransom
Global APT activity, AI usage, actor and tactic profiles, and implications
Rise in volumes of AI-powered cyberattacks
Major cyber events in 2024
Malware and malicious payload trends
Cyberattack types and targets
Vulnerability exploit attempts on CVEs
Attacks on counties – USA
Expansion of bot farms – how, where, and why
In-depth analysis of the cyber threat landscape across North America, South America, Europe, APAC, and the Middle East
Why are attacks on smart factories rising?
Cyber risk predictions
Axis of attacks – Europe
Systemic attacks in the Middle East
Download the full report from here:
https://sectrio.com/resources/ot-threat-landscape-reports/sectrio-releases-ot-ics-and-iot-security-threat-landscape-report-2024/
A tale of scale & speed: How the US Navy is enabling software delivery from l...sonjaschweigert1
Rapid and secure feature delivery is a goal across every application team and every branch of the DoD. The Navy’s DevSecOps platform, Party Barge, has achieved:
- Reduction in onboarding time from 5 weeks to 1 day
- Improved developer experience and productivity through actionable findings and reduction of false positives
- Maintenance of superior security standards and inherent policy enforcement with Authorization to Operate (ATO)
Development teams can ship efficiently and ensure applications are cyber ready for Navy Authorizing Officials (AOs). In this webinar, Sigma Defense and Anchore will give attendees a look behind the scenes and demo secure pipeline automation and security artifacts that speed up application ATO and time to production.
We will cover:
- How to remove silos in DevSecOps
- How to build efficient development pipeline roles and component templates
- How to deliver security artifacts that matter for ATO’s (SBOMs, vulnerability reports, and policy evidence)
- How to streamline operations with automated policy checks on container images
PHP Frameworks: I want to break free (IPC Berlin 2024)Ralf Eggert
In this presentation, we examine the challenges and limitations of relying too heavily on PHP frameworks in web development. We discuss the history of PHP and its frameworks to understand how this dependence has evolved. The focus will be on providing concrete tips and strategies to reduce reliance on these frameworks, based on real-world examples and practical considerations. The goal is to equip developers with the skills and knowledge to create more flexible and future-proof web applications. We'll explore the importance of maintaining autonomy in a rapidly changing tech landscape and how to make informed decisions in PHP development.
This talk is aimed at encouraging a more independent approach to using PHP frameworks, moving towards a more flexible and future-proof approach to PHP development.
By Design, not by Accident - Agile Venture Bolzano 2024
Physics HL IRP
1. Kittitorn Kiatpipattanakun
Physics HL Period 6
How far is safe?
Following Japan’s tsunami, crisis broke out at Japan’s Fukushima Daiichi nuclear power
plant. The gamma radiation contaminated the areas around the plant, making it uninhabitable for
another several decades. Several authoritative sources ordered evacuations at certain distances to
the reactor, but the question is, how far is safe? In this research, the relationship between the
radiation intensity and its distance to the receiver will be investigated. For safety concerns, instead
of using a gamma ray emitter, a beta emitter will be substituted.
Before going into the theory, the way in which the radiation is detected must first be
understood. The Geiger counter, named after the Geiger-Marsden experiment or commonly known
as the gold foil experiment, is a type of particle detector that is use nowadays to measure radiation,
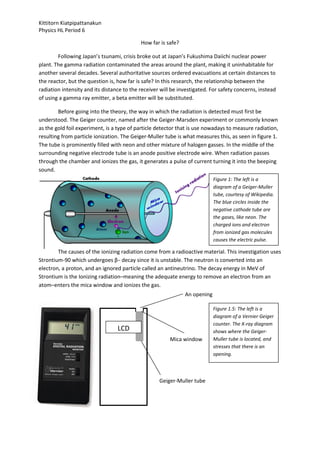
resulting from particle ionization. The Geiger-Muller tube is what measures this, as seen in figure 1.
The tube is prominently filled with neon and other mixture of halogen gasses. In the middle of the
surrounding negative electrode tube is an anode positive electrode wire. When radiation passes
through the chamber and ionizes the gas, it generates a pulse of current turning it into the beeping
sound.
Figure 1: The left is a
diagram of a Geiger-Muller
tube, courtesy of Wikipedia.
The blue circles inside the
negative cathode tube are
the gases, like neon. The
charged ions and electron
from ionized gas molecules
causes the electric pulse.
The causes of the ionizing radiation come from a radioactive material. This investigation uses
Strontium-90 which undergoes β− decay since it is unstable. The neutron is converted into an
electron, a proton, and an ignored particle called an antineutrino. The decay energy in MeV of
Strontium is the Ionizing radiation–meaning the adequate energy to remove an electron from an
atom–enters the mica window and ionizes the gas.
An opening
Figure 1.5: The left is a
diagram of a Vernier Geiger
counter. The X-ray diagram
LCD shows where the Geiger-
Mica window Muller tube is located, and
stresses that there is an
opening.
Geiger-Muller tube
2. Kittitorn Kiatpipattanakun
Physics HL Period 6
From several trusted sources, the relationship between the radiation intensity and distance
would have an inverse squared relationship showed in equation 1. The derivation to form this
equation can be found here.
Equation 1
Where is the radiation intensity in counts per minute, and is the distance between the plastic
cover of the beta material and the Geiger counter in centimeter. To show a linear relationship, the
equation 2 below is derived.
√ Equation 2
Thus, from equation 2, the square root of the radiation intensity is expected to increase linearly to
the inverse of distance.
Works cited:
http://imagine.gsfc.nasa.gov/YBA/M31-velocity/1overR2-more.html
http://www.lndinc.com/products/711/
http://www.scientrific.com.au/product.php?p=4015
http://www.nytimes.com/interactive/2011/03/16/world/asia/japan-nuclear-evaculation-zone.html
http://www.vernier.com/products/sensors/drm-btd/
3. Kittitorn Kiatpipattanakun
Physics HL Period 6
Design:
Research Question: How does the distance between the Geiger counter and the radioactive
material affects the intensity of the radiation.
Variables:
The independent variable is the distance between the Geiger counter’s sensor and the beta
material source emitter, the sufficiency of this measurement will further be explained after the
procedure writing. The dependent variable is the counts per unit time received by the Geiger
counter, which is the intensity of the radiation. The controlled variable is the type of beta source,
which is Strontium-90, its position is also controlled by not moving it at all in the investigation. The
same type of Geiger counter was used throughout, a Vernier Digital Radiation Monitor, with its
settings unchanged at CPM and audio on. The angle of the sensor to the beta source was
unchanged, only the distance to it was changed. The experiment was carried at the same place in
the corner of the room without moving anywhere else, so the background radiation was controlled
to be at about 4 ± 1 counts per 10 seconds or 24± 6 counts per minute (cpm), from table 1. The
temperature was controlled by turning on the air conditioner at 27± C without turning it off,
however, temperature would not be such an important factor that would affect the radiation.
Procedure:
A safe area where few people pass by is firstly found. A metal support stand with several
extension clamps is use to hold the Geiger counter. The counter’s sensor is face downward and the
LCD screen facing towards the experimenter. A ruler is attached to the metal stand, where at 0 cm,
the top end tip of the clamp screw is at 0 cm mark, and when the Geiger counter touches the beta
emitter. All of this can be seen in figure 2 down below. The Geiger counter is connected to the
computer, and to the Vernier™ Logger Pro program. Then a lead apron shield is setup between the
experimenter and the beta source so it reasonably protects the emitting radiation as seen in figure 3
below. A beta source, in this case, Strontium-90 is place directly perpendicular to the mica window,
where the beta particle enters the Geiger-Muller tube, as seen in figure 2. When ready, the radiation
counts were collected for a period of 180 seconds, at 10 seconds per one sample. This would give
out 18 samples, or can be said, 18 trials. Then for each 60 seconds, the graph is analyze with
statistics, the whole graph is also analyze with statistic to see the mean radiation counts per 10
second. This is repeated for several times for each distance away, the distances in this investigation
range from 0.0 ± 0.1 cm to 27.0 ± 0.1 cm.
4. Kittitorn Kiatpipattanakun
Physics HL Period 6
Figure 2: The left photo shows the
setup of the Geiger counter
perpendicular to the beta emitter.
The beta material is directly below a
circular opening in the Geiger
counter, where the beta particle will
enter through this opening and into
the Geiger-Muller tube where it
would detect the beta, alpha, or
gamma radiation. The tape as seen
in the photo was purposely taped
after 19 cm where this would be the
highest distance from collecting the
beta material’s radiation counts.
Wire connecting to computer
Tape at 19 cm
Figure 3: The above photo is the setup
for lead shielding, hanged by two
The position of the extension clamps from a meter stick.
detector’s opening The distance was about 25 ± 1 cm away
called the alpha between the lead shield and the beta
window, or the emitter.
mica window
5. Kittitorn Kiatpipattanakun
Physics HL Period 6
Data Collecting and Processing:
Beta material: Strontium-90 0.1 µC beta source
Instrument: Vernier Radiation Digital Monitor; LND 712 halogen-quenched GM tubed
Diameter of beta material’s plastic cover: 2.0 ± 0.1 cm
Table of raw data and its average
Seconds 0-60 61-121 121-180
Measured Average counts
Distance ± Raw Radiation Counts for each time interval per 10 second
0.1 cm
0.0 742 716 750 736 ± 20
1.0 280 288 285 285 ± 4
2.0 139 144 143 142 ± 3
3.0 77 76 77 77 ± 1
4.0 51 55 48 51 ± 4
5.0 42 41 35 39 ± 7
6.0 29 28 26 28 ± 2
7.0 22 20 19 20 ± 2
9.0 13 16 15 15 ± 2
11.0 9 8 11 9±2
13.0 9 8 10 9±1
15.0 8 7 8 8±1
17.0 7 6 6 6±1
19.0 5 5 6 6±1
27.0 4 4 3 4±1
Table 1: This table shows the selected raw data collected. The selected data are from taking the radiation count
for every 20 seconds, instead of 10.Since the mean would be the same nevertheless. The raw radiation count is
the number of counts per 10 seconds. The distance is between the plastic cover of the beta material and the
plastic surrounding of the Geiger counter, which leaves some distances to the mica window where the beta
particle enters. The last distance (27.0±0.1cm) is the background radiation. Sample calculations will be shown.
Graph 1: This is a sample raw data graph at 1.0±0.1 cm distances apart, where the statistic is analyzed.
6. Kittitorn Kiatpipattanakun
Physics HL Period 6
Table of actual distance and the average CPM
Measured distance (± 0.1 cm) Real Distance (± 0.5 cm) Average counts per minute (CPM)
0.0 1.5 4400 ± 100
1.0 2.5 1680 ± 20
2.0 3.5 840 ± 20
3.0 4.5 438 ± 6
4.0 5.5 280 ± 20
5.0 6.5 210 ± 40
6.0 7.5 140 ± 10
7.0 8.5 100 ± 10
9.0 10.5 70 ± 10
11.0 12.5 30 ± 10
13.0 14.5 30 ± 6
15.0 16.5 24 ± 6
17.0 18.5 12 ± 6
19.0 20.5 12 ± 6
Table 2: This table shows the actual distance between the approximated position of the beta material inside
the plastic cover, and the approximated distance inside the Geiger-Muller tube to where the gas actually
ionizes to create an electrical pulse. This will be extensively explained and discuss later in the evaluation
section. The second column is the actual average counts per minute, where it is subtracted by the background
radiation of 24 counts per minute. Sample calculations will be shown after graph 4.
Graph 2: This graph shows the inverse square relationship between the average counts per minute and the real
distance between the Geiger counter and the beta material. The constant ‘A’ is about 9900 ± 80.
7. Kittitorn Kiatpipattanakun
Physics HL Period 6
Table of the square root CPM and its inverse actual distance
Measured distance (± 0.1 Square root Average CPM
1 / real distance (± 0.01 cm)
cm) (CPM)
0.0 0.67 66.2 ± 0.8
1.0 0.40 41.0 ± 0.3
2.0 0.29 29.0 ± 0.3
3.0 0.22 20.9 ± 0.1
4.0 0.18 16.8 ± 0.7
5.0 0.15 15.0 ± 1.0
6.0 0.13 12.0 ± 0.5
7.0 0.12 9.8 ± 0.6
9.0 0.10 8.1 ± 0.7
11.0 0.08 6.0 ± 1.0
13.0 0.07 5.5 ± 0.6
15.0 0.06 4.9 ± 0.6
17.0 0.05 3.5 ± 0.9
19.0 0.05 3.5 ± 0.9
Table 3: This graph shows the square root of the counts per minute to the inverse actual distance, mainly to
show a linearly relationship. The uncertainty for the square root of CPM is individually calculated. A sample
calculation will be shown after graph 4.
Graph 3: This graph shows the data from table 3, where the highest square root counts per minute is the 0
distance between the Geiger counter and the beta material. The slope is 103 and the y-intercept is -1.77.
However, it is invalid when the inverse of a distance of 0 is calculated, and the square root of counts per minute
cannot be less than 0 to a negative number.
8. Kittitorn Kiatpipattanakun
Physics HL Period 6
Graph 4: This graph shows the high-low fit of graph 3. The sample calculation will be shown below.
Sample Calculations
1. Determining uncertainty for average counts per 10 second for 0.0±0.1 cm distance
a. Highest: 750; Lowest: 716
b. (750 – 716)/2 = 17 = rounded to 20, Thus, 736 ± 20 counts per 10 seconds
2. Real distance (explain in evaluation section)
a. Approximated distance of actual beta material (Strontium-90) to the plastic cover’s
skin: 0.2 cm
b. Approximated distance of the actual ionized gas position in the Geiger-Muller tube
to the opening of the tube 1.3 cm
c. Total distance apart = 1.3 + 0.2 = 1.5 cm
d. Real distance at 0 cm = 0 + 1.5 = 1.5 cm
3. Average counts per minute
a. Average counts per 10 seconds: 736 ± 20
b. Average counts per minute to significant figures = (736 ± 20) * 6 = 4400 ± 100
4. Square root of average CPM for distance of 0.0 ± 0.1 cm
a. √
b. Uncertainty: (√ -√ )/2 = 0.75 = 0.8
c. Square root average CPM = cm
5. Uncertainty for inverse real distance at measured distance 5.0 ± 0.1 cm
a. Real distance: 6.5 ± 0.5 cm
b. Uncertainty: ( )/2 = 0.011 = 0.01
c. Inverse real distance = 1/6.5 = 0.15 ± 0.01 cm
6. Uncertainty for slope and y-intercept from graph 4
a. Slope & intercept from graph 3 respectively: 103 , -1.77
b. Slope: (109.1 – 95.0) / 2 = 14 = ± 10
c. y-intercept: (1.6 + 4.1) / 2 = 2.9 = ± 3
9. Kittitorn Kiatpipattanakun
Physics HL Period 6
Conclusion:
From graph 2, it is clear that the results have support the hypothesis, in which it turned out
to be an inverse square relationship. But to model this investigation’s results to be a linear
relationship, the final equation is found, with respect to significant figures:
√ Equation 3
Where is the radiation intensity without the background radiation in counts per minute, and is
the distance apart from the beta source to the detector’s opening. Equation 3 is a linear equation
where when the higher the distances apart, the square root radiation intensity decreases.
The level of confidence in this investigation is medium. The qualities of the data as seen in
graph 2, the average CPM’s error bar is relatively acceptable, and the real distance error’s bar is 0.5
cm. The real distance is hard to determine because the exact position to where the beta material
really is inside the plastic cover is not stated, we must assume it ourselves. Also, the exact point in
the Geiger-Muller tube, where the radiation ionizes, is very hard to determine. Since the tube is
about three centimeters, the reaction can occur anywhere. It is assumed that most of the radiation
entering the tube starts reacting in the first half section. Further explanation of this will be discuss in
the evaluation. The validity of this relationship shown in equation 1 can be applicable universally.
Any type of radiation whether it’s REMS or the sun’s intensity can be used with equation 1.
However, equation 3 will only be applicable to this investigation only, since the distance will also
depend on the materials and instruments given. The setting experiment of this research may also
limit the equation 3. Nevertheless, further research must be done to confirm this relationship.
Evaluation:
One of the main causes of error in this experiment is determining the actual distance. The
actual distance between the beta material and the plastic cover skin is unknown, but it is
approximated to be 2 mm since the height of the plastic is 5 mm and the beta material assume to
have 1 mm thickness.
Distance between beta material and skin
of the plastic cover
Beta material Figure 4.1: Sr-90 sample as beta source
The other approximated value is where the radiation actually ionizes the gas in the Geiger-Muller
tube to generate an electrical pulse. So it is assumed that most of the reaction would occur about 1
cm inside from the mica window.
Approximated distance where most
reaction occur (about 1 centimeter)
Figure 4.2: LND 712 Neon filled Geiger-Muller tube
From all of these approximations, the data may be distorted from actual values. Some ways to
resolve this issue is to directly contact the material supplier and ask for specific dimension. For the
10. Kittitorn Kiatpipattanakun
Physics HL Period 6
Geiger-Muller tube, a shorter and more precise instrument may be implemented if possible to find
one.
The second cause of error may have come from the Geiger counter itself, which can be seen
in graph 1, the raw data. The standard deviation is up to 16 counts per 10 seconds. Even though the
Vernier Geiger counter is rated 1000 counts per minute for Cesium 137 laboratory standard,
different detectors should be considered to confirm the validity.
The last source of error that may affect the distance is the clamp. During the data collection,
the extension clamp might slip by about a millimeter. Since the arm is protected with a fabric like
texture. Moreover, the extension arms might bend a tiny bit due to the weight of the Geiger
counter. To fix this, a pulley mechanism should be considered, or using some kind of height
adjustment bar that have a height lock. In any method, the counter should have a fixed position
where it will not slip.