3. Photographs Rubric
The core elements of performance required by this task are:
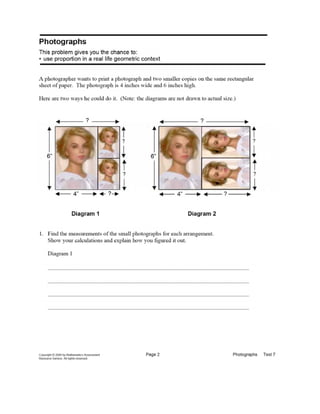
• use proportion in a real life geometric context
Based on these, credit for specific aspects of performance should be assigned as follows points
section
points
1. Diagram 1:
The height of the smaller copy = 1/2 of 6 inches = 3 inches
Uses proportional reasoning correctly:
Height/width = 6/4 = 3/width or Size of photo/Size of copy = 6/3 = 4/width
Width = 2 inches
Accept verbal reference to scaling if answer correct.
Diagram 2:
The width of the smaller copy = 1/2 of 6 inches = 3 inches
Uses proportional reasoning correctly:
Height/width = 6/4 = height/3
Height = 4 1/2 inches
Accept verbal reference to scaling if answer correct.
1
1
1
1
1
1
6
2. Gives correct answers:
Diagram 1: 6 inches wide, 6 inches high
Diagram 2: 8.5 inches wide, 6 inches high
1
1
2
Total Points 8
4. Grade Seven – 2006
(c) Noyce Foundation 2006. To reproduce this document, permission must be granted by the Noyce Foundation:
info@noycefdn.org.
27
7th
Grade – Task 2: Photographs
Work the task and examine the rubric. Can you find 2 or more ways to solve for the
height in diagram 2?
What do you think are the key mathematics the task is trying to assess?
Look at student work for diagram 1.
How many of your students:
Used a
proportion to find
the width of 2”
Used a scale
factor to find the
width of 2”
Assumed the width
was 6 “by looking”,
so 4 + 2= 6
Found a width
other than 2”
• What experiences have students had with enlarging and shrinking shapes? Have
they made their own enlargements or answered questions looking at diagrams?
How are these experiences different?
• Have your students discussed “not drawn to scale” explicitly? Do you think
they understand what this means?
• How could you design an activity that would show students why you can’t tell
“just by looking”?
Look at student work for diagram 2. How many of your students thought the height
was:
4.5 4 5 3 Other
• Do you think your students understood the corresponding sides between the
large and small diagrams?
• What are some of the false assumptions your students made?
• What experiences do students need to help them connect procedures with
problem-solving? How can you help students learn in a way that the
information transfers to new situations or can be applied to solving problems?
5. Grade Seven – 2006
(c) Noyce Foundation 2006. To reproduce this document, permission must be granted by the Noyce Foundation:
info@noycefdn.org.
28
Looking at student work on Photographs:
Student A is able to think about the photographs as being proportional. The student can figure
out corresponding sides, set up appropriate proportions, and solve for the missing sides.
Student A
6. Grade Seven – 2006
(c) Noyce Foundation 2006. To reproduce this document, permission must be granted by the Noyce Foundation:
info@noycefdn.org.
29
Student A, continued
7. Grade Seven – 2006
(c) Noyce Foundation 2006. To reproduce this document, permission must be granted by the Noyce Foundation:
info@noycefdn.org.
30
Student B is able to use scale factors to solve the problem. For diagram 1, the student uses a
scale factor of 1/2. For diagram 2, the student uses a scale factor of 0.75. How might the student
have arrived at the scale factor of 0.75?
Student B
8. Grade Seven – 2006
(c) Noyce Foundation 2006. To reproduce this document, permission must be granted by the Noyce Foundation:
info@noycefdn.org.
31
Student C also uses scale factors to solve for the missing dimensions. How are the three
strategies related? What is similar? What is different?
Student C
9. Grade Seven – 2006
(c) Noyce Foundation 2006. To reproduce this document, permission must be granted by the Noyce Foundation:
info@noycefdn.org.
32
Student D is able to think about the proportional relationship to solve for diagram 1. However in
diagram 2, the student doesn’t understand the corresponding parts. The 3” no longer relates to
the height of the original photo, but now relates to the width. How can students develop an
understanding of corresponding sides?
Student D
10. Grade Seven – 2006
(c) Noyce Foundation 2006. To reproduce this document, permission must be granted by the Noyce Foundation:
info@noycefdn.org.
33
Student E seems to use visual thinking and estimation to find the width for diagram 1. The
student tries to use proportional reasoning in diagram 2, but misses the concept of corresponding
sides.
Student E
11. Grade Seven – 2006
(c) Noyce Foundation 2006. To reproduce this document, permission must be granted by the Noyce Foundation:
info@noycefdn.org.
34
Student F also tries to use visual thinking and estimation to find the dimensions of the drawing.
The student does not seem to understand the idea of “not drawn to scale”. How can you set up
an experience to show students why just looking in incorrect or unreliable?
Student F
12. Grade Seven – 2006
(c) Noyce Foundation 2006. To reproduce this document, permission must be granted by the Noyce Foundation:
info@noycefdn.org.
35
Student G fills in numbers, but it is unclear where the numbers come from or what the students
assumptions were. Diagram 1 could have been solved using proportional reasoning or visual
estimation. What do you want in a good explanation? Why is just numbers insufficient?
Student G
13. Grade Seven – 2006
(c) Noyce Foundation 2006. To reproduce this document, permission must be granted by the Noyce Foundation:
info@noycefdn.org.
36
Student H has difficulty understanding and using diagrams. In both diagrams, the student uses
the partial distance of 4” on the bottom of the diagram for the full distance on the top. The
student also tries to use area to find the missing dimensions. Why do proportional figures have
different areas? How could students see this idea visually?
Student H
14. Grade Seven – 2006
(c) Noyce Foundation 2006. To reproduce this document, permission must be granted by the Noyce Foundation:
info@noycefdn.org.
37
Seventh Grade
7th
Grade Task 2 Photographs
Student Task Reason about geometric relationships in a diagram. Use proportions to
find missing dimensions of a photograph.
Core Idea 1
Number and
Operations
• Develop, analyze and explain methods for solving problems
involving proportional reasoning, such as scaling and finding
equivalent ratios.
Core Idea 4
Geometry
and
Measurement
• Understand relationships among the angles, side lengths,
perimeters, and areas of similar objects.
• Develop and critique inductive and deductive arguments
concerning geometric ideas and relationships, such as
congruence and similarity.
• Solve problems involving similarity and scale factors, using
proportional reasoning
Based on teacher observations, this is what seventh graders knew and were able to do:
• Find the vertical dimensions of the photographs.
• Add their dimensions together to find the size of the paper.
Areas of difficulty for seventh graders:
• Using proportional reasoning or scale factor to find the horizontal dimensions
• Understanding corresponding parts in proportional figures
• Understanding “not drawn to scale” or why visual estimation is not acceptable
Strategies used by successful students:
• Setting up and solving proportions
• Using scale factors (multiplicative thinking)
15. Grade Seven – 2006
(c) Noyce Foundation 2006. To reproduce this document, permission must be granted by the Noyce Foundation:
info@noycefdn.org.
38
The maximum score available for this task is 8 points.
The minimum score for a level 3 response, meeting standard, is 3 points.
Most students, about 83%, could find the height photograph in diagram 1and the width of the
photograph in diagram 2. Many students, 74%, could also find the size of the paper for diagram 1.
More than half the students, 61% could find the base and height for the photograph in diagram 1,
width of the diagram 2, and the size of the paper. Only 19% could use of proportional thinking,
either using proportions or scale factor, to explain how they found the second dimension in either
diagram. Less than 5% of the students could meet all the demands of the task. More than 10% of
the students scored no points on this task. 90% of the students with this score attempted the task.
16. Grade Seven – 2006
(c) Noyce Foundation 2006. To reproduce this document, permission must be granted by the Noyce Foundation:
info@noycefdn.org.
39
Photographs
Points Understandings Misunderstandings
0 90% of the students with this
score attempted the task.
7% of the students thought the height in
diagram 1 was 2 inches. 7% thought the
width of diagram 1 was 1”.
2 Students knew that the height of
diagram 1 and width of diagram
2 was 3 inches. They could
understand the smaller photos
were half of the 6 inches of the
larger photo.
Many students assumed the first photo was
a square to find the missing dimension or
that if 3 was half of 6, then 4 + 4 =8 for the
height in diagram 2.
3 Students could also add the
missing dimensions in diagram 1
to find the size of the piece of
paper.
4 Students knew that the height of
diagram 1 and width of diagram
2 was 3 inches. Students could
find the size of the paper in
diagram 1. Students could find
the missing width for diagram 1.
By assuming the paper to be a square,
students could get the dimension without
using proportional reasoning. Students did
not have the concept of “not drawn to
scale”.
5 Students could use proportional
reasoning to find the missing
dimensions for diagram 1.
In trying to use this logic to solve the for
missing height in diagram 2, students failed
to match corresponding sides.
8 Students could use proportions
or scale factors to find missing
dimensions of similar figures.
Students could interpret
diagrams to find the dimensions
of the full sheets of paper.
17. Grade Seven – 2006
(c) Noyce Foundation 2006. To reproduce this document, permission must be granted by the Noyce Foundation:
info@noycefdn.org.
40
Implications for Instruction
Students at this grade level need to transition from additive thinking to multiplicative thinking or
proportional reasoning. Having students work with scale factor, enlarging and decreasing similar
figures, is a practical way to help students understand this process. Many textbooks use examples
with a scale factor of two, which means that addition or multiplication will yield the same answer.
Students need to see examples with a variety of scale factors, including decreasing sizes to see the
multiplicative relationship. Too often students work with figures in textbooks with the same
orientation. This way they don’t have to think about which sides correspond. They need to work
with figures in a variety of orientations, so they can see the importance of matching the similar
sides.
Having students build similar figures with pattern blocks can give them a sense of similarity and
scale factor and allows them to compare dimensions as well as area. Using dot paper to increase
figures proportionally also allows them to see the changes in dimensions, as well as work concretely
with scale and measurement. The attention to detail needed for enlarging a figure, also works on
spatial visualization skills, requiring students to pay close attention to many properties of the figure
to avoid distortion. Drawing a simply figure on a coordinate graph and seeing how adding distorts
the figure, versus multiplying enlarges the figures while maintaining the integrity of the figure. Pose
the questions in ways that give students opportunities to investigate these relationships and reach the
generalization for themselves.
Some math designers make figures that are optical illusions to give students a chance to confront the
idea of why “just looking” is not good enough. How could you use this idea to design a lesson on
proportionality or “not drawn to scale”?