4. Seventh Grade – 2003 pg. 51
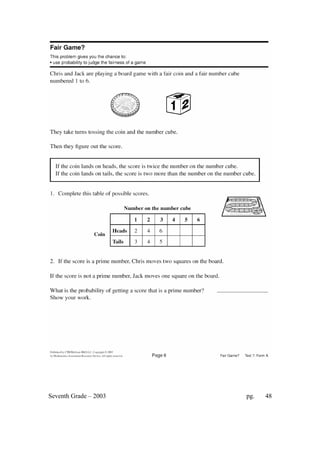
Fair Game
California State Standards and Textbooks expect mastery of probability in 6th
grade
and retention of those skills to last until the high school exit exam. However, results
show that many students need more than one year to learn this concept.
Student A shows a nice job of listing all the outcomes in the sample space and clearly
defining the prime numbers in part 2. Student A also shows facility with multiplying
fractions and applying the rules of the game in part 3. The student does a good job of
explaining the relationship between the rules for spaces moved and the differing
probabilities to make the game fair.
Student A
(c) Noyce Foundation 2012
5. Seventh Grade – 2003 pg. 52
Student B also demonstrates a complete knowledge of probability. The only error in
her thinking is to forget that 2 is a prime number in part 2 of the task. This error in
finding probability affects further calculations.
Student B
(c) Noyce Foundation 2012
6. Seventh Grade – 2003 pg. 53
More than 1/3 of the students looked at only the numbers on the number cube when
calculating probabilities instead of the outcomes. Depending on whether they
included 2 as a prime number their probabilities were either 50% or 4/6. Few of these
students related their incorrect probabilities to the rules of the game and calculations
for Chris and Jack in part 3 of the task. See the work of Student C.
Student C
Teacher Notes:
(c) Noyce Foundation 2012
7. Seventh Grade – 2003 pg. 54
Grade 7 – Fair Game?
Score: 0 1 2 3 4 5 6 7 8
% < = 9.6% 12.9% 14.4% 67.6% 80.1% 86.8% 92.0% 93.6% 100.0%
% > = 100.0% 90.4% 87.1% 85.6% 32.4% 19.9% 19.9% 8.0% 6.4%
The maximum score available for this task is 8 points.
The cut score for a level 3 response is 4 points.
Many students (about 85%) could apply the two different rules to fill out the table of
outcomes. Less than 20% could find the number of primes and correctly calculate the
probability for getting a prime. Less than 10% of the students could meet all the
demands of the task. 10% of the students scored no points on this task. 5% of the
students appeared to have run out of time, because there is no work on task 4 or task
5.
Fair Game?
Mean, 3.43, S.D.: 1.88
0
1000
2000
3000
4000
5000
6000
7000
Score
Frequency
Frequency 1129 380 178 6234 1458 786 611 186 753
0 1 2 3 4 5 6 7 8
(c) Noyce Foundation 2012
8. Seventh Grade – 2003 pg. 55
Fair Game?
Points Understandings Misunderstandings
0 About half the students with
this score attempted the
problem. The other half
appear to have run out of
time.
Students with this score did not read
the rules carefully for getting heads
and tails. Many just made a pattern of
even numbers and odd numbers or
going up one every time.
1 Students could get the table
right for heads.
Students did not understand the rules
for changing the number of the cube
is a tails was tossed.
3 Students could fill out the
table correctly.
About 22% of the students calculated
the probability of based on the
numbers on the cube instead of the
numbers in the table. Most also
forgot that 2 was a prime number, so
their probability was 1/2 or 50%.
Another 14% used the table but forgot
to count 2 as a prime number and
therefore had 1/4 or 3/12 as their
probability. 14% of the students wrote
probabilities as whole numbers.
4 Students could fill out the table and explain why the game is fair in
part 4.
5 Students could fill out the
table and show correct
thinking for finding the
probability in part 2.
Students could not use their
probabilities (right or wrong) to find
theoretical probabilities and then
correctly apply the rules for moving
to determine the outcome of the
game. There was not a consistent
pattern for these errors. In some cases
the students just added two to one
persons score, doubled both scores,
thought the total moves should be 12,
or other strategies.
8 Students could fill out the table using different rules for heads and
tails, find the probability of getting a prime number, and find the
theoretical probability of each student moving in 12 turns and apply
the different rules for their movement. Students could clearly explain
why the game was fair even though the 2 players had different
probabilities for getting to move.
(c) Noyce Foundation 2012
9. Seventh Grade – 2003 pg. 56
Based on teacher observations, this is what seventh grade students seemed to know
and be able to do:
• Follow rules to fill out a table
Areas of difficulty for seventh graders, seventh grade students struggled with:
• Identifying 2 as a prime number
• Calculating probabilities from a given set of outcomes or recognizing the
difference between the random number generators and the outcomes (many
students thought things were 50-50 because there are two sides on a coin or
three of the 6 numbers on the cube are prime)
• Using probability to find expected outcomes in a game situation. Giving a
good mathematical argument for why a game is fair combining probabilities
and rules of the game
Questions for Reflection on Fair Game?
Look carefully at student work, how many of your students could:
Fill out the table?
How many gave the probability in part 2 as:
1/3 1/5 1/4 4/6 Whole
numbers
Other?
Did your students have trouble multiplying the fractions to find the expected moves in
part 3? Did they apply the rules for how students moved correctly?
What kind of program does your school have in place for students who do not master
probability as 6th
graders? Have you discussed this issue at department meetings? Do
other teachers know the importance of this topic on the high school exit exam?
What types of probability activities have students had this year? What are some of
your favorite activities that might help students who are still struggling with
probability?
Teacher Notes:
(c) Noyce Foundation 2012
10. Seventh Grade – 2003 pg. 57
Instructional Implications:
Students need more experiences with games and probability. Students do not know
how to combine two events, like tossing a coin and a number cube, to find the
probability. They confuse the random number generators with the outcomes. While
students can complete tables showing what is possible, they have difficulty
determining how to answer questions based on that table. When it is possible to move
a different number of spaces for each player, they don’t know how to use that
information to determine who has a better chance of winning. Students do not
understand that probability or expected outcomes are determined by a large number of
events. To compare whether a game is fair, the outcomes of several games needs to
be considered. Students also needed to know mathematical vocabulary like prime
number, fair, and trial to work this problem successfully.
Teacher Notes:
(c) Noyce Foundation 2012