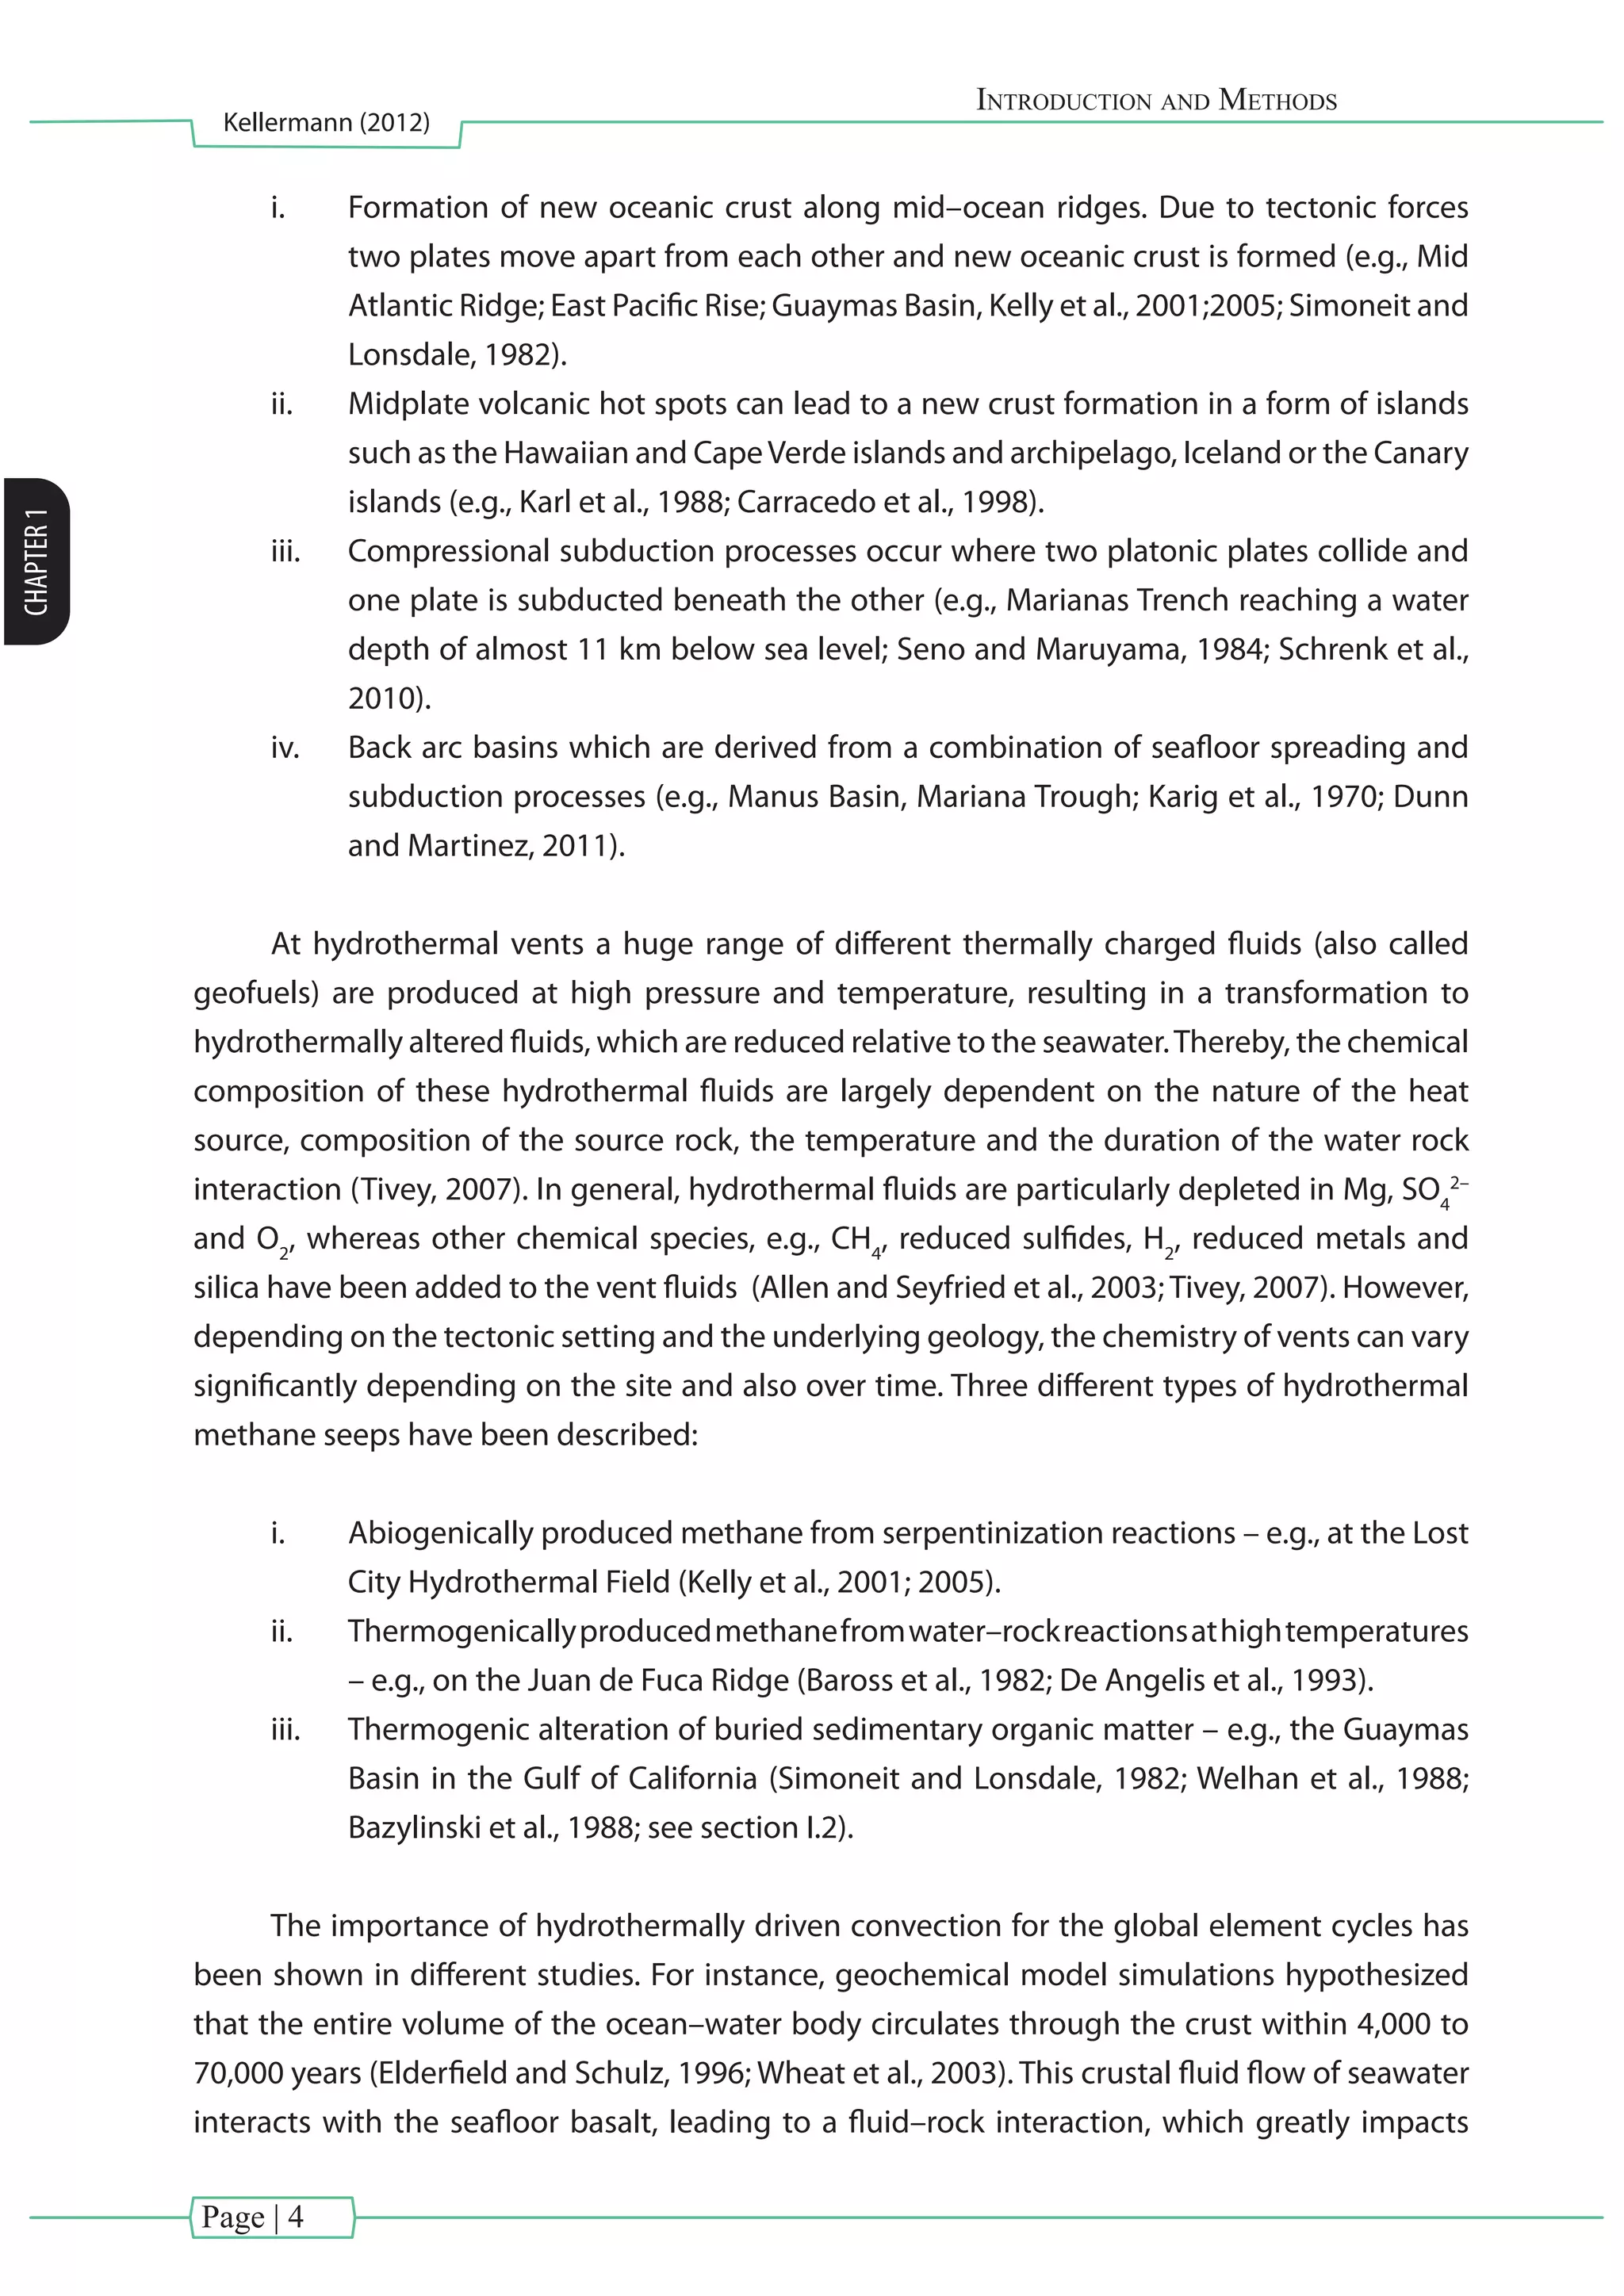
This dissertation uses lipid biomarkers and stable isotope probing to study microorganisms inhabiting cold and hot vent environments. Lipid biomarkers from chemosynthetic mussels and their symbionts from seep and vent sites confirmed the presence of aerobic methanotrophic and thiotrophic bacteria living symbiotically within the gills. Isotopic compositions of lipids from the mussels and symbionts highlighted the importance of chemosynthesis. Dual stable isotope probing of archaea and bacteria from Guaymas Basin sediments performing anaerobic methane oxidation revealed autotrophic lipid production, in contrast to previous studies suggesting significant direct methane assimilation. Preparative separation of intact polar lipids from the archaea increased sensitivity of isotope labeling detection compared


![Introduction and Methods
Kellermann (2012)
CHAPTER1
Page | 1
[Chapter I] - Introduction and Methods](https://image.slidesharecdn.com/54c05e1e-ddfa-426e-bc0d-230967ccb1b0-160817130319/75/PhD-thesis_Matthias-Kellermann-21-2048.jpg)
![Page | 6
Introduction and Methods
Kellermann (2012)
CHAPTER1
I.1.2.2. Cold seeps
Shortly after the discovery of hydrothermal vents, a second type of chemosynthetic
seafloor environment was detected: cold seeps. Unlike hydrothermal vents, cold seeps
are characterized by the advection of fluids with temperatures only slightly above ambient
seawater (~4°C). The first cold seep system has been identified in the northern Gulf of Mexico
continental slope (Florida Escarpment; Paull et al., 1984). Nowadays, cold seeps are recognized
as a globally widespread feature, which can be found in either active continental margins such
as the Peruvian Margin (close proximity to plate boundaries; Kulm et al., 1986; Lallemand et
al., 1992) or passive continental margins such as the Gulf of Mexico (Paull et al., 1984; Hovland,
1992; Fig. I.3). Cold seeps have been found in shallow waters such as the costal zones of the
Eckernförde Bay (Anderson et al., 1998) or at Cape Lookout Bay (Martens and Val Klump, 1980)
but also in deep sea trenches in several thousand meters depth (Japan Trench; Kobayashi et al.,
1992).Their surface expression can range from centimeter to kilometers scale in diameter (Kopf
et al., 2002) and the type of cold seep surface feature (e.g., gas seeps, mud volcano, pockmarks
and brine/oil pools) may depend on the geological settings, the intensity of the fluid flow and
nature of the discharge (e.g., gas, fluid, mud).
Depending on the fluid source, the seep discharge can be loaded with hydrocarbons,
CO2
and H2
S. However, the most important fluid constituent is CH4
, exceeding 90% of the
total dissolved gases (Dimitrov, 2002; Kopf, 2002). In the following potential CH4
sources are
described:
i. Microbial methane production: biological methane production is performed
by microorganisms known as methanogens. Methanogenesis is the last step in
the anaerobic degradation of organic matter (cf. [BOX I]), where single-celled
methanogenic archaea utilize fermentative end products such as acetate and CO2
/
H2
to produce methane (e.g., Whiticar et al., 1986).
ii. Thermogenic methane production (deep thermogenic reservoirs): organic material
which escaped microbial degradation is subsequently converted by heat–induced
processes to heavy gaseous and liquid hydrocarbons at temperatures between 80-
120°C (early thermogenic gas formation) which ultimately are converted to CH4
at
temperatures between 150-200°C (late thermogenic gas formation; Claypool and
Kvenvolden, 1983).
iii. Abiogenic methane production: abiogenic methane formation is independent of
organic matter and also from microbial activity. Abiotic methane is predominantly
produced by diagenesis of fresh oceanic rocks, such as found in the Lost City
Hydrothermal vent fields from the Mid Atlantic Ridge (Rona et al., 1992; Kelley et
al., 2001; 2005). In these places, the heating of rock material to temperatures above
300°C releases, by serpentinization, hydrogen which can react with CO2
resulting in
abiogenic methane (Foustoukos and Seyfried, 2004). Production of abiogenic CH4](https://image.slidesharecdn.com/54c05e1e-ddfa-426e-bc0d-230967ccb1b0-160817130319/75/PhD-thesis_Matthias-Kellermann-26-2048.jpg)
![Page | 8
Introduction and Methods
Kellermann (2012)
CHAPTER1
et al., 1993) and has a major impact on Earth’s climate. However, the quantification of upward-
migrating methane from cold seeps into the atmosphere is difficult and thus up to date poorly
constrained (Solomon et al., 2009).
I.1.3. Chemosynthetic biomass production as driver of dark–ocean benthic habitats
In1977,thediscoveryofthehydrothermalventecosystems(GalapagosRift,PacificOcean)
based entirely on chemosynthesis communities changed the understanding of the limits of life
on Earth (Corliss et al., 1979; Jannasch and Mottl, 1985; Deming and Baross, 1993; Van Dover
et al., 2002; Bach et al., 2006). The first cold seep faunal assemblages were described in the
northern Gulf of Mexico (Kennicutt et al., 1985) and at subduction zones in the northwestern
Pacific (Suess et al., 1985). The metabolic strategies of microorganisms in the dark ocean differ
from the sunlight–dependent photosynthetic world (0 – 300 m depth), where metabolic energy
is gained from the coupling of redox reactions (see [BOX I]).
BOX I Electron donors and acceptors in the marine & dark oceanic environments
Incontrasttophotoautotrophiccarbonfixationwheretheenergycomesfromsunlight,chemosynthesis
is the process by which microorganisms harness the energy in chemical bonds to convert one-carbon
molecules (e.g., CO2
and or CH4
) into biomass. Chemosynthesis is carried out exclusively by Bacteria and
Archaea.
The activity of microorganisms in the sunlight-independent dark ocean depends on the availability of
electron donors (oxidizable compounds) and acceptors (reducible compounds). Within typical marine
sediments, a well–known cascade of preferred electron donors and acceptors is observed (Froehlich
et al., 1979). The major electron donors in the dark oceans are organic matter, hydrogen (H2
), methane
(CH4
), reduced sulfur, iron and manganese compounds.
These electron sources differ in significance for
microbial metabolism, since they have differences in
abundance and energy potential. On the other hand,
the major electron acceptors can be characterized
by the order of highest electron accepting potential,
starting with O2
, NO2
–
, NO3
–
, Mn and Fe oxides, oxidized
sulfur compounds (e.g., SO4
2–
), and finally CO2
(Fig. I.4;
Froehlich et al., 1979).
In marine sediments the majority of the organic
matter degradation is coupled to sulfate reduction.
Since SO4
2-
exists in almost unlimited quantities in
seawater and oxygen is quickly consumed by aerobic
respiration, SO4
2-
is consequently the most important
electron acceptor in marine sediments (Jørgensen,
1982).
Fig. I.4. Schematic representation of the broad range
of redox–active compounds in marine environments
and the names describing the respiration process.
The order of electron acceptors utilization is based on
the thermodynamic potential of the process and the
energy available to the organisms. The most important
electron acceptors/respiration processes dealt with in
this dissertation are highlighted in red. Figure has been
modified from Canfield and Thamdrup (2009).
O2
Electron
acceptor
Respiration
process
Oxic/aerobic
respiration
Nitrate
reduction
Manganese
reduction
Iron
reduction
Sulfate
reduction
Methano-
genesis
NO2
-
NO3
-
MnO2
FeOOH
SO4
2-
CO2
Sedimentdepth](https://image.slidesharecdn.com/54c05e1e-ddfa-426e-bc0d-230967ccb1b0-160817130319/75/PhD-thesis_Matthias-Kellermann-28-2048.jpg)
![Introduction and Methods
Kellermann (2012)
CHAPTER1
Page | 9
The primary producers living in these extreme environments are microorganisms that
live either as chemolithoautotrophs using inorganic chemicals as electron donor and CO2
as
carbon source, or chemoorganoheterotrophs consuming CH4
as both electron donor and
carbon source. However, microorganisms can only gain the chemical energy if the reaction is
thermodynamically favorable. This is the case when the electron–donor rich fluids encounter
cold seawater, rich in electron–acceptors. Hereby, chemotrophic organisms gain their energy
by oxidizing reduced elements of the vent/seep fluids such as H2
, CH4
, H2
S, NH3
, Fe(II), Mn2+
,
with available oxidants supplied by the seawater such as CO2
, SO4
2–
, S, Fe(III), NO3
–
or O2
(see
[BOX I]). The presence of chemosynthetic communities at the seafloor is thus indicative of
near-surface methane and/or sulfide discharge (Fig. I.2). However, the redox processes at these
extreme environments depend indirectly also on sunlight. For example, the vast fraction of CH4
discharged at cold and hot seeps is most often derived from the decay of organic matter, which
was originally derived from photosynthesis. In addition, the electron–acceptors for primary
production (e.g., O2
, SO4
2-
and NO3
-
) derived from seawater have been ultimately oxidized by
photosynthesis.
The simultaneous appearance of electron–donor and electron–acceptor rich fluids at the
seafloor of both hot and cold seeps is the cause of a massive accumulation of symbiotic and free
livingmicrofauna(Fig.I.2).Infact,CH4
-fuelledmicrobialcommunitieshavebeenshowntoharbor
the largest amounts of biomass of all marine ecosystems (up to 1012
cells per cm3
; Michaelis et
al., 2002; Treude et al., 2007). A symbiotic association of chemotrophic microorganisms with
invertebrates is probably one of the most characteristic features occurring at cold seeps and
hydrothermal vents. For example, bivalves and clams are known to host symbionts in their gills
(see [BOX II]; e.g., Fisher et al., 1993; Distel et al., 1995) and tubeworms rely on endosymbionts
in their trophosome (Cordes et al., 2005; Lösekann et al., 2008). However, methanotrophic
and thiotrophic symbionts have also been observed as free living microorganisms, without a
symbiotic partner such as the widespread and giant sulfur–oxidizing Gammaproteobacteria
Beggiatoa, Thiomargarita, and Thioploca (e.g., Jannasch et al., 1989; Sassen et al., 1993).
Due to elevated temperatures at hydrothermal vents, many record-holding extreme
microorganisms have been isolated from such environments. Those extremophiles are able to
tolerate extreme conditions such as high temperatures, hydrostatic pressure, toxic chemistry,
extreme pH, and permanent fluctuations of environmental conditions (Takai et al., 2006). For
example, a newly isolated, hyperthermophilic methanogen Methanopyrus kandleri strain has
been shown, to survive under laboratory conditions at high hydrostatic pressure (20 MPa)
and temperatures of up to 122°C (Takai et al., 2008). This temperature is the current upper
temperature limit of life under laboratory conditions; but further evidence suggests that this
limit of life might actually be closer to 150°C (Schrenk et al., 2003; Hoehler et al., 2007).](https://image.slidesharecdn.com/54c05e1e-ddfa-426e-bc0d-230967ccb1b0-160817130319/75/PhD-thesis_Matthias-Kellermann-29-2048.jpg)
![Page | 10
Introduction and Methods
Kellermann (2012)
CHAPTER1
BOX II Symbiotic chemosynthesis at cold seeps and hot vents
The term “symbiosis” has Greek roots; “sym” means with and “bio” means living. Symbiosis can be
defined as a close association between two different organisms. Up to now, at least seven animal phyla
(e.g., mussels, snails, worms, sponges and single–celled ciliates) are known to host chemosynthetic
symbiotic microorganisms. Chemosynthetic symbioses have been found at different habitats including
hydrothermal vents and cold seeps. Hereby, the symbionts provide the eukaryotic host nutrition, while
the host supplies the symbiotic bacteria with fluids, enriched in electron donors such as CH4
or H2
S and
electron acceptors such as O2
, by positioning themselves at the interface between reduced and oxidized
fluids (Petersen and Dubilier, 2010).
In general, Bathymodiolus spp. are known to dominate the biomass production at hydrothermal vents
and cold seeps (Fig. I.5a; Van Dover, 2000). These mussels have been found in association with sulfur–
oxidizing (Cavanaugh, 1983, Distel et al., 1988) and methane–oxidizing bacteria (Childress et al., 1986) and
specimens hosting both groups of these Gammaprotobacteria (Fisher et al., 1993; Distel et al., 1995). Just
recently, Petersen et al. (2011) found that the symbionts of the hydrothermal vent mussel Bathymodiolus
puteoserpentis recovered from the Mid–Atlantic Ridge can also use H2
as electron donor, extending the
number of substrates for chemosynthetic bacteria (Fig. I.5b). The symbionts can either be housed as
endosymbionts within specialized gill bacteriocytes (intra– or extracellularly) or ectosymbionts, which are
found to be attached to the outside surface of the host (Dubilier et al., 2008; Duperron et al., 2009). Many
host organisms known to harbor endosymbionts have shown reduced digestive systems and/or none
functional guts, highlighting the evolutionary adaption of a food web solely based on their symbionts
(Page et al., 1990; Colaço et al., 2006; Cavanaugh et al., 2006).
Siphon i - H2
+ O2
ii - H2
S + O2
iii - CH4
+ O2
Foot
Gills
Sulfide-
oxidizing
bacteria
I - H2
O
II - SO4
2-
III - CO2
Methane-
oxidizing
bacteria
(a) (b)
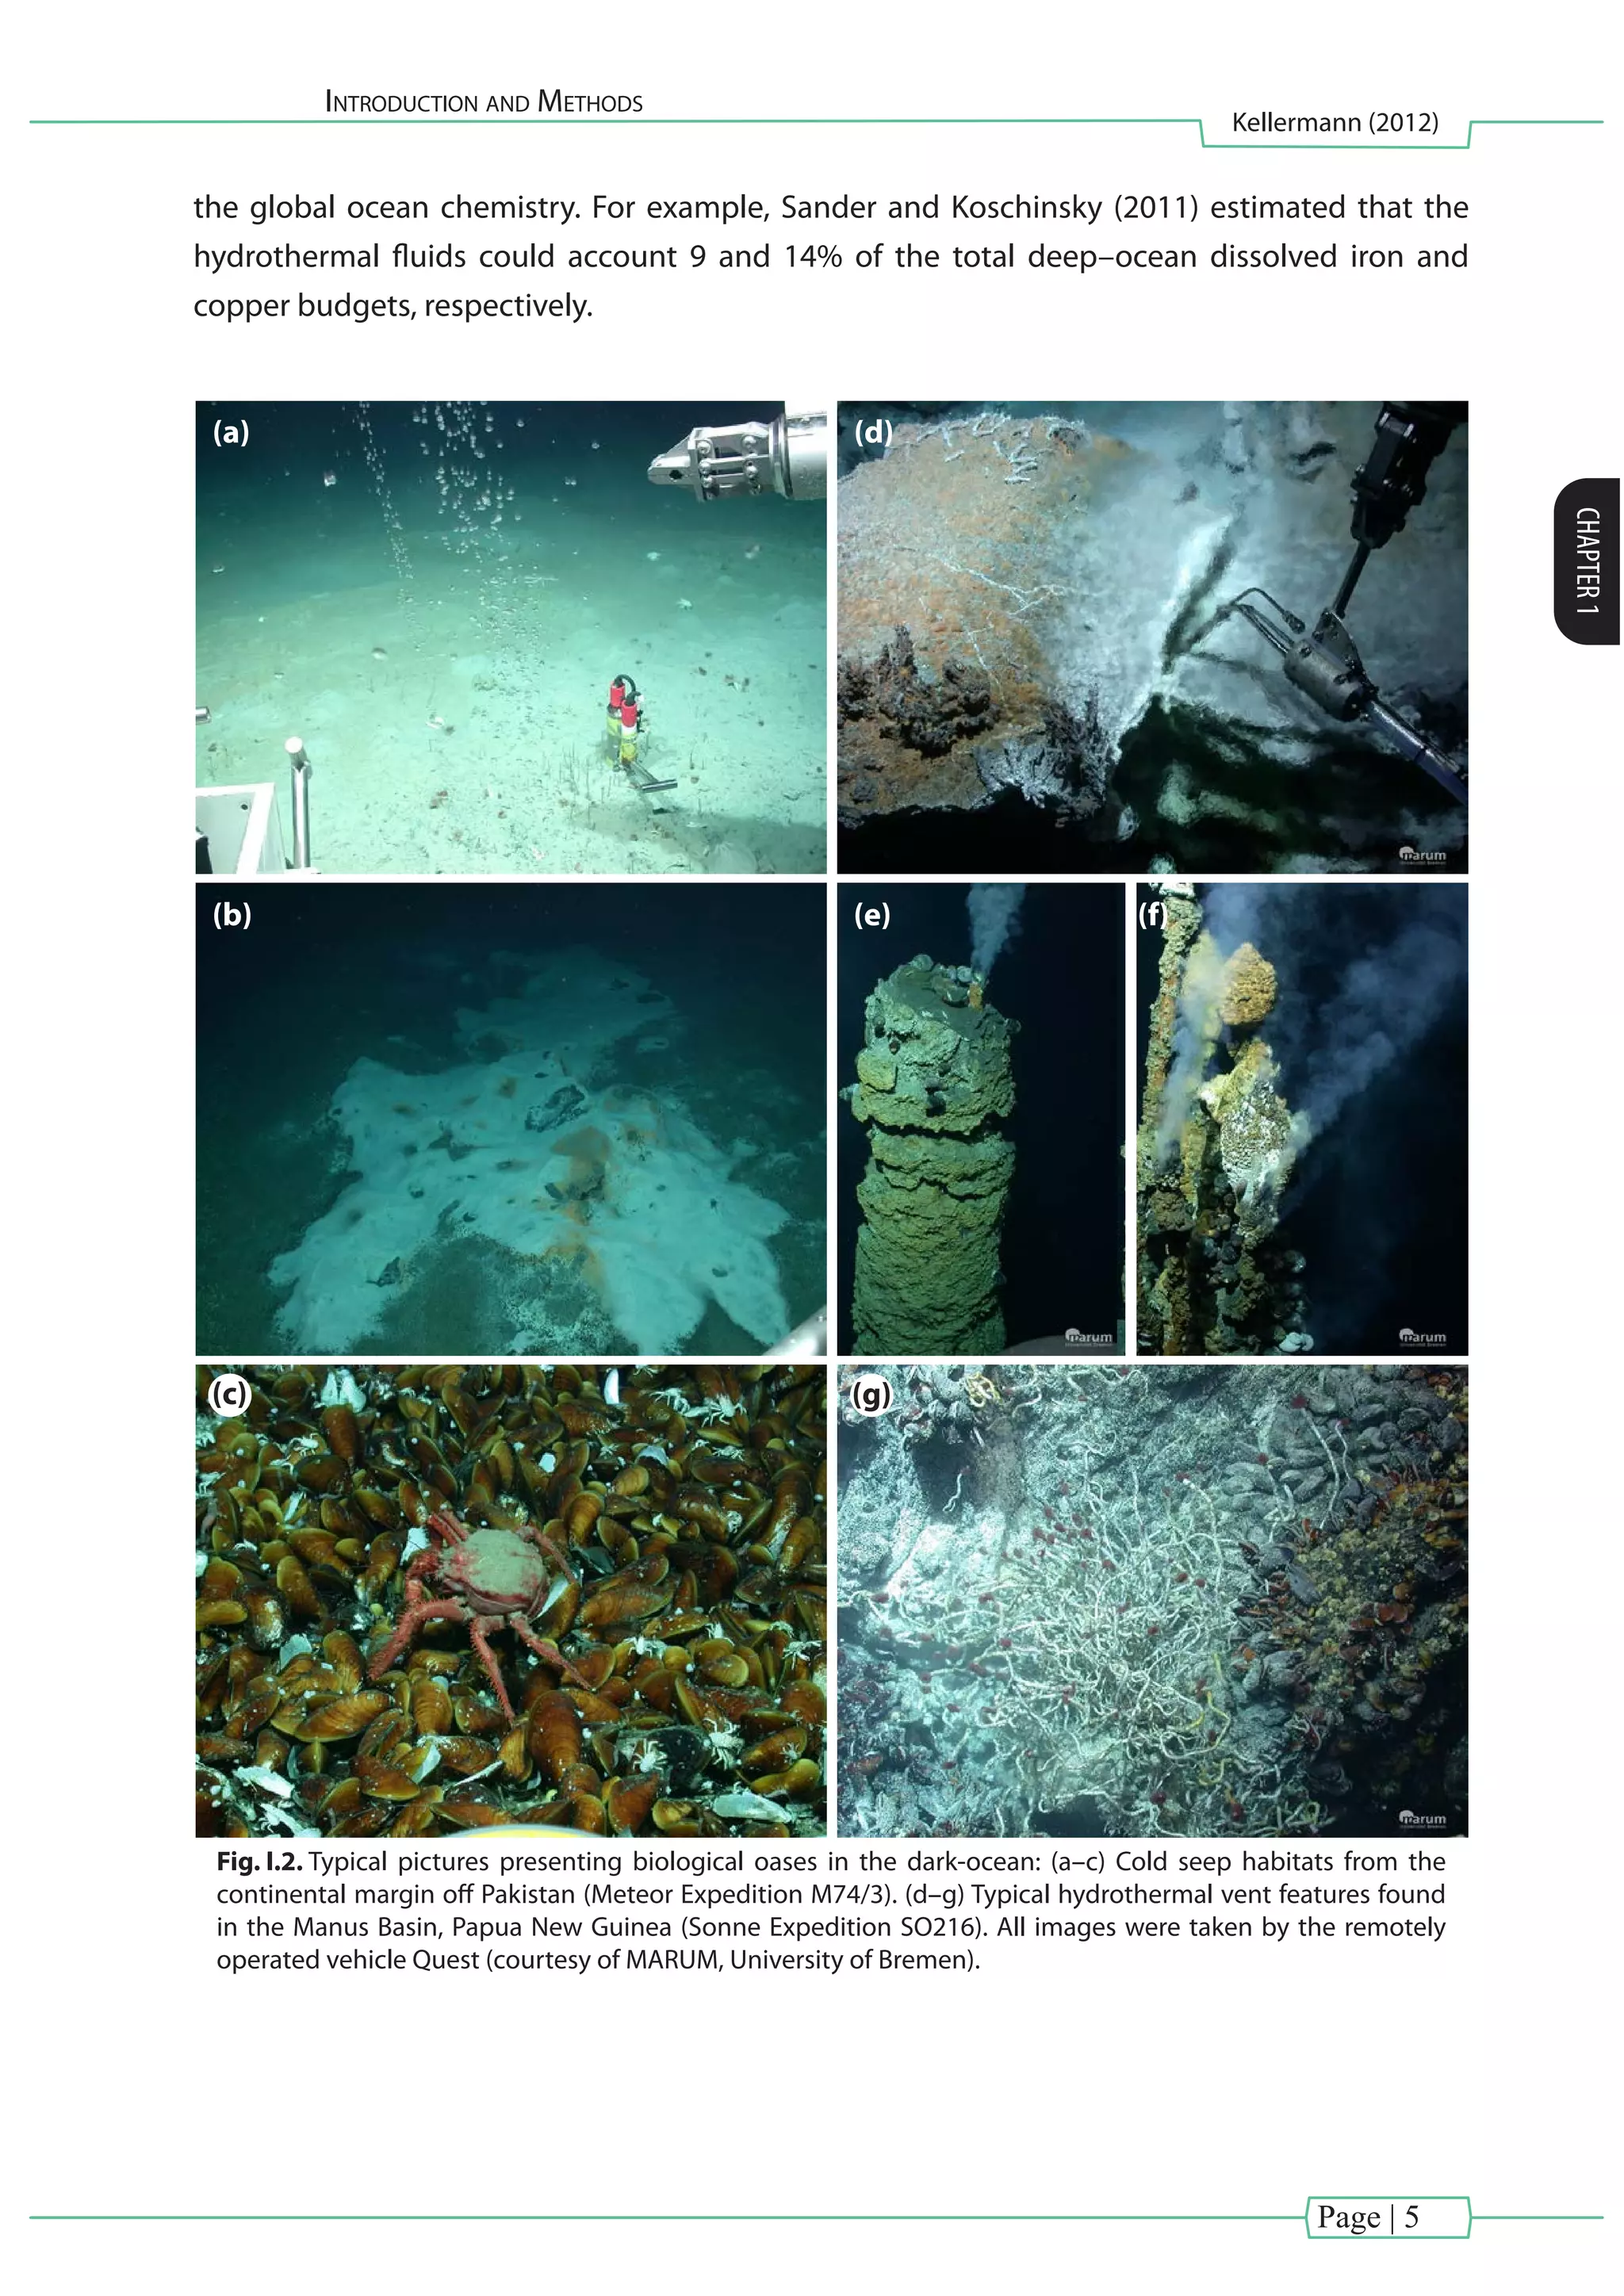
Fig. I.5. Symbiotic chemosynthesis in extreme environments. (a) Picture shows a mussel vent field from
a cold seep located off Pakistan taken by the remotely operated vehicle Quest (MARUM, University of
Bremen). (b) Schematic drawing of the function of symbionts within a Bathymodiolus spp. mussel. The
gray arrow indicates the three possible metabolic reactions performed by bacteria to harness energy (i)
oxidation of H2
to H2
O and (ii) oxidation of H2
S to SO4
2-
both performed by sulfide oxidizing bacteria; (iii)
oxidizing CH4
to CO2
performed by methane oxidizing bacteria. Figure has been modified after Orphan
and Hoehler (2011).
Cross Reference: [Chapter II] examined symbiont–host interactions within Bathymodiolus mussels using a
comprehensive lipid biomarker approach.This study targets IPLs (see section I.3.1.2) as a lipid class capable of
distinguish bacterial from host derived biomass.](https://image.slidesharecdn.com/54c05e1e-ddfa-426e-bc0d-230967ccb1b0-160817130319/75/PhD-thesis_Matthias-Kellermann-30-2048.jpg)
![Introduction and Methods
Kellermann (2012)
CHAPTER1
Page | 11
I.1.4. Methane oxidation: A globally important biogeochemical process
Methane, the simplest and most abundant hydrocarbon in the atmosphere, plays
an important role in Earth’s greenhouse problem. Its ability to trap heat via absorption and
re–emission of infrared radiation has been shown to be roughly 25 times stronger than CO2
(Lelieveldetal.,1993).Therefore,itsconcentrationintheatmospheresignificantlyinfluencesthe
energy budget of the Earth. However, marine environments, considering the high production
rates and large reservoirs of CH4
in marine sediments, contribute only little to the atmospheric
budget (Judd et al., 2002; Reeburgh, 2007), due to aerobic and anaerobic microbial methane
oxidization.
I.1.4.1. Aerobic oxidation of CH4
At the sediment–water interface at cold seep and hot vent environments high fluxes
of upward-advecting CH4
gas can be oxidized aerobically. Aerobic methanotrophy can be
described by the reaction equation [Eq. I]:
[Eq. I]
Compared to the anaerobic oxidation (see section I.1.4.2), the efficiency of the aerobic
methane oxidation is more than one order of magnitude higher (Nauhaus et al., 2007), therefore
the aerobic oxidation of the seep and vent community represents an efficient sink for CH4
(Sommeretal.,2009).However,atcoldandhotvents,theaerobicoxidationofmethaneislimited
by the rapid consumption of oxygen (Suess et al., 1999). Sulfate, on the other hand, exists in
exhaustless concentration in seawater (29mM; Jørgensen, 1982; Reeburgh, 2007), enabling the
sulfate–dependent anoxic methane oxidation (Reeburgh et al., 1969).Thus, the main biological
sink for CH4
consumption in marine sediments, including seep and vent environments, is the
anaerobic oxidation of methane (AOM; [Eq. II]) with sulfate as oxidant.
[Eq. II]
I.1.4.2. The history of AOM: A globally important process regulating ocean’s CH4
emission
The oceans contribute about 7–25% to the total global methane production (Hinrichs
and Boetius, 2002; Reeburgh, 2007). However, more than 90% of the total oceanic methane
production is consumed by the anaerobic oxidation of methane (AOM), thereby reducing
the oceans contribution to the atmosphere methane budget to less than 2% (Valentine and
Reeburgh, 2000; Reeburgh, 2007). The main niches for AOM-performing microorganisms in
the marine realm are sulfate methane transition zones (SMTZ; [BOX III]), where both methane
(transported from below) and sulfate (transported from above) are simultaneously consumed.
In marine sediments, first evidence for AOM came from in situ pore water gradients, showing
the mutual depletion of methane and sulfate in methane-rich anoxic sediments (e.g., Reeburgh,](https://image.slidesharecdn.com/54c05e1e-ddfa-426e-bc0d-230967ccb1b0-160817130319/75/PhD-thesis_Matthias-Kellermann-31-2048.jpg)
![Page | 12
Introduction and Methods
Kellermann (2012)
CHAPTER1
1969; Martens and Berner, 1974; Barnes and Goldberg, 1976; Reeburgh, 1976, 1980; Iversen and
Blackburn, 1981; see [BOX III]).The stoichiometric relationship of methane oxidation and sulfate
reduction was first published by Reeburgh (1976; [Eq. II]). Later, Iversen and Jørgensen (1985)
showed that rates of maximal methane oxidation coincide with a maximum in sulfate reduction
at the SMTZ [BOX III], indicating that CH4
consumption is directly linked to sulfate reduction.
The consumption of methane and the formation of sulfide from sulfate are coupled at a molar
ratio of approximately 1:1 (e.g., Nauhaus et al., 2002, Holler et al., 2009; 2011b), confirming the
stoichiometric equation of AOM (cf. [Eq. II]).
BOX III Sulfate methane transition zones and the appearance of AOM
The sulfate methane transition zone (SMTZ) is present in all anoxic marine systems where CH4
is
transported upwards from the zone of production (methanogenic zone) and SO4
2–
derived from the
overlying water column diffuses downwards (Reeburgh et al., 2007). In this centimeter–scale sediment
horizon microbial activity is enhanced by the anaerobic oxidation of methane (AOM; see section I.1.4.2)
coupled to autotrophic sulfate reduction (e.g., Hinrichs and Boetius 2002; Parkes et al., 2005).
For example, in typical marine sediments the relatively slow upward movement of CH4
allows AOM-
mediating organisms to remove CH4
at the SMTZ efficiently (Iversen and Blackburn, 1981; Iversen and
Jørgensen, 1985; Fossing et al., 2000). Considering the enormous aerial extent of marine sediments
(Whitman et al., 1998), the SMTZ plays a key role in the global CH4
cycle (Hinrichs and Boetius, 2002;
Reeburgh, 2007). Carbon cycling within the SMTZ, in general under cm scale, shapes geochemical
gradients (e.g., CH4
, SO4
2–
, DIC/alkalinity) and also stable carbon isotopic profiles of CH4
and DIC at the
scale of meters both above and below this biogeochemically active horizon. The intersection of both CH4
and SO4
2–
concentration (see Fig. I.6a), as well as depleted stable carbon isotopic compositions of both
CH4
and DIC (see Fig. I.6b) enables to identify the hotspot of active AOM (e.g., Valentine and Reeburgh,
2000). Further evidence for AOM is provided by radiolabeling experiments, where methane oxidation
rates (14
CH4
) and sulfate reduction rates (35
SO4
2–
) peak within the SMTZ (see Fig. I.6c).
CH4
oxidation rate
Rates (nmol cm-3
day-1
)
0 10 15 25 30205
SO4
2-
reduction rate
SMTZ
(c)
Sedimentdepth
SMTZ
sulfate
reduction
zone
methanogenic
zone
SMTZ
[CH4
] CH4
CH4
(mM)
0
0 10 20 30
0 10 20 30 40
4 8 12
[SO4
2-
]
SO4
2-
(mM)
SMTZ
DIC
δ13
C
[DIC]
DIC (mM)
-20 0-40-60-80-100-120
(a) (b)
Fig. I.6. General geochemical profiles in marine sediment where the anaerobic oxidation of methane
(AOM) takes place. (a) Concentration profiles of SO4
2–
, DIC, CH4
(modified after Reeburgh, 2007); (b) stable
isotope data (δ13
C) for DIC and CH4
(redrawn from Pohlman et al., 2008); (c) rates of SO4
2–
reduction and
CH4
oxidation (redrawn from Iversen and Jørgensen, 1985).](https://image.slidesharecdn.com/54c05e1e-ddfa-426e-bc0d-230967ccb1b0-160817130319/75/PhD-thesis_Matthias-Kellermann-32-2048.jpg)
![Introduction and Methods
Kellermann (2012)
CHAPTER1
Page | 13
In 1994, Hoehler and colleagues postulated that AOM is performed most likely in a
syntrophic reaction by methanogenic archaea and sulfate-reducing bacteria: a reversely acting
methanogenconsumesmethaneandproduceshydrogen(viaareversalofCO2
reduction)which
in turn is metabolized by a sulfate–reducing partner. Although thermodynamic calculations
for this reaction [Eq. II] resulted in extremely low energy yields (ΔG°’= –20 to –40 kJ mol–1
;
Hoehler et al., 1994; Knab et al., 2008; Alperin and Hoehler, 2009a), their hypothesis for the
functioning of AOM is still accepted. Nevertheless, the poor energy yield of this redox reaction,
which furthermore needs to be split between both partners, contradicts the traditional view
of the minimum free energy threshold of –20 kJ mol–1
determined for bacteria (i.e., the amount
of energy needed to generate ATP/mole H+
; Schink, 1997). Therefore the understanding of the
physiology and biochemistry of AOM remains incomplete.
TheinvolvementofArchaeainAOMwasindicatedbystrong13
Cdepletionofcharacteristic
archaeal biomarkers (δ13
C of archaeol = –100‰; δ13
C of hydroxyarchaeol = –110‰) identified in
seep sediments, leading to the conclusion that AOM microbial communities directly assimilate
13
C-depleted methane (Hinrichs et al., 1999). Later, numerous other studies presented δ13
C
biomarker data showing additional isotopically depleted lipids for the methane oxidizing
archaea, such as isoprenoidal hydrocarbons like tetramethylhexadecane (crocetane) and
pentamethyleicosane (PMI), as well as diagnostic fatty acids (FAs) and non-isoprenoidal glycerol
ethersforthesulfate-reducingbacterialpartner(SRBs).Thosearchaealandbacterialbiomarkers
showed δ13
C values ranging from –70‰ to –130‰ and –60‰ to –100‰, respectively (e.g.,
Elvert et al., 1999, 2003, 2005; Hinrichs et al., 1999, 2000; Pancost et al., 2000; Blumenberg et al.,
2004; Niemann and Elvert, 2008).
Cross Reference: Previous studies interpreted extremely 13
C-depleted archaeal and bacterial lipid biomarkers
as clear indicator for methane-driven lipid biosynthesis. However, just recently, Alperin and Hoehler (2009b)
questioned the exclusive methanotrophic carbon fixation by the Archaea and hypothesized a possible
autotrophic CO2
fixation pathway for both Bacteria and Archaea. Their hypothesis has been fueled by
observations of Wegener and colleagues (2008) amending cold seep AOM communities with either 13
CH4
or
H13
CO3
–
and detecting a mixed carbon assimilation of CH4
and CO2
within the Archaea and a pure autotrophic
lipid production within the Bacteria. [Chapter III] has used a similar approach as Wegener et al. (2008) in
which the dominant carbon source of both the Archaea and the Bacteria has been investigated by applying
an improved SIP approach (Dual-SIP; see section I.3.2.4).
Boetius and colleagues (2000) were the first to visualize the consortium of ANME and the
SRBs via microscopy of cells hybridized with fluorochrome–labeled specific oligonucleotide
probes. These aggregates of ANME and SRB have been shown to be the dominant microbial
population in various cold seep environments, representing more than 90% of the total
microbial community in this habitat (Boetius et al., 2000; Michaelis et al., 2002; Orphan et al.,
2002). Gene-based studies (16S rRNA, mcrA) revealed that AOM in marine environments is
mediated by three distinct clusters of Euryarchaeota (ANME–1, ANME–2, and ANME–3). These
three phylogenetic clusters of archaea are related to the orders of Methanosarcinales and](https://image.slidesharecdn.com/54c05e1e-ddfa-426e-bc0d-230967ccb1b0-160817130319/75/PhD-thesis_Matthias-Kellermann-33-2048.jpg)
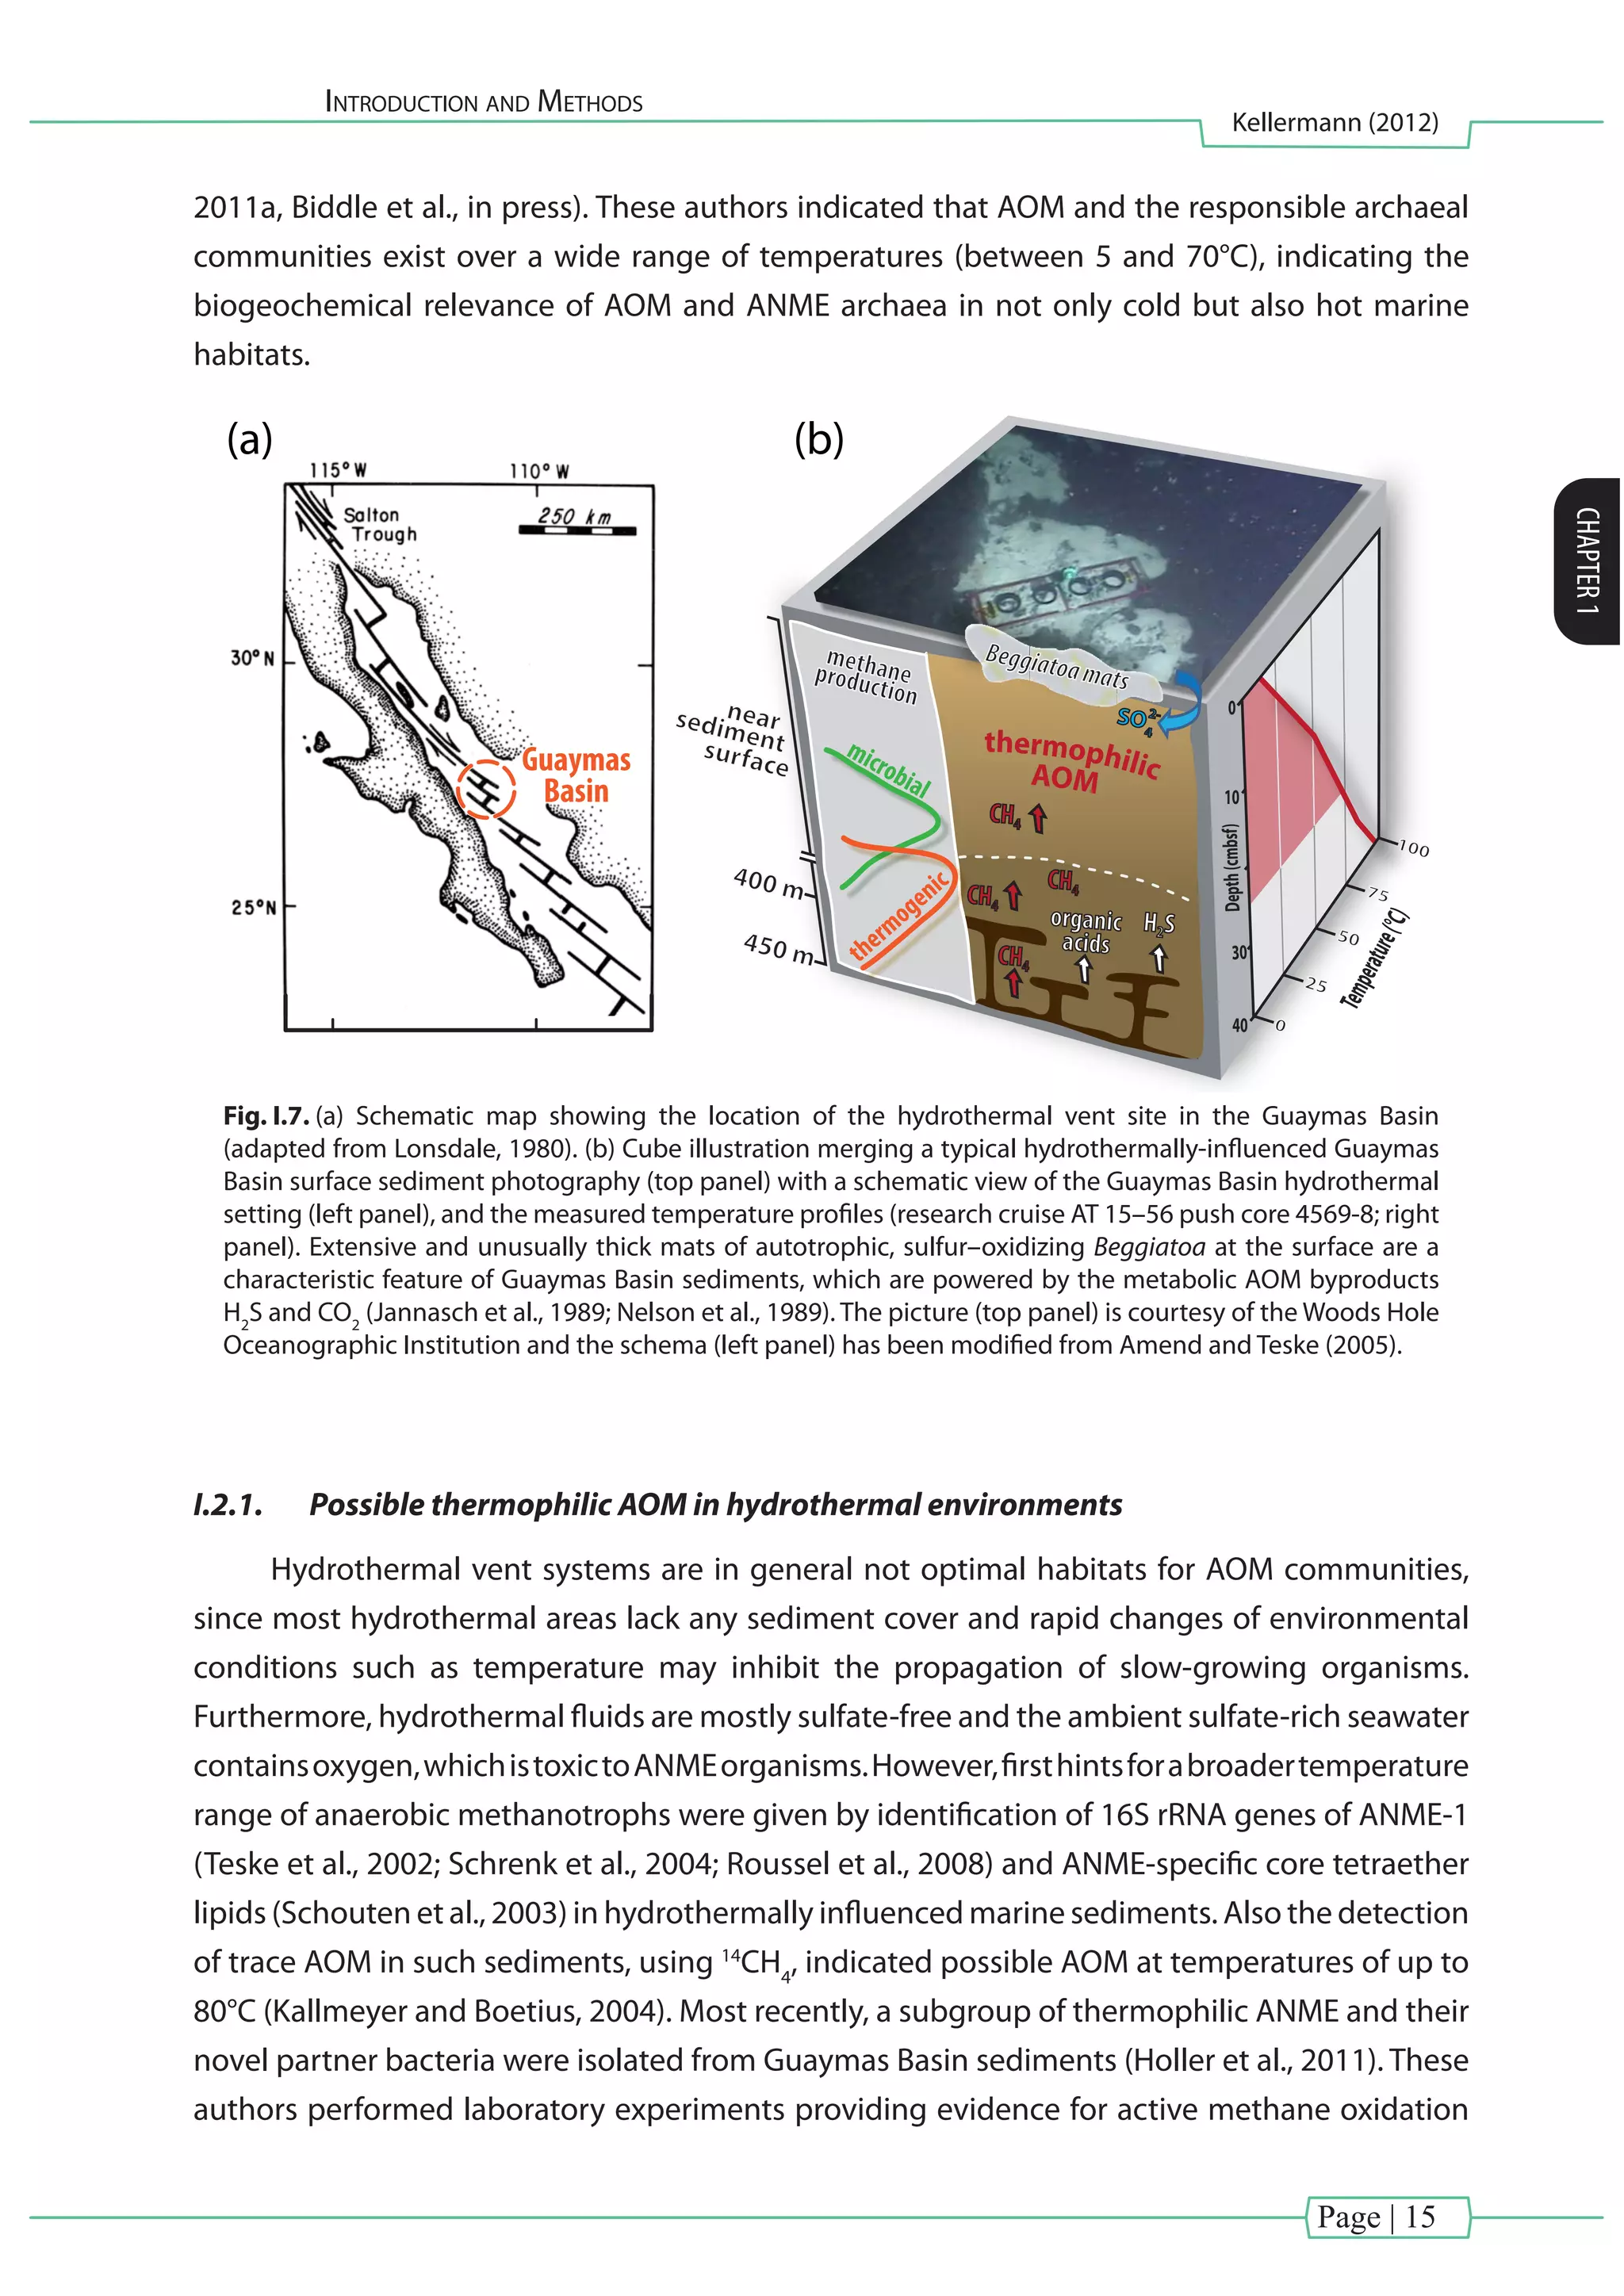
![Page | 16
Introduction and Methods
Kellermann (2012)
CHAPTER1
withathermophilictemperatureoptimumbetween45°Cand60°C(cf.Fig.I.8)andanupperlimit
of AOM up to 70°C. These results finally extend the known growth range of ANME organisms,
which was before defined as a moderately psychrophilic or mesophilic process widespread in
marine sediments and cold seep environments (e.g., Orphan et al., 2002; Knittel et al., 2005;
Nauhaus et al., 2007; Holler et al., 2009; Knittel and Boetius, 2009).
-45 -35500 100 -25
δ13
CCH4
(‰)
CH4
(mM)
(supersaturated)
CH4
(mM)
(supersaturated)
CH4
(mM)
(supersaturated)
CH4
(µM)
-45 -40500 100 -35 -30
δ13
CCH4
(‰)
0
10
20
30
40
50
-50 -40 -30 -20
8006004002000
10
(15 °C)
20
cont. ?
0 30
depth[cmbsf]
Sorrounding mat-free sediment
„cold-mat“ > [4569 (03)]
Under white Beggiatoa mat
„warm-mat“ > [4569 (01)]
Under orange Beggiatoa mat
„hot-mat“ > [4569 (08)]
δ13
CCH4
(‰) Temp. (°C)
-45 -40500 100 -35
δ13
CCH4
(‰)
INSINC - mat
[4568 (02)]
Temp. (°C)
Temp. (°C)Temp. (°C)
(23 °C)
(39 °C)
(62 °C)
(65 °C)
(45 °C)
(13 °C)
(4 °C)
possibleAOM
possibleA
OM
possi
bleAOM
possible AOM
CH4
(mM)
(supersaturated)
10
20
30
40
50
depth[cmbsf]
0
-42 -40 -38500 100 -36
δ13
CCH4
(‰)
Megamat (Marker 1)
[4486 (29)]
Temp. (°C)
(60 °C)
(16 °C)
possibleAO
M
Fig. I.8. Geochemistry of CH4
for different push core stations analyzed during two Guaymas Basin research
cruises(AT15–40;AT15–56). Selectedprofilesoftemperature,concentrationandcarbonisotopiccomposition
of CH4
from different locations are shown. Here, δ13
C–isotopic signatures of CH4
provided consistent evidence
of ongoing AOM at elevated temperatures (Kellermann et al., unpublished results; cf. Biddle et al., in press).
Zones of possible AOM (here indicated in red), coincides with a thermophilic temperature optimum between
45°C and 60°C observed by Holler and coworkers (2011a).
Since AOM operates close to the thermodynamic equilibrium (Hoehler et al., 1994; Knab
et al., 2008; Alperin and Hoehler, 2009a), the growth yield of the organisms is extremely low
(around 1% relative to CH4
oxidation; Nauhaus et al., 2007; Treude et al., 2007; Wegener et al.,
2008; Holler et al., 2011a). For example, AOM consortia from cold methane-rich environments
with a temperature optimum between 5 to 20°C have been shown to grow with doubling times
of three to seven months (Nauhaus et al., 2005; 2007; Holler et al., 2009). However, the recently
obtainedthermophilicAOMenrichmentshowedashorteneddoublingtimeof68days(Holleret
al., 2011a). The feasibility of sulfate-dependent thermophilic AOM up to temperatures of 100°C
has been demonstrated by La Rowe et al. (2008) who conducted thermodynamic calculations
of the Gibbs free energy yield.](https://image.slidesharecdn.com/54c05e1e-ddfa-426e-bc0d-230967ccb1b0-160817130319/75/PhD-thesis_Matthias-Kellermann-36-2048.jpg)
![Introduction and Methods
Kellermann (2012)
CHAPTER1
Page | 19
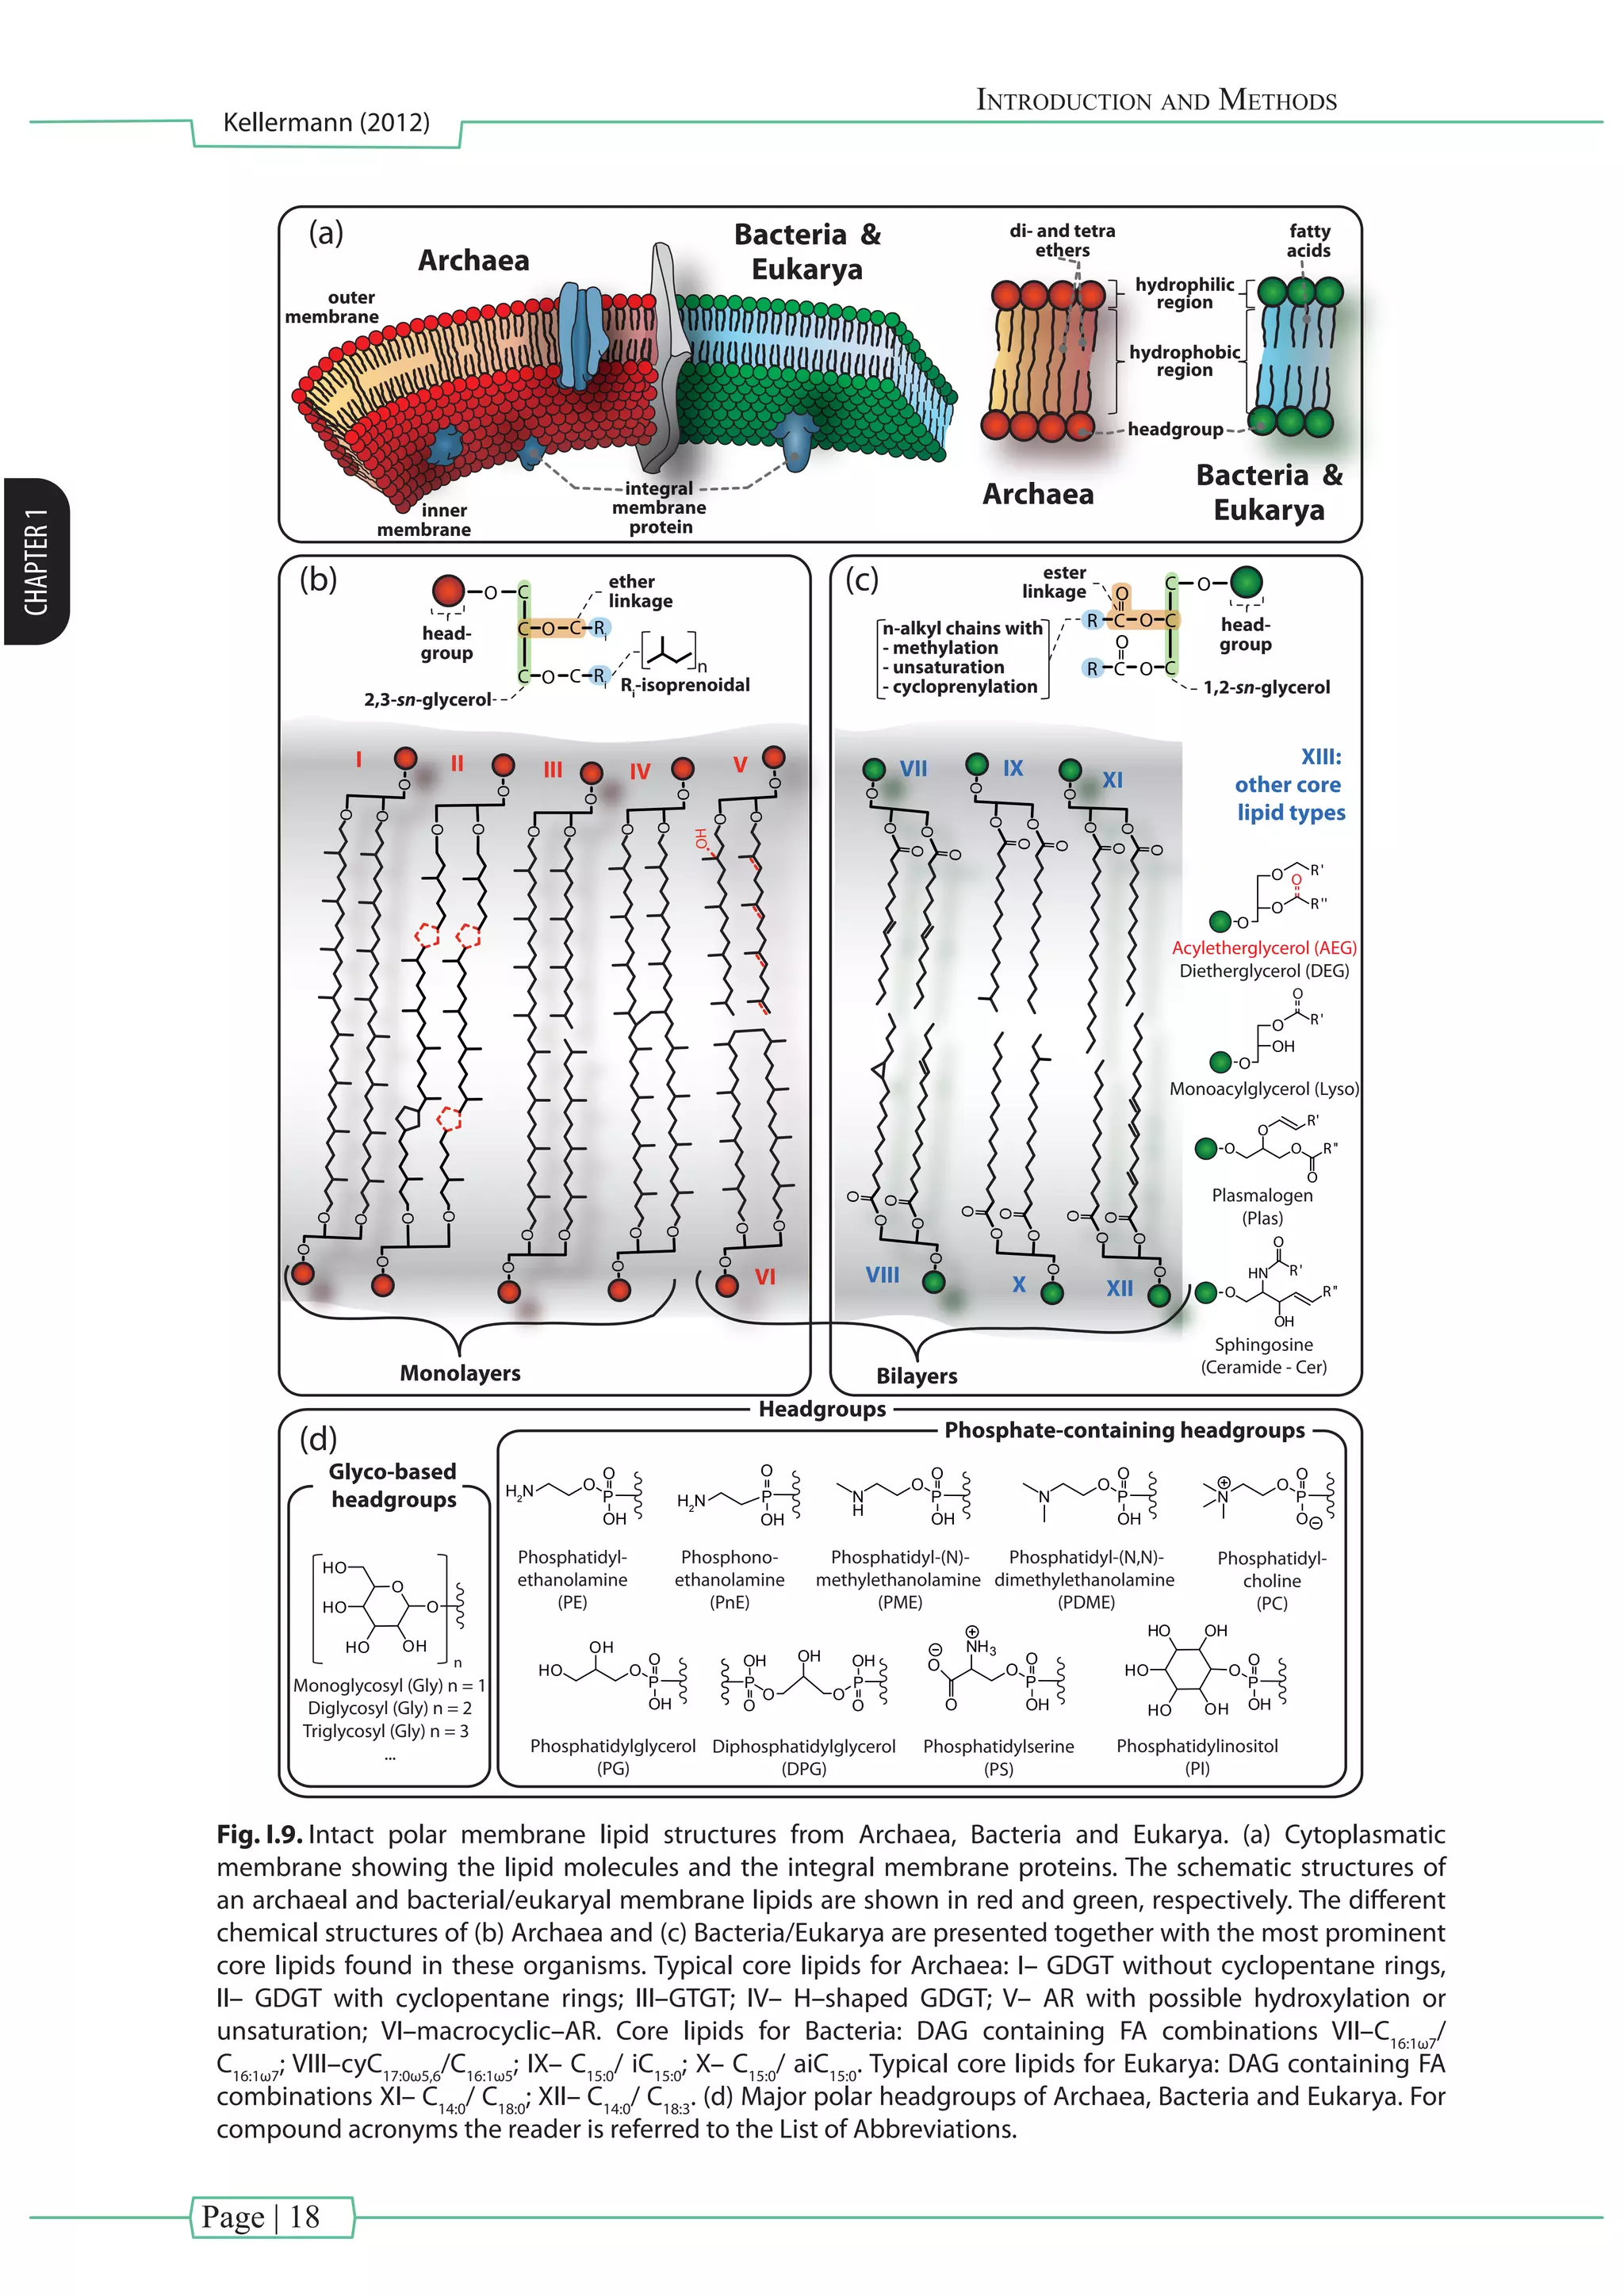
I.3.1.2. IPLs representing all three domains of life
The membrane constituents of the three domains of life (Archaea, Bacteria and Eukarya)
have fundamental differences (Kates et al., 1978; Langworthy, 1982; Koga et al., 1993). Archaeal
IPLs are comprised of isoprenoidal side chains (C15
, C20
, C25
, C40
: farnesyl, phytanyl, sesterterpanyl
and biphytanyl, respectively) bound at the sn–2 and sn–3 position via di– or tetraether linkage
to the glycerol backbone, while the headgroup is attached at the sn–1 position (Fig. I.9b; e.g.,
Koga et al., 1993; Koga and Morii, 2007). Thus, archaeal membranes can occur both as bilayer
(dietherlipids)ormonolayer(tetraetherlipids).Bycontrast,bacterialandeukaryoticmembranes,
build up membrane lipids containing headgroups attached to the glycerol backbone at the
sn–3 position. In general, two fatty acid chains are linked to the glycerol backbone via ester
bonds in the sn–1 and sn–2 position (Fig. I.9c). Bacterial and eukaryal IPLs differ in the length
of carbon chains and the degree of unsaturation of the core lipids. Typically, eukaryotic FAs
have predominantly even-numbered carbon atoms (Lechevelier and Lechevalier, 1988), and
are often polyunsaturated (Brett and Müller–Navarra, 1997). Bacteria produce FAs with chain
lengths of 14 to 24 carbon atoms, monounsaturated fatty acids and/or penultimate (iso) or
ante-penultimate (anteiso) methyl-branched compounds (Zhang and Rock, 2008). In addition,
Bacteria and Eukarya differ in the production of cyclic isoprenoids: Whereas Bacteria produce
preferentially hopanoids, eukaryotes synthesize sterols in their membranes (see [BOX IV];
Ourisson et al., 1987).
BOX IV Hopanoids and steroids as membrane rigidifiers
Bacteriohopanepolyols (BHP) are a class of lipid which is known more generally as hopanoid. Hopanoids
are pentacyclic isoprenoids, which are found in many Bacteria, and particularly in cyanobacteria (Rohmer
et al., 1984; Rohmer et al., 1993; Summons et al., 1999). Sterols, on the other hand, are generally absent
in Archaea and Bacteria (Bouvier, 1976), but represent a conspicuous feature in lipid membranes of
eukaryotes (Fig. I.10; Ourisson et al., 1987). As an exception, 4–methyl sterols have been detected in
some aerobic methanotrophic bacteria, making them an ideal marker for this group of bacteria (Fig. I.10;
Bouvier et al., 1976; Ourisson et al., 1987; Elvert and Niemann, 2008). Due to structural similarity (e.g.,
molecular dimensions, semi–planar polycyclic ring structure and amphiphilic character) both hopanoids
and sterols are believed to serve as membrane stabilizers within the bacterial and eukaryotic membrane,
respectively (Ourisson et al., 1987).
hopanoid:
aminobacteriohopane-31,32,33,34-triol
(aminotriol)
4-methyl steroid:
4α-methylcholesta-8(14),24-dien-3β-ol
steroid:
cholest-5-en-3β-ol
(also known as cholesterol)
OH
BACTERIA EUCARYA
OH
OH NH2
HOHO
Fig. I.10. Chemical structure of characteristic triterpenoids.](https://image.slidesharecdn.com/54c05e1e-ddfa-426e-bc0d-230967ccb1b0-160817130319/75/PhD-thesis_Matthias-Kellermann-39-2048.jpg)
![Page | 20
Introduction and Methods
Kellermann (2012)
CHAPTER1
Cross Reference: In [Chapter II] the taxonomic information encoded in the intact polar lipid (IPL) molecules
enabled us, in a quantitative manner, to distinguish endosymbiotic bacteria from their eukaryotic host, which
were recovered from cold–and hot seep environments.
I.3.1.3. IPLs as taxonomic marker for the active microbial biomass
Thespecializationofmicroorganismstoawiderangeofbiologicalprocesseshasledtothe
formation of a variety of membrane lipids with differential functional roles.The vast abundance
of IPL membrane compositions can be assigned to: (1) responses with respect to environmental
parameters (see section I.3.1.4), or (2) from different membrane characteristics of organism
groups that are either phylogenetically related or have similar metabolisms (Langworthy, 1982;
Goldfine, 1984; Langworthy and Pond, 1986; Kaneda et al., 1991; Itoh et al., 2001).
Basedonrecentdevelopmentsinanalyticalchemistry,membranelipidsarenowaccessible
to be analyzed in their intact form using liquid chromatography coupled to mass spectrometry
(LC-MS; see section I.3.1.5). Before this direct measurement of IPLs using the LC–MS technique,
indirect measurements of IPLs have been performed using mostly silicagel column in order to
separate lipid extracts into fossil, glyco– and phospholipid fractions (Guckert et al., 1985; Oba
et al., 2006; Pitcher et al., 2009), which subsequently were hydrolyzed and/or ether-cleaved in
order to release their core lipids. Such conventional biomarker analyses focused mainly on the
polar lipid–derived fatty acids (PLFAs) or other IPL derivatives such as isoprenoidal hydrocarbon
chains (e.g., Parkes and Calder, 1985; Boschker et al., 1998; Orcutt et al., 2005; Wakeham et al.,
2007). The advantage of direct IPL analysis compared to traditional membrane lipid analysis
is a better taxonomic differentiation in environmental samples, since additional structural
information, such as headgroup and core lipid composition can be determined simultaneously
(Fang et al., 2000b; Rütters et al., 2002b Sturt et al., 2004; Biddle et al., 2006; Zink et al., 2008;
Schubotz et al., 2011b; Yoshinaga et al., 2011). However, most importantly, IPLs are thought to
be labile compounds which tend to (bio) degrade (hydrolysis of the polar headgroup) soon after
cell death (White et al., 1979; Harvey et al., 1986; Moodley et al., 2000). Hence, in comparison
to their more stable and recalcitrant core lipids, the presence of IPLs in sediments is thought to
reflect viable microbial cells (e.g., Sturt et al., 2004; Biddle et al., 2006; Schubotz et al., 2011b).
However, the stability of IPLs, especially for glycosidic archaeal IPLs, is an intensively discussed
topic in the field of organic geochemistry (e.g., Lipp and Hinrichs et al., 2009; Schouten et al.,
2010).
The increasing numbers of publications related to IPL research reflect their reputation.
For example, a vast number of recent publications applied IPLs as chemosynthetic markers
extracted either from cultures (e.g., Koga et al., 1998; Koga and Morii, 2005; Koga and Nakano,
2008) or various natural environments in the marine and terrestrial sediments (e.g. Rütters et al.,
2001, 2002a, 2002b; Zink et al., 2003; Biddle et al., 2006; Lipp et al., 2008; Schubotz et al., 2009;
Liu et al., 2010; 2011), surface waters of the oceans (e.g. Van Mooy et al., 2006; Schubotz et al.,
2009; Van Mooy and Fredericks, 2010; Popendorf et al., 2011) and cold seeps and hydrothermal](https://image.slidesharecdn.com/54c05e1e-ddfa-426e-bc0d-230967ccb1b0-160817130319/75/PhD-thesis_Matthias-Kellermann-40-2048.jpg)
![Introduction and Methods
Kellermann (2012)
CHAPTER1
Page | 21
vents (e.g., Rossel et al., 2008, 2011; Schubotz et al., 2011b; Yoshinaga et al., 2011).
CrossReference:[ChapterIIIandV]investigatedthelipidcompositionofanaturalenrichmentofthermophilic
AOM consortia, originally retrieved from the hydrothermally-influenced sediments of the Guaymas Basin. In
[Chapter III] we analyzed the ether-cleaved and hydrolyzed core lipids from the AOM community, which were
dominated by thermophilic ANME–1 and partner bacteria from the HotSeep–1 cluster (Holler et al., 2011).
[ChapterV], on the other hand, focused on individual archaeal IPLs (IPL–SIP) extracted from the same ANME-1
community analyzed in [Chapter III].
I.3.1.4. Membrane adaptation strategies of Archaea and Bacteria to cope with extreme
environmental conditions
In general, archaeal ether lipids are considered to be more resistant to stress factors such
as high temperature, pH, salinity, and pressure than lipids from Bacteria, containing mostly
ester bonds (Valentine, 2007). Therefore, Archaea were assumed to be the dominant group of
microorganisms that are able to thrive at extreme environments (e.g., van de Vossenberg et
al., 1998; Rothschild and Mancinelli, 2001; Cavicchioli, 2011). In this context, it is interesting to
mention that Archaea root very deeply in the phylogenetic tree, pointing to a close relationship
with a thermophilic ancestor (Woese et al., 1990; Stetter, 1996). Nevertheless, both Archaea
and Bacteria have developed different strategies to protect themselves from changing external
environmental conditions by modifying their membrane lipids.
Bacteria have the ability to react to changing external conditions (e.g., increase
in temperature, pH, pressure or salinity) by modifying both their apolar fatty acid chain
composition (e.g., variations in chain length, unsaturation, cyclopropanisation, and methyl
branches; Cronan and Gelmann,1975; Langworthy, 1982; DeLong and Yayanos, 1986, Nichols
et al., 1997; Männistö and Puhakka, 2001; Valentine and Valentine, 2004; Zhang et al., 2008) as
well as their polar headgroup composition (e.g., increase in temperature caused thermophilic
bacteria to shift from the synthesis of PE to PG, Hasegawa et al., 1980). Compared to the
bacterial membranes, the archaeal membranes are much less permeable towards passive
diffusion of ions. This enables Archaea to survive under extreme conditions (e.g., Elferink et
al., 1994; van de Vossenberg et al., 1995; 1998; Valentine, 2007). For example, compared to
diether–based membranes, the presence of membrane–spanning GDGTs and/or macrocyclic
archaeol in Archaea has been observed as strategy to tighten their membranes (Mathai et al.,
2001). Furthermore, by increasing cyclization of the tetraether isoprenoidal chains (e.g., Gliozzi
et al., 1983; Langworthy and Pond, 1986; De Rosa and Gambacorta 1988; Schouten et al.,
2003; Macalady et al., 2004) and substituting phospho–based by glycosidic headgroups (e.g.,
Shimadaetal.,2008)archaeareduceprotonpermeability,withstandingextremeenvironmental
conditions.](https://image.slidesharecdn.com/54c05e1e-ddfa-426e-bc0d-230967ccb1b0-160817130319/75/PhD-thesis_Matthias-Kellermann-41-2048.jpg)
![Page | 22
Introduction and Methods
Kellermann (2012)
CHAPTER1
Cross Reference: In [Chapter V] we hypothesize that the tetraether membrane, especially the formation
of 2Gly–GDGT, is used to reduce proton-permeability, thereby protecting the integrity of cells at extreme
conditions.
I.3.1.5. Sample handling: From extraction to IPL analysis to inter–and intramolecular isotope
analysis
In this dissertation IPLs have been extracted from sediments, microbial enrichments and
pure biomass using a modified Bligh and Dyer method (White and Ringelberg, 1998; Sturt et al.,
2004). Hereby samples were extracted using a mixture of methanol (MeOH), dichloromethane
(DCM) and an aqueous buffer in order to prepare the total lipid extract (TLE). In brief, target
sedimentswereextractedusingMeOH:DCM:aq.phosphatebuffer(50mM,pH7.4)(2:1:0.8,v:v:v)
and MeOH:DCM:trichloroacetic acid (50 mM, pH 2) (2:1:0.8, v:v:v). The combined supernatants
were washed with water, evaporated to dryness and stored at –20°C. Subsequently, an aliquot
of the TLE was analyzed by high performance liquid chromatography coupled to electrospray
ionization ion trap multistage mass spectrometry (HPLC/ESI–ITMSn
).This analytical technique is
particularly appropriate for the analysis of polar molecules such as IPLs. HPLC/ESI–ITMSn
allows
detailed structural characterization of IPLs by combining information gained in positive and
negative ionization modes not only in MS2
but also in MS3
(Fig. I.11; e.g., Rütters et al., 2002a;
Sturt et al., 2004; Zink and Mangelsdorf, 2004; Yoshinaga et al., 2011).
Intermolecular analysis
Preparative–HPLC is a new methodological advancement to the aforementioned
conventional lipid separation enabling to separate for example IPLs from the free/core lipids.
Recently, new purification protocols emerged, targeting the isotopic analysis of the apolar
side chains of individual IPLs extracted from environmental samples (e.g., Biddle et al., 2006;
Schubotz et al., 2011b). However, these protocols used only one dimensional normal–phase
preparative HPLC, thus IPLs with similar structural components were not completely separated.
In [Chapter V], further purification schemes are presented, involving the combination of
normal– and reverse–phase preparative HPLC in order to separate co–eluting archaeal di–and
tetraethers into individual fractions.
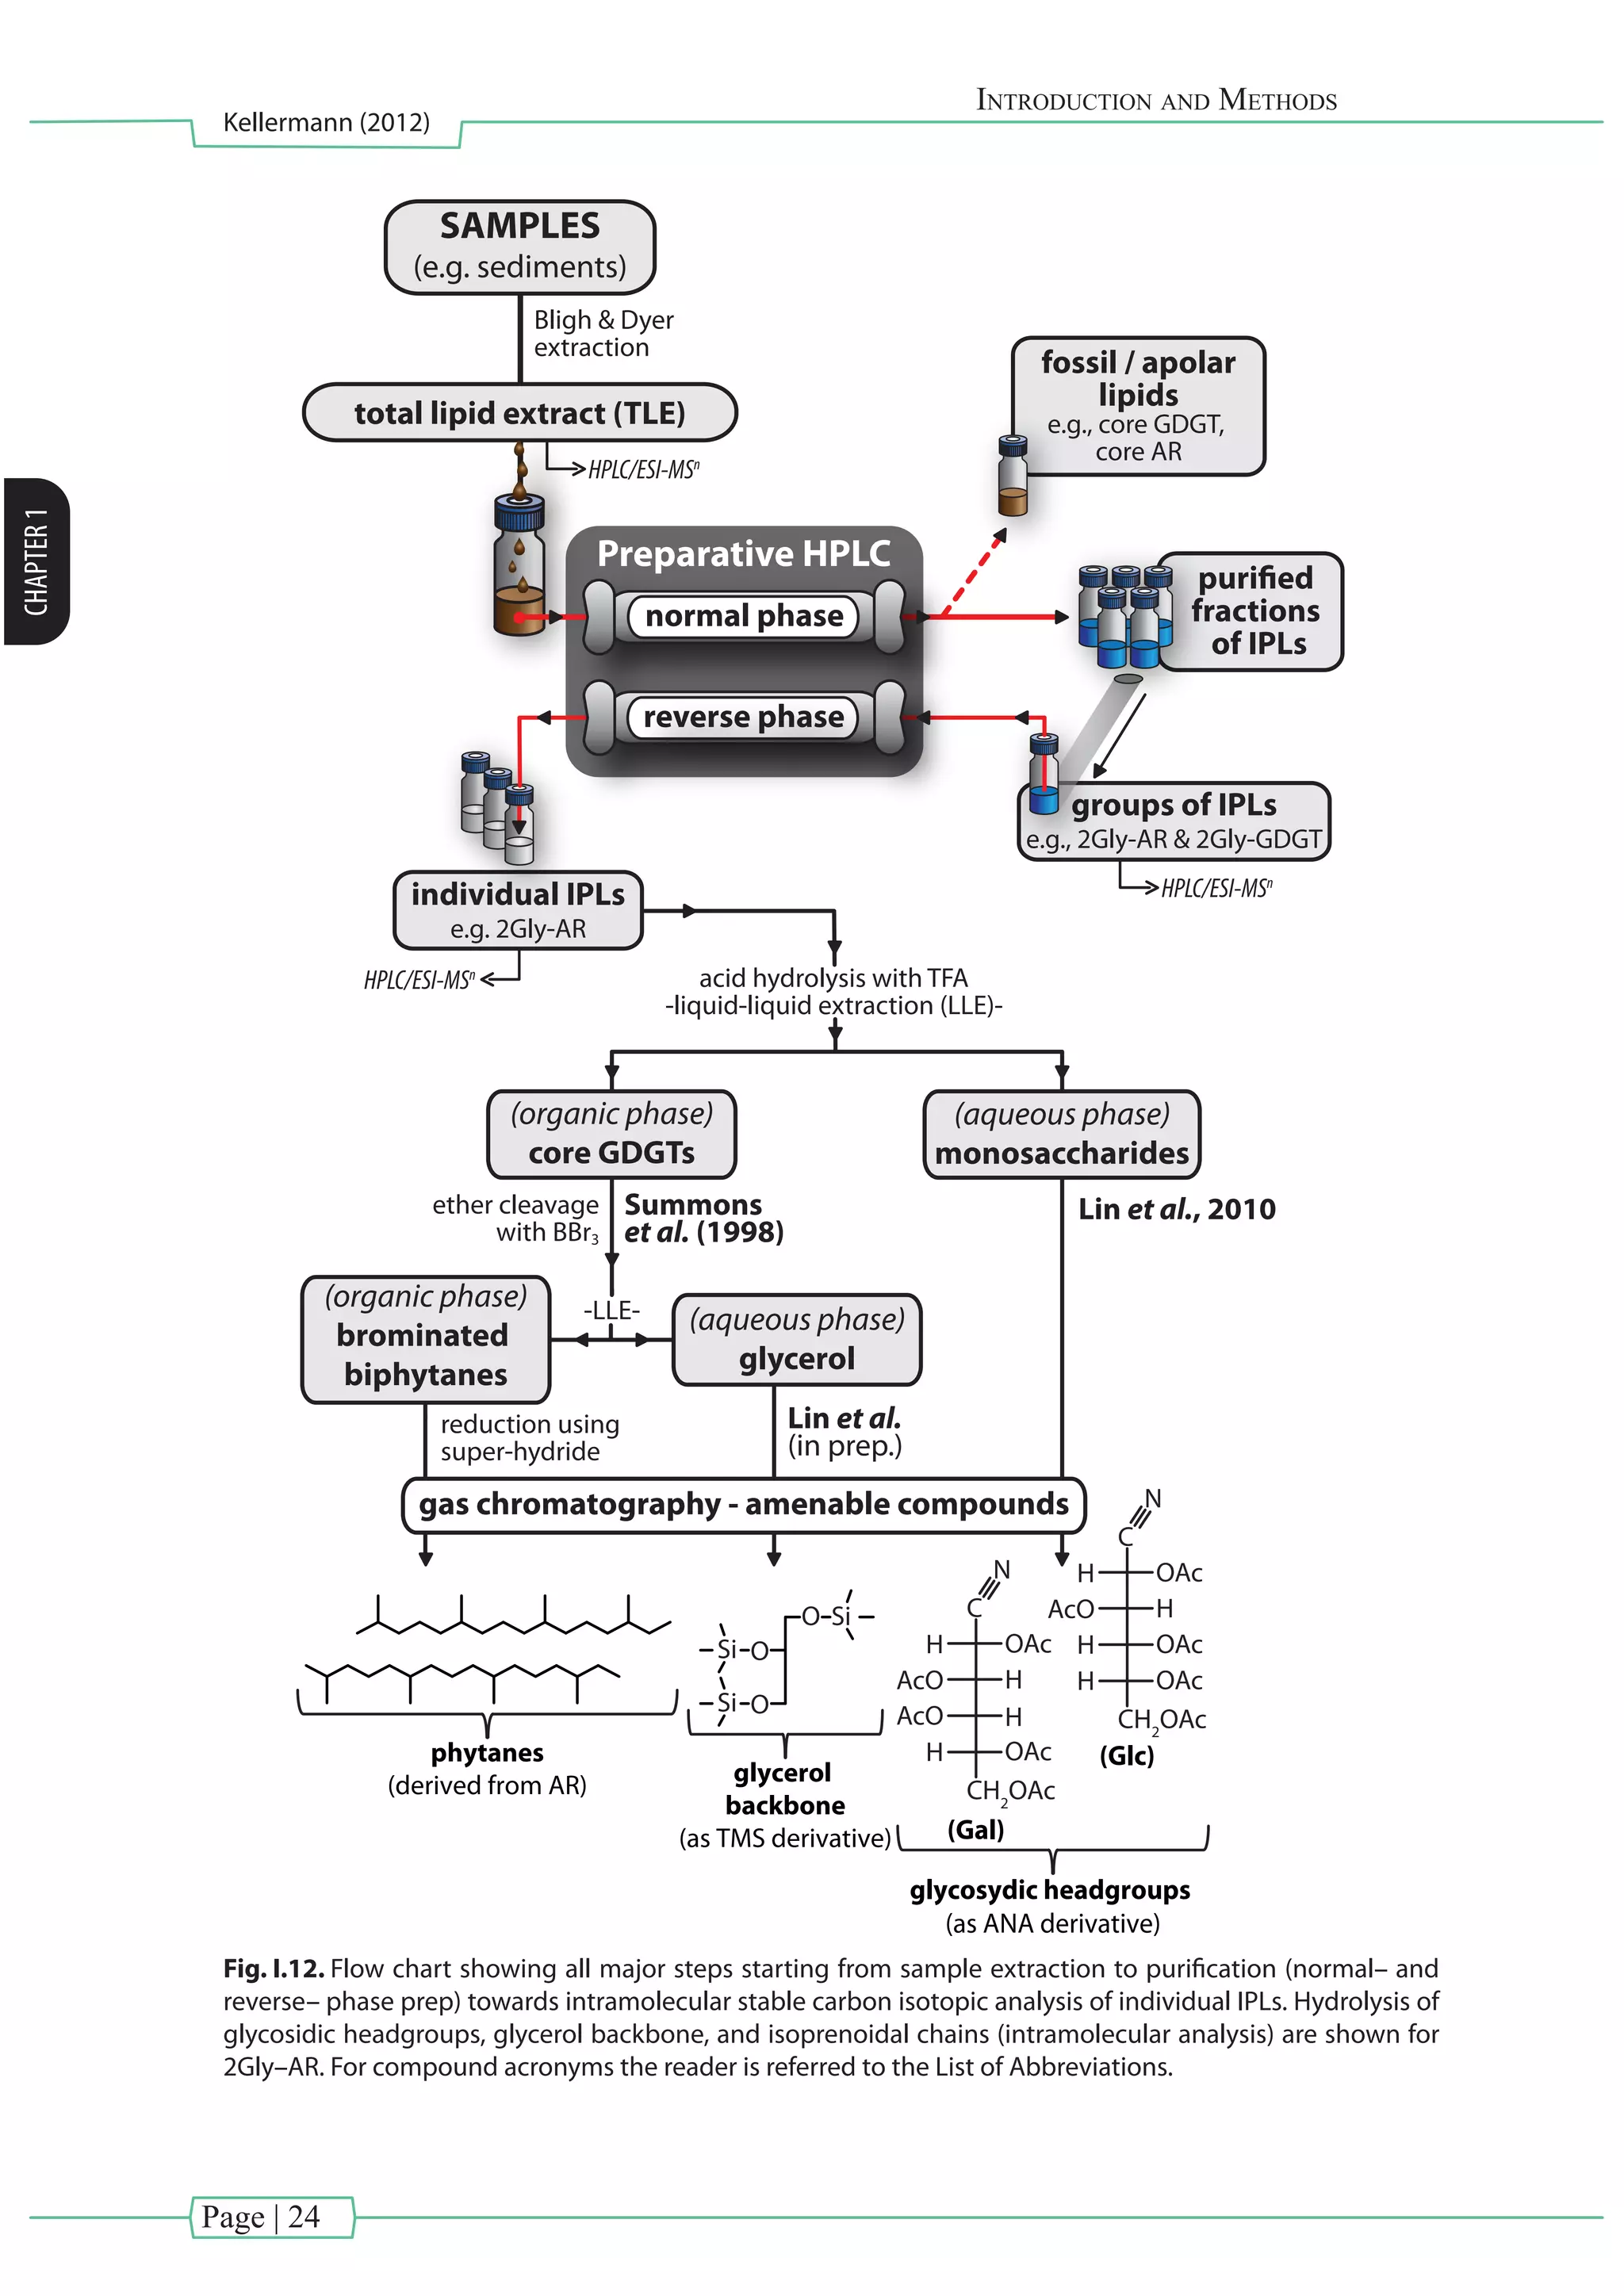
Intramolecular analysis
After lipid purification of individual IPLs, several cleavage reactions are necessary to
obtain GC–amenable compounds for intramolecular isotopic analysis. Recently, protocols have
been developed which allow analyzing polar lipid moieties, such as glycosidic headgroups (Lin
et al., 2010) and the glycerol backbone (Lin et al., in preparation) together with their apolar
side chains (e.g., biphytanes from GDGTs, PLFAs from phospholipids) . A schematic diagram
illustrating the analytical routes starting from sample extraction until separation of individual
lipid moieties is provided in Fig. I.12](https://image.slidesharecdn.com/54c05e1e-ddfa-426e-bc0d-230967ccb1b0-160817130319/75/PhD-thesis_Matthias-Kellermann-42-2048.jpg)
![Introduction and Methods
Kellermann (2012)
CHAPTER1
Page | 23
2000
1900
1800
1700
1600
1500
1400
1300
1200
1100
1000
900
800
700
600
15 20 25 30 35 40
Retention time [min]
m/z
2Gly-
GDGT BPGs
2Gly-AR
PG-AR
PGPG-OH-AR
PG-OH-AR
PE-AR
PS-AR
PAF
PS-OH-AR
PS-diOH-AR
PI-OH-AR
PG-GDGT-PG
Gly-BPG
Ser-BPG
PI-Ext-
OH-AR
PI-AR
PI-Ext-Uns(5)-
OH-AR
BL
PE-DEG PE
PE&PME
PC
PG
dimers
PS-diOH-AR
[M H] = 852
PE-DAG
[M H] = 688
538
547
253
450
556260
242
RelativeAbundance
O
O
O
P
O
O
OHNH2
HO
O OH
OH
556 (538)
260 (242)
+H
200 300 400 500 600 700
m/z
800 900
(a)
(c)
(b)
RelativeAbundance
200 300 400 500 600 700 800
m/z
PE-DAG
[M H] = 686
RelativeAbundance
200 300 400 500 600 700 800
m/z
450
253
253
547
+H -H
O O
O
O
O
P
O
OH
O
H2
N
O O
O
O
O
P
O
OH
O
H2
N
Fig. I.11. (a) Density map showing archaeal (red) and bacterial (blue) lipids analyzed in positive ionization
mode by HPLC/ESI–ITMSn
. The high diversity of microbial IPLs became apparent after visualization of the
chromatogram by way of 3D density maps (x – time, y – m/z, z – intensity). The intensity of the color black
is correlated to the concentration of the IPLs. Density maps provide a “fingerprint” of the IPL composition
in environmental samples. This sample was originally extracted from a cold seep environment from the
continental margin off Pakistan (M74/3, GeoB 12315, water depth 1000 m). Exemplarily, two fragmentation
pattern of (b) the archaeal IPL PS–diOH–AR in positive ionization mode and (c) the bacterial IPL PE–DAG in
both positive (left) and negative (right) ionization modes. In general, bacterial lipids typically lose its polar
headgroup upon fragmentation in positive ion mode in the mass spectrometer from which a headgroup-
diagnostic neutral mass loss can be calculated (e.g., PE–>loss of 141 Da). In negative ion mode, the bacterial
IPL parent ion tends to lose primarily their fatty acid chains (e.g., C16:1
–> m/z 253 Da). The fragmentation
patterns of a wide variety of archaeal IPLs are summarized in more detail in [Chapter IV]. For compound
acronyms the reader is referred to the List of Abbreviations.
Cross Reference: [Chapter IV] focused exclusively on the diversity of archaeal IPLs extracted from
environmental samples. This chapter revealed a systematic fragmentation pattern during high performance
liquid chromatography electrospray ionization mass spectrometry, providing a guide for organic geochemists
analyzing archaeal IPLs in natural samples.](https://image.slidesharecdn.com/54c05e1e-ddfa-426e-bc0d-230967ccb1b0-160817130319/75/PhD-thesis_Matthias-Kellermann-43-2048.jpg)
![Introduction and Methods
Kellermann (2012)
CHAPTER1
Page | 25
I.3.2. Stable carbon and hydrogen isotope analysis as tool in biogeochemistry
Carbon and hydrogen atoms contain variable numbers of neutrons in their nucleus,
leading to different isotopes of the same element. The term “isotope” is originated from the
greek language, where“iso”means equal and“topos”means location.
Carbon has two stable isotopes: 12
C and 13
C.The ratio of 13
C to 12
C can be expressed as δ13
C
as deviation in permill from a reference material [Eq. III] (typically, Vienna Pee dee Belemnite;
VPDB). The VPDB standard had a 13
C:12
C ratio (0.0112372), which by definition has a δ13
CVPDB
value of zero.
(
( )
( )
)
(
( )
( )
)
[Eq. III]
Like carbon, hydrogen has two stable isotopes: 1
H and 2
H. 1
H, consisting only of one
proton, is the most common hydrogen isotope. The 2
H isotope is also called deuterium (D)
and water enriched in D is called heavy water. The degree of hydrogen deviation (δ2
H) has
been quantified versus an established reference material (Vienna Standard Mean Ocean Water
(VSMOW); [Eq. IV]). The isotopic ratios of 1
H:2
H of the VSMOW standard is defined as 155.76±0.1
ppm (0.00015576). Both, the δ13
C and the δ2
H values are reported in the permill (‰) notation.
(
( )
( )
)
(
( )
( )
)
[Eq. IV]
Typically, biological reactions discriminate against the heavier stable isotope (2
H and 13
C)
and select for 1
H and 12
C, resulting in products which are depleted in 1
H and 12
C relative to 2
H
and 13
C, respectively. Naturally-derived microbial lipids depleted in 13
C and 2
H relative to their
standard show in general negative δ2
H and δ13
C values, respectively.
I.3.2.1. Analysis of natural abundance stable carbon isotope
In the past, most isotopic analysis on organic matter focused primarily on the ratio of 13
C
to 12
C. The distribution of these naturally occurring isotopes in lipid biomarkers can provide
information on the carbon substrate, and/or the carbon fixation pathway of the source
organisms. For example, in settings such as marine hydrothermal or cold seep environments,
where life is largely supported by chemosynthesis [BOX I], the isotopic composition of carbon is
a powerful tool. For instance, the isotopic analysis of cell wall membrane lipids and whole cells
of microbes involved in AOM (see section I.1.4.2) and their potential organic carbon substrates
have been used as a tool to reveal metabolic pathways of carbon assimilation (e.g., Elvert et](https://image.slidesharecdn.com/54c05e1e-ddfa-426e-bc0d-230967ccb1b0-160817130319/75/PhD-thesis_Matthias-Kellermann-45-2048.jpg)
![Page | 26
Introduction and Methods
Kellermann (2012)
CHAPTER1
al., 1999; Hinrichs et al., 1999; Hinrichs and Boetius, 2002; Orphan et al., 2002; Blumenberg et
al., 2004). These authors hypothesized that the carbon assimilation during AOM yields carbon
isotopic values of the methane oxidizing ANMEs (e.g., archaeol and hydroxyarchaeol) which are
15–50‰ depleted relative to methane as the proposed carbon substrate (Fig. I.13).
Cross Reference: During the process of AOM, the formation of biomass from anaerobic methanotrophic
archaea is generally thought to be related to methane as their dominant carbon source. This assumption will
be discussed and also questioned in [Chapter III].
The distribution of 13
C in natural systems is affected by thermodynamic reactions and
kinetic fractionation processes.Thermodynamic fractionation, on the one hand, is an important
process between reservoirs where the carbon exchange is slow enough to approach isotopic
equilibrium. Typically the associated isotope effects of these pure physical reactions are small.
For example, the exchange between CO2
in the air and the dissolved inorganic carbon (DIC =
CO3
2–
+ HCO3
–
+ H2
CO3
+ CO2aq
) in seawater causes an unequal isotope distribution between
the dissolved species (Pearson, 2010). On the other hand, the kinetic fractionation, during
biologically-mediated carbon transfers, has a stronger control on the 13
C distribution. Thus,
biochemical reactions that convert one carbon molecule (e.g., CO2
and or CH4
) into organic
matter show large fractionation effects, whereas heterotrophic reactions, using complex
organic matter as substrates, have small fractionation effects. This biological turnover leads to
12
C enrichment in the products and a 13
C enrichment in the residue of the substrates.The extent
of the preferential incorporation of the isotopically light 12
C into the biomass within Bacteria
and Archaea (biological fractionation) has been associated with different carbon–fixation
pathways (metabolic mode of the organism; cf. Hayes et al., 2001; House et al., 2003; Holler et
al., 2009; Pearson, 2010).
To effectively track the carbon fixation pathway of microorganisms the isotopic
composition of the potential substrate has to be known (You are what you eat!; De Niro
and Epstein, 1976). Therefore, to characterize the food web of microorganisms, the isotopic
composition of total organic carbon (TOC), dissolved inorganic carbon (DIC) and hydrocarbon
gases such as methane are important parameters in geochemical studies. Fig. I.13 provides an
overview of common δ13
C ranges of various carbon reservoirs and organisms found in nature.](https://image.slidesharecdn.com/54c05e1e-ddfa-426e-bc0d-230967ccb1b0-160817130319/75/PhD-thesis_Matthias-Kellermann-46-2048.jpg)
![Introduction and Methods
Kellermann (2012)
CHAPTER1
Page | 27
-130 -120-140 -110 -100 -80 -70 -60 -50 -40 -30 -20 -10 0 10-90
-130-140 -120 -110 -100 -80 -70 -60 -50 -40 -30 -20 -10 0 10-90
δ13
C
marine carbonates
marine bicarbonate
atmospheric CO2
higher plants (C3, C4, CAM)
marine plants
methanogenic Archaea
CH4
(abiogenic?, mantle?)
CH4
(biogenic)
CH4
(thermogenic)
AOM-carbonates (recent)
methanotrophic Archaea (AOM)
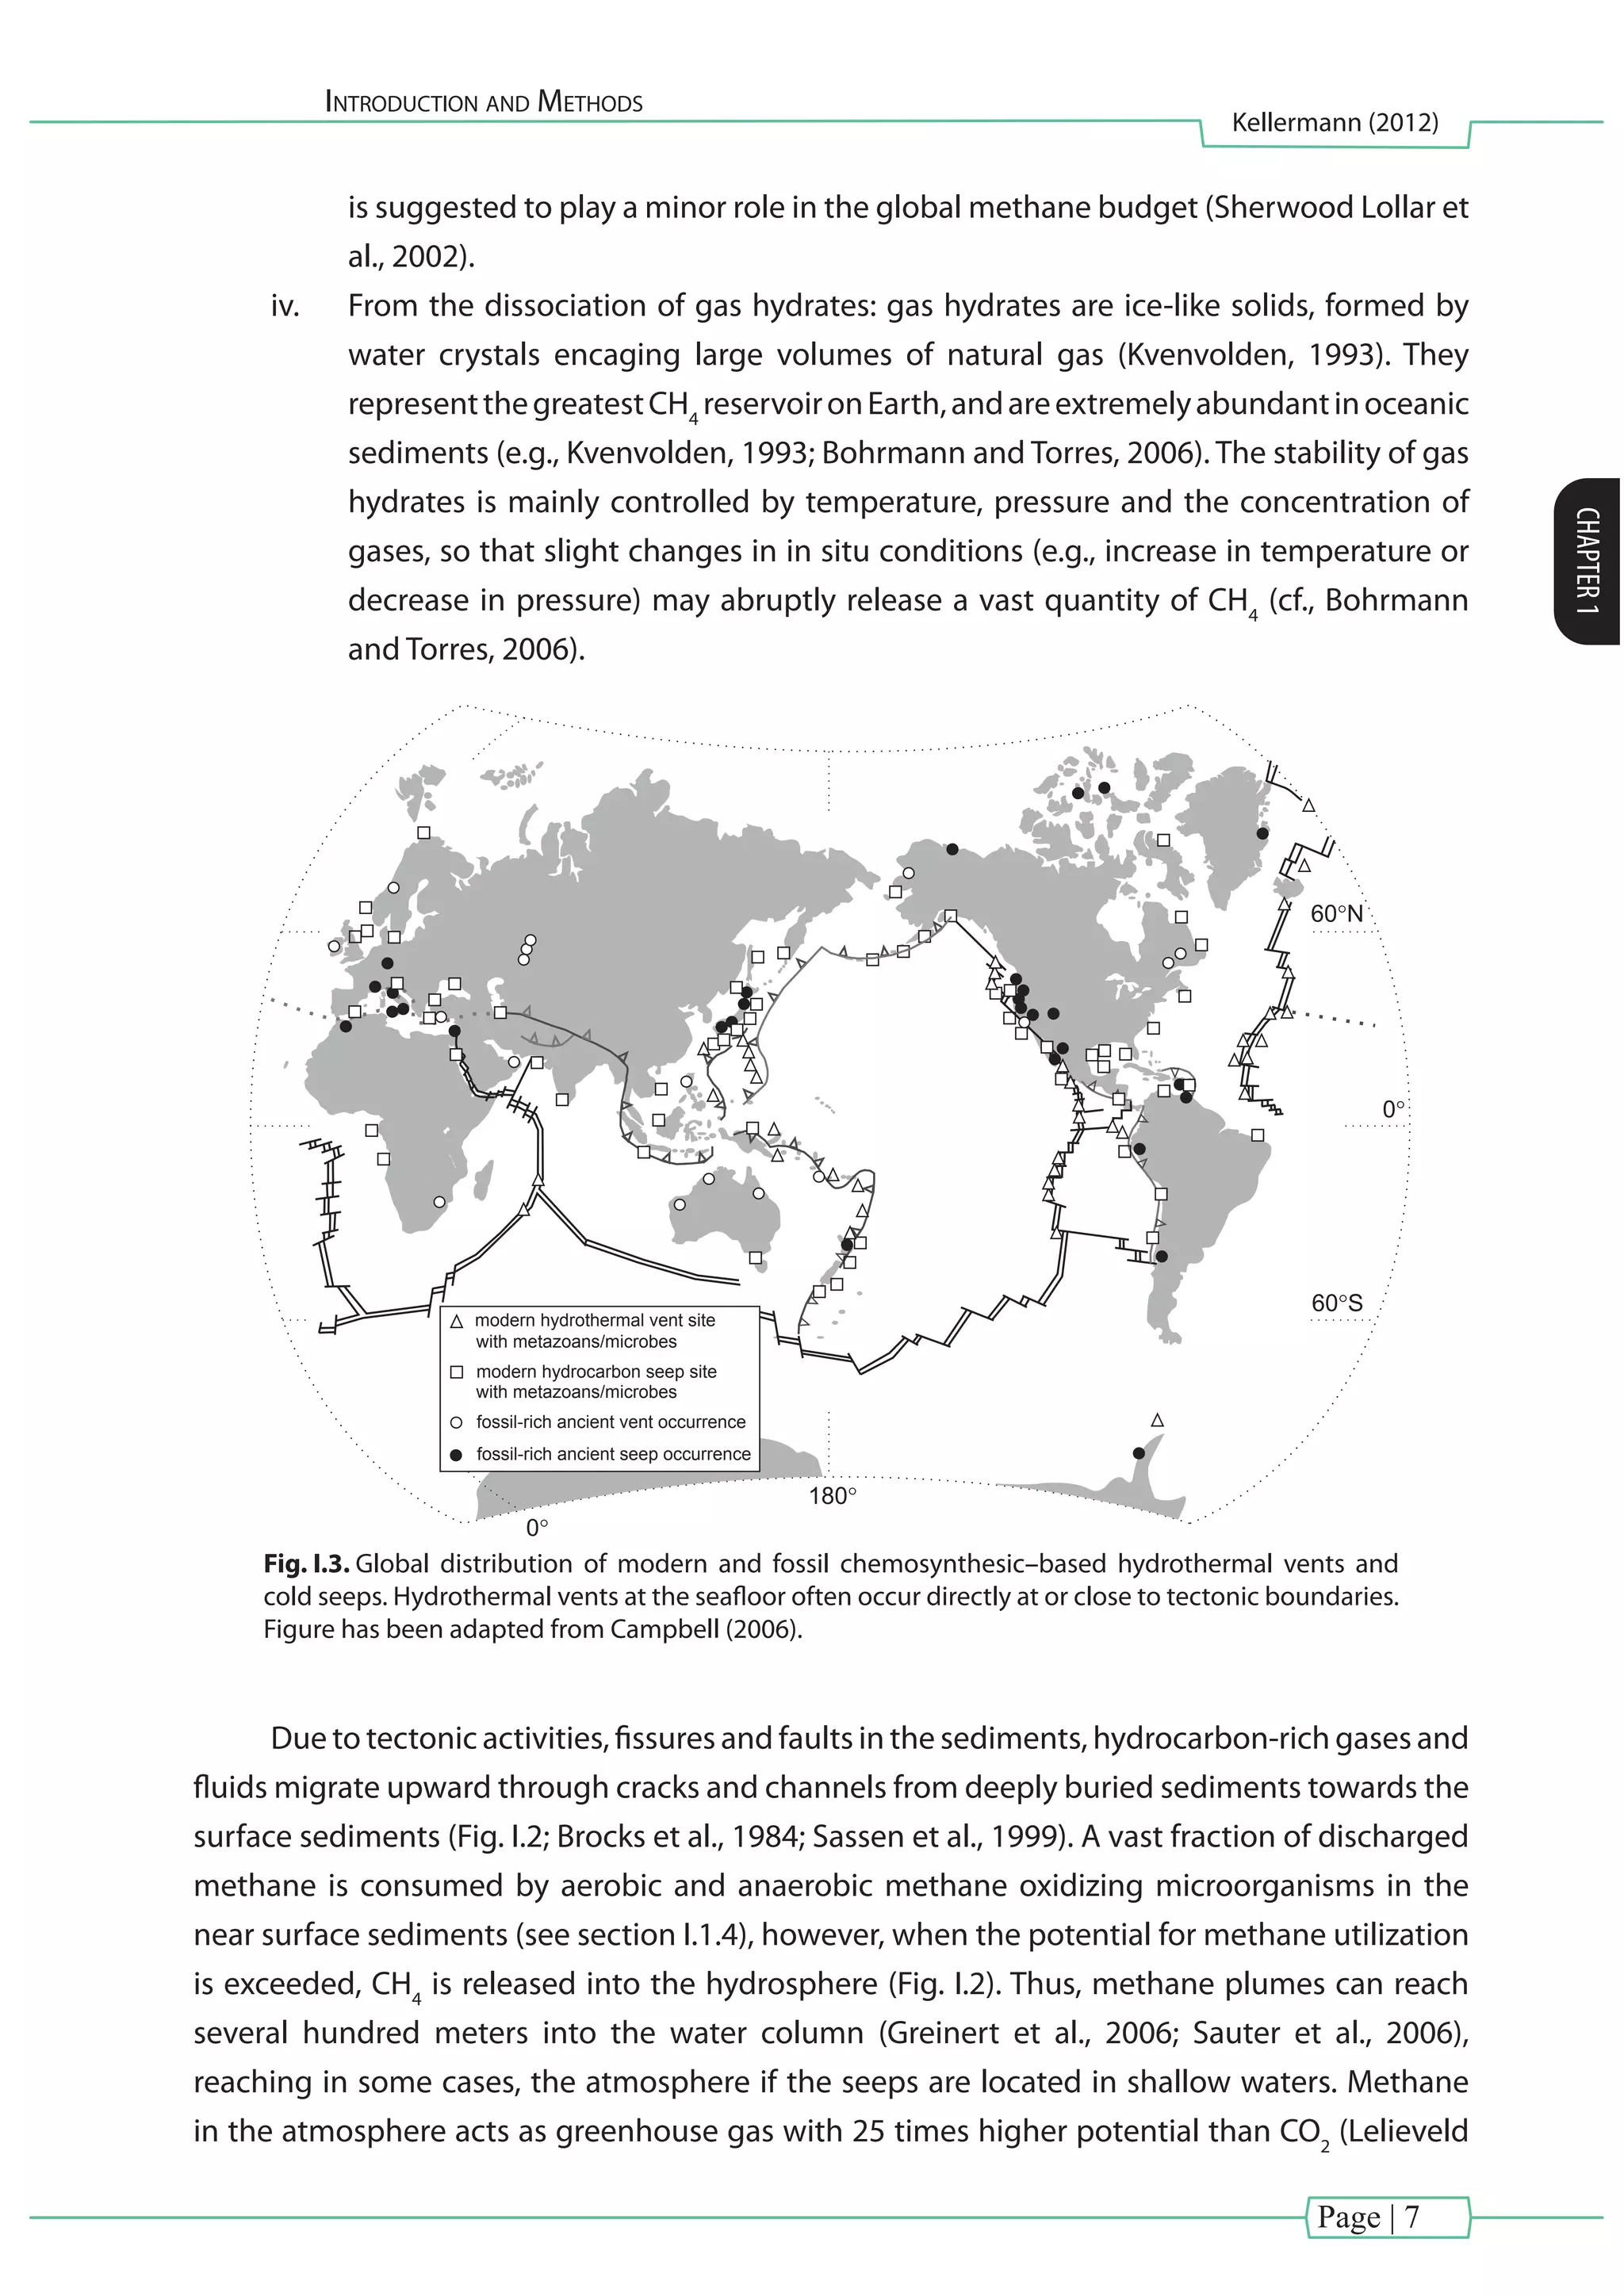
Fig. I.13. Summary of δ13
C ranges of mostly marine carbon reservoirs and organisms. The most important
carbon reservoirs dealt with in this dissertation are highlighted in red. Figure has been modified after
Blumenberg et al. (2010).
I.3.2.2. Natural abundance and stable hydrogen isotope analysis
Besides carbon, stable hydrogen isotope compositions of lipid compounds can also
be analyzed by GC–IRMS. As already shown for carbon, variability in lipid δ2
H values can also
be a useful tracer for biogeochemical processes (Hoering, 1974). The hydrogen content of
the organic matter is originally derived from the ambient water (Estep and Hoering, 1980).
In contrast to terrestrial waters, marine waters only show little variations in δ2
H on a spatial
and temporal scale (Schmidt et al., 1999), making hydrogen in the marine realm a potential
marker to track biogeochemical processes. Up to now, only little is known about the usefulness
of measurements of microbial lipids from marine systems. However, a few studies have
investigated the D/H ratios of lipids derived from marine organisms, resulting for example in
large, systematic differences within one compound class (e.g., fatty acids; Jones et al., 2008),
among different compound classes (e.g., n–alkyl and isoprenoid species, Sessions et al., 1999)
but also showed alterations in δ2
H within alkenones associated to changes in temperature,
salinity or growth rate (Schouten et al., 2006; van der Meer et al., 2007, 2008). Just recently, an
extensive survey of lipid δ2
H values, ranging from –32 to –348‰, from marine sources including
short– and long–chain n–alkanes, n–alcohols, and n–acids, steroids and hopanoids and also
archaeal isoprenoids emphasized strong fractionations associated with particular metabolic
capabilities of its producing organism (Li et al., 2009).
Cross Reference: The large and systematic differences among isoprenoidal chains (–150 to –290‰) and
different FAs (–86 to –230‰) have also been observed in [Chapter III]. This chapter extracted a natural
enrichment dominated by thermophilic ANME–1 and their partner bacteria from the HotSeep–1 cluster
(Holler et al., 2011).](https://image.slidesharecdn.com/54c05e1e-ddfa-426e-bc0d-230967ccb1b0-160817130319/75/PhD-thesis_Matthias-Kellermann-47-2048.jpg)
![Page | 28
Introduction and Methods
Kellermann (2012)
CHAPTER1
I.3.2.3. Stable isotope probing experiments of lipid biomarkers
Stable isotope probing (SIP) is a cultivation–independent approach which attempts to
identify microorganisms responsible for specific metabolic processes. SIP experiments rely on
the incorporation of a substrate, usually enriched in its heavier stable isotope (e.g., 13
C or 2
H),
which in turn will result in biomolecules (e.g., lipids, carbohydrates, DNA, RNA, protein) with
positiveisotopicvalueswhenthesubstrateisusedassourceduringbiosynthesis.FirstSIPstudies
combined 13
C labeling (13
C–acetate and 13
CH4
) with isotopic analysis of lipid biomarkers such as
phospholipid derived fatty acids (PLFAs) by isotope–ratio mass spectrometry (IRMS) (Boschker
et al., 1998). Up to date, lipid biomarker SIP is a popular approach since this biomolecule class
is extremely sensitive to GC–IRMS analysis and requires only low amounts of label assimilation
(Hayes et al., 1990; Brenna et al., 1997).
Until now, lipid-based SIP experiments focused mainly on the apolar, hydrophobic
moieties such as bacterial PLFAs (Boschker et al., 1998; Webster et al., 2006; Bühring et al., 2006)
or archaeal di–and tetraether lipids (Blumenberg et al., 2005; Wegener et al., 2008; [Chapter
III]). However, some of these SIP studies combined free and intact lipid pools, thereby mixing
signals from dead and living microbial biomass. Particularly the pool size of archaeal lipids such
as fossil/core GDGTs in marine sediments, have been shown to greatly outnumber membrane
lipids derived from living biomass (intact GDGTs), by up to one order of magnitude (Lipp and
Hinrichs, 2009; Liu et al., 2010, 2011), thus leading to a substantial isotope dilution, minimizing
the sensitivity of lipid–SIP.
Cross Reference: [Chapter III andV] are two SIP studies tracking the assimilation of 13
C labeled into bulk and
intact derived microbial lipids, respectively.
I.3.2.4. Dual SIP experiments
Justrecently,Wegenerandcoworkers(inrevision)introducedtheconceptofduallabeling,
using 13
C–labeled bicarbonate (13
CDIC
) and deuterated water (D2
O) as tracers.They reported that
the sulfate–reducer Desulfosarcina variabilis incorporates H2
from water protons to build up the
majority of its lipids, independent of the carbon fixation pathway. Hence assimilation of D2
O
can be used as sensitive tool to measure total lipid production (via assimilation of deuterated
protons from water), whereas the assimilation of inorganic carbon (determined via 13
CDIC
uptake
in lipids) indicates autotrophy. In addition, the ratio of inorganic carbon assimilation to total
lipid production yields an estimation of auto– and heterotrophic carbon fixation, without
addition of further labeled carbon sources.
Cross Reference: In [Chapter III] we performed a dual labeling study using 13
C–labeled bicarbonate (13
CDIC
)
and deuterated water (D2
O) and identify the AOM performing archaea and their sulfate-reducing bacterial
partner as mainly autotrophs.](https://image.slidesharecdn.com/54c05e1e-ddfa-426e-bc0d-230967ccb1b0-160817130319/75/PhD-thesis_Matthias-Kellermann-48-2048.jpg)
![Introduction and Methods
Kellermann (2012)
CHAPTER1
Page | 29
I.3.2.5. IPL–SIP: Intramolecular isotopic analysis on individual IPLs
To overcome the problems of a mixed signal derived from fossil and intact lipids normal
phase liquid chromatography has been shown to be sufficient for excluding the apolar sample
matrix from different groups of IPLs (e.g., Biddle et al., 2006; Schubotz et al., 2011b). However, in
order to purify individual IPLs, new purification protocols using a set of orthogonal columns of
normal– and reversed–phases have been applied (Lin et al., in preparation). The advantage of
IPL-SIP has been shown, for the first time, by Popendorf and coworkers (2011), who combined
SIP (using 13
C–bicarbonate and 13
C–glucose) and preparative HPLC (to separate individual IPLs),
in order to reveal bacteria–specific photoautotrophic and heterotrophic lipid production in
surface ocean waters.
Furthermore, recent and ongoing developments in sample purification together with
improved protocols for the chemical hydrolysis of individual IPLs (Lin et al., 2010; Lin et al., in
preparation) established the possibility to study the carbon assimilation not only within the
hydrophobic moieties (e.g., FAs and isoprenoidal chains) but also the polar components of
individual IPLs (i.e. glycerol and their headgroup; Fig. I.12).
Cross Reference: [Chapter V] unambiguously presents the advantage of IPL-SIP over TLE-SIP.](https://image.slidesharecdn.com/54c05e1e-ddfa-426e-bc0d-230967ccb1b0-160817130319/75/PhD-thesis_Matthias-Kellermann-49-2048.jpg)
![Page | 30
Introduction and Methods
Kellermann (2012)
CHAPTER1
I.4. Structure and main objectives of this thesis
In this thesis, lipid biomolecules and carbon metabolism of aerobic and anaerobic
chemosynthetic microorganisms at cold seeps and hot vents were examined by using and
improving state-of-the-art geochemical techniques.
[Chapter II] focused on the aerobic oxidation of reduced compounds (e.g., CH4
and
H2
S) by chemosynthetic microorganisms living in symbiosis inside mussels from the genus
Bathymodiolus. We analyzed a suite of lipids in muscle and gill tissues from Bathymodiolus,
collected from methane seeps and sulfide-rich hydrothermal vents. This chapter examined
symbiont–host interactions using a holistic lipid biomarker approach by investigating IPLs,
BHPs, FAs and sterols.
Research question:
• What are the advantages of IPL analysis over the traditional biomarker approach
regarding the characterization of bacterial and eukaryotic biomass?
• Can methane– and sulfur–oxidizing symbionts be differentiated by their biomarker
signatures and their stable carbon isotopic composition?
• Does the semi-quantitative IPL analysis allow an estimation of the abundance of
symbionts living in the gills of the host?
[Chapter III] of this thesis investigated carbon fixation during thermophilic anaerobic
oxidation of methane (AOM). Natural enrichments from the Guaymas Basin, which were
dominated by ANME-1 and sulfate-reducing bacteria from the HotSeep–1 cluster (Holler et al.,
2011)wereexaminedusingacombinedmultiple(13
CH4
and13
CDIC
)anddual(D2
Oand13
CDIC
)stable
isotope probing approach. Microbial biomass production was assessed as 13
C and D labeled
lipid biomarkers recovered at different time points (0, 10, 17 and 24 days) and treatments (with
and without methane at 37 or 50°C).
Research question:
• Which lipids are produced by the organisms performing AOM at elevated
temperatures?
• What are the roles of methane and inorganic carbon as carbon sources for
microorganisms involved in the thermophilic AOM?
• What are the patterns of microbial lipid production in presence and absence of
methane?
• What is the relative importance of heterotrophic and autotrophic carbon fixation at
different temperatures?](https://image.slidesharecdn.com/54c05e1e-ddfa-426e-bc0d-230967ccb1b0-160817130319/75/PhD-thesis_Matthias-Kellermann-50-2048.jpg)
![Introduction and Methods
Kellermann (2012)
CHAPTER1
Page | 31
[Chapter IV] reveals a systematic fragmentation pattern from archaeal IPLs during high
performance liquid chromatography electrospray ionization mass spectrometry. Analyzed IPLs
were exclusively retrieved from environmental samples; thereby this work is particularly useful
for a rapid and straightforward characterization of intact archaeal membrane lipids.
In [Chapter V] we studied the assimilation of inorganic carbon during thermophilic AOM
into individual archaeal IPLs. This chapter merges the recent advances in preparative HPLC
together with newly developed protocols for chemical hydrolysis of IPLs. The assimilation of
13
C–labeled bicarbonate was evaluated as follows: (1) archaeal IPLs vs. bulk lipids (TLE); (2)
among individual IPLs (di- and tetraethers); (3) intramolecular analysis (isoprenoids, sugar
moieties and glycerol backbone).
Research question:
• How strong does the large pool of fossil archaeal lipids influence the actual 13
C
uptake of the living archaeal community?
• Can adaptations of archaea to thermophilic environments be identified by the IPL
distribution?
• What are the patterns of label assimilation into isoprenoidal side chains, sugar
headgroups and glycerol moieties of individual lipids?
• What can be told from IPL-SIP: Towards de novo synthesis of biomass in Archaea.](https://image.slidesharecdn.com/54c05e1e-ddfa-426e-bc0d-230967ccb1b0-160817130319/75/PhD-thesis_Matthias-Kellermann-51-2048.jpg)
![Page | 32
Introduction and Methods
Kellermann (2012)
CHAPTER1
I.5. Contribution to publications
This PhD thesis enfolds three first–author and one second–author manuscripts
prepared for publication in international journals [Chapters II–V]. [Chapter II] and [Chapter
IV] are published and [Chapter III] and [Chapter V] are ready for submission. All other co–
author contributions are summarized in the [Appendix] containing manuscript abstracts in
combination with their most significant figure.
[Chapter II]
Symbiont–host relationships in chemosynthetic mussels: A comprehensive lipid
biomarker study.
Matthias Y. Kellermann, Florence Schubotz, Marcus Elvert, Julius S. Lipp, Daniel Birgel,
Xavier Prieto Mollar, Nicole Dubilier, Kai–Uwe Hinrichs
N.D. and K.–U.H. designed the project; N.D. provided the samples; M.Y.K. extracted,
analyzed and evaluated lipid data with help from F.S., M.E., J.S.L., D.B., X.P.M.; M.Y.K. and
F.S. wrote the paper with input of all co–authors.
Published in Organic Geochemistry 43, 112–124.
doi:10.1016/j.orggeochem.2011.10.005
[Chapter III]
Dual isotopic probing reveals dominant autotrophic carbon fixation in methane–rich
sediments from the Guaymas Basin.
Matthias Y. Kellermann, Gunter Wegener, Marcus Elvert, Marcos Y. Yoshinaga, Yu–Shih Lin,
Thomas Holler, Xavier Prieto Mollar, Kai–Uwe Hinrichs
M.Y.K., G.W. and Y.S.L. designed the project; G.W. and T.H. provided the samples; M.Y.K.
extracted, analyzed and evaluated lipid data with help from M.E., M.Y.Y., X.P.M.; M.Y.K.,
G.W. and M.Y.Y. wrote the manuscript with input of all co–authors.
In preparation for Geochimica et Cosmochimica Acta.](https://image.slidesharecdn.com/54c05e1e-ddfa-426e-bc0d-230967ccb1b0-160817130319/75/PhD-thesis_Matthias-Kellermann-52-2048.jpg)
![Introduction and Methods
Kellermann (2012)
CHAPTER1
Page | 33
[Chapter IV]
Systematic fragmentation patterns of archaeal intact polar lipids by HPLC/ESI/ITMS.
Marcos Y. Yoshinaga, Matthias Y. Kellermann, Pamela E. Rossel, Florence Schubotz, Julius
S. Lipp, and Kai–Uwe Hinrichs.
M.Y.Y. and M.Y.K. designed the project; M.Y.Y., M.Y.K. and P.E.R. provided the samples;
M.Y.Y., M.Y.K. and P.E.R. extracted, analyzed and evaluated lipid data and M.Y.Y. wrote the
manuscript with input of all co–authors.
Published in Rapid Communication in Mass Spectrometry 25, 3563–3574.
doi: 10.1002/rcm.5251
[Chapter V]
Stable isotope probing of an anaerobic methane–oxidizing enrichment provides clues on
archaeal tetraether lipid biosynthesis.
MatthiasY. Kellermann, MarcosY.Yoshinaga, GunterWegener,Yu–Shih Lin,Thomas Holler,
and Kai–Uwe Hinrichs
M.Y.K., M.Y.Y. and G.W. designed the project; G.W. and T.H. provided the samples; M.Y.K.
extracted, analyzed and evaluated lipid data with help from M.Y.Y., G.W. and Y.S.L.; M.Y.K.,
M.Y.Y. and G.W. wrote the manuscript with input of all co–authors.
In preparation for Geochimica et Cosmochimica Acta.](https://image.slidesharecdn.com/54c05e1e-ddfa-426e-bc0d-230967ccb1b0-160817130319/75/PhD-thesis_Matthias-Kellermann-53-2048.jpg)

![Page | 35
Bacterial symbiosis in mussels
Kellermann (2012)
CHAPTER2
[Chapter II] - Bacterial symbiosis in mussels
Symbiont–host relationships in chemosynthetic mussels: A comprehensive
lipid biomarker study
Matthias Y. Kellermann a
*, Florence Schubotz a1
, Marcus Elvert a
, Julius S. Lipp a
,
Daniel Birgel a,c
, Xavier Prieto-Mollar a
, Nicole Dubilier b
, Kai-Uwe Hinrichs a
Published in Organic Geochemistry
Vol: 43 (2012), page: 112–124, doi:10.1016/j.orggeochem.2011.10.005
© 2011 Elsevier Ltd. All rights reserved.
a
Organic Geochemistry Group, MARUM Center for Marine Environmental Sciences & Department of
Geosciences, University of Bremen, Leobener Strasse, D-28359 Bremen, Germany
b
Max Planck Institute for Marine Microbiology, Celsiusstr. 1, D-28359 Bremen, Germany
c
Department of Geodynamics and Sedimentology, University of Vienna, Althanstrasse 14, A-1090
Vienna, Austria
1
Present address: Department of Earth, Atmospheric and Planetary Sciences, Massachusetts Institute
of Technology, Cambridge, MA 02139, USA.
* Corresponding author.
Tel.: +49 421 218 65742; Fax: + 49 421 218 65715
E–mail address: kellermann.matthias@gmail.com
Keywords:
symbionts | Bathymodiolus mussels| methane oxidizers | sulfur oxidizers | lipid biomarker | intact
polar lipids | bacteriohopanepolyols | fatty acids | sterols | stable carbon isotopes](https://image.slidesharecdn.com/54c05e1e-ddfa-426e-bc0d-230967ccb1b0-160817130319/75/PhD-thesis_Matthias-Kellermann-55-2048.jpg)
![Page | 37
Bacterial symbiosis in mussels
Kellermann (2012)
CHAPTER2
the interface between reduced fluid and oxidized fluid (Petersen and Dubilier, 2010).
Bathymodiolus mussels have been found in association with sulfur-oxidizing (Cavanaugh,
1983;Disteletal.,1988)ormethane-oxidizingbacteria(Childressetal.,1986);specimenshosting
both groups of these Gammaprotobacteria have also been described (Fisher et al., 1993).
Bacterial symbiosis in Bathymodiolus mussels has been identified via transmission electron
microscopy (Childress et al., 1986; Fisher et al., 1987), molecular methods such as comparative
16S rRNA sequence analysis (Eisen et al., 1992), fluorescence in situ hybridization (Duperron
et al., 2005, 2007; Riou et al., 2008) and carbon incorporation experiments using isotopically
labelled CH4
or HCO3
-
for identification of methanotrophic or thiotrophic symbiont uptake
pathways (Fisher et al., 1987; Scott and Cavanaugh, 2007; Riou et al., 2010). A distinct lipid
fingerprint of an endosymbiotic microorganism was first described by Gillan and coworkers
(1988) and was further specified with regard to the function of the symbiont by way of analysis
of compound specific stable carbon isotopic compositions (e.g. Fang et al., 1993; Abrajano et
al., 1994; Jahnke et al., 1995; Pond et al., 1998).
Thebiomassandlipidbiomarkersofseepandventcommunitiesbecomestronglydepleted
in 13
C when the chemosynthetic bacteria incorporate 13
C depleted methane (Summons et al.,
1994) or metabolites derived from autotrophic carbon fixation (Ruby et al., 1987). Specifically,
diagnostic biomarkers of aerobic methanotrophic bacteria in cultures (Makula, 1978; Nichols
et al., 1985; Bowman et al., 1991) and the environment (e.g. Pond et al., 1998; Niemann et al.,
2006) are monounsaturated C16
fatty acids (FAs) with double bonds at positions ω7, ω8 and ω9,
methylsteroids(e.g.Bouvieretal.,1976;ConwayandMcDowell-Capuzzo,1991;Fangetal.,1992;
Elvert and Niemann, 2008; Birgel and Peckmann, 2008) and hopanoids (e.g. Rohmer et al., 1984;
Summons et al., 1994; Elvert and Niemann, 2008; Birgel et al., 2011). Many groups of bacteria
also contain bacteriohopanepolyols (BHPs) which have been suggested to act as membrane
stabilizers (Ourisson and Rohmer, 1982; Ourisson et al., 1987). BHPs are useful microbial markers
because of organism-specific functionalization of the hopanoid side chain, e.g. BHPs with a
terminal NH2
group (aminopentol and aminotetrol) are indicative of methanotrophic bacteria
(Talbot et al., 2001).
Intact polar membrane lipids (IPLs) are thought to reflect the presence of intact cells and
thus viable biomass (White et al., 1979; Rütters et al., 2002; Sturt et al., 2004). In combination
with conventional biomarkers [e.g. polar lipid-derived FAs (PLFAs)], IPLs provide additional
taxonomic information encoded in their head group. Therefore, a quantitative overview of
the major IPLs together with PLFA analysis provides a more holistic characterization of the
active microbial community (cf. Fang et al., 2000; Rütters et al., 2002). Phospholipids are crucial
membrane components of all living cells and comprise the most common IPLs in the bacterial
and eukaryotic domain (Goldfine, 1984; Dowhan, 1997; Zhang and Rock, 2008). Bacteria can
often be distinguished from Eukarya on the basis of their combined head group and core
lipid composition. In general, Bacteria typically contain glycerol-based phospholipids, with
two FA chains in the range C14
to C20
(Zhang and Rock, 2008). For example, methanotrophic
bacteria have been described to produce phospholipids with phosphatidylglycerol](https://image.slidesharecdn.com/54c05e1e-ddfa-426e-bc0d-230967ccb1b0-160817130319/75/PhD-thesis_Matthias-Kellermann-57-2048.jpg)
![Page | 38
Bacterial symbiosis in mussels
Kellermann (2012)
CHAPTER2
(PG), phosphatidylethanolamine (PE), phosphatidylmethylethanolamine (PME) and
phosphatidyldimethylethanolamine (PDME) head groups, containing predominantly C16:1
and
C18:1
FAs (Fang et al., 2000). Information on sulfide oxidizers is scarcer, but DPG, PE and PG were
shown to be the dominant IPL classes in thiotrophic bacteria isolated from thyasirid bivalves
(Fullarton et al., 1995). For comparison, different species of marine and freshwater eukaryotic
molluscs are dominated mainly by two types of phospholipids: (i) glycerol- and plasmalogen-
based lipids with phosphatidylcholine (PC) and PE head groups and (ii) sphingolipids with
phosphono-based head groups, e.g. ceramide phosphonoethylamine (PnE-Cer; Matsubara et
al., 1990; Kostetsky and Velansky, 2009; Colaço et al., 2009). The core lipids of PnE-Cer in marine
molluscs typically comprise C16:0
FA (Matsubara et al., 1990).
This study aimed to examine symbiont–host interactions using a comprehensive lipid
biomarker approach. It targets IPLs as a lipid class that captures the overall distribution of
bacterial and eukaryotic biomass between the symbiont and the host. IPLs were specifically
utilized for the detection of different symbiont types and to assess their distribution within
three Bathymodiolus mussel species from both vent and seep environments. In addition, FAs,
BHPs and selected methyl sterols were chosen as target compounds because they encode
specific information about various bacteria and enable, along with their compound-specific
stable carbon isotopic composition, the determination of the dominant symbiotic lifestyle of
the mussels. Three different types of symbiotic associations were chosen: one host species
containing methanotrophic symbionts [B. childressi from the Gulf of Mexico (GoM; Duperron
et al., 2007)], a second containing thiotrophic symbionts [B. cf. thermophilus from the Pacific
Antarctic Ridge (PAR; Petersen and Dubilier, unpublished data)] and a third with both
methanotrophic and thiotrophic symbionts [B. brooksi from the GoM (Duperron et al., 2007)].
Lipid biomarkers were extracted from the symbiont containing gill tissue and the symbiont-
free foot tissue, with the latter serving as a reference for the host’s lipid signature.
II.3. Material and methods
II.3.1. Sample collection and storage
B. brooksi and B. childressi were collected in October 2003 using the deep sea submersible
Alvin during the Deep Sea Cruise 11 Leg I at a cold seep in the GoM near the Alaminos Canyon
(26°21.320N, 94°30.120W, 2226 m water depth). B. cf. thermophilus was recovered in June 2001
using a TV controlled grab during the RV Sonne cruise SO 157 on the PAR near the Foundation
Chain (from station 30 GTV at 37°47.4430S, 110°54.8340W, 2212 m water depth). Mussels were
dissected on board into gill and foot tissue, except for B. childressi, for which only gill tissue was
collected. Samples were stored at -20°C until analysis.
II.3.2. Lipid extraction
Mussel tissue (between 70 and 250 mg dry mass) from one individual per species was](https://image.slidesharecdn.com/54c05e1e-ddfa-426e-bc0d-230967ccb1b0-160817130319/75/PhD-thesis_Matthias-Kellermann-58-2048.jpg)
![Page | 40
Bacterial symbiosis in mussels
Kellermann (2012)
CHAPTER2
reaction mixture was left to stand overnight. BHPs were analyzed via atmospheric pressure
chemical ionization liquid chromatography/multi-stage ion trap mass spectrometry (APCI-LC/
MSn
) according to Talbot et al. (2001). The high performance liquid chromatography (HPLC)
instrument was equipped with a reversed phase column (Alltech Prevail C18
, 150 x 2.1 mm, 3 µm,
Alltech, München, Germany) and a guard column of the same packing material (7.5 x 2.1 mm).
The APCI source was operated in positive ionization mode. Prior to injection, the acetylated
fraction of the extract was dissolved in MeOH/propan-2-ol (60:40 v/v). Separation was achieved
using three different eluents (A, MeOH; B, deionized water; C, propan-2-ol) with the following
linear gradient: 90% A and 10% B (0–5 min); 59% A, 1% B and 40% C (at 45 min) and hold for 25
min. The flow rate was 0.2 mL min-1
. APCI vaporizer temperature was 400°C, discharge current
was 5 µA and sheath gas flow was 40 (arbitrary units).
To determine δ13
C values of BHPs, we converted BHPs to hopanols (Rohmer et al., 1984;
Innes et al., 1997), which were analyzed by way of GC-isotope ratio (IR)-MS. In brief, an aliquot of
theasphaltenefractionwasstirredfor1hatroomtemperaturewithperiodicacid(H5
IO6
;300mg
in 3 mL tetrahydrofuran/water (8:1 v/v)). After addition of water, the resulting aldehydes were
extracted with petroleum ether and the extract was evaporated. Subsequently, the aldehydes
were reduced to primary alcohols by stirring for 1 h at room temperature with NaBH4
in EtOH.
After addition of KH2
PO4
the mixture was extracted with petroleum ether, evaporated and the
resulting hopanols were derivatized with BSTFA in pyridine prior to GC–IR-MS analysis.
II.3.5. Intact polar lipids
The TLE was dissolved in 5:1 CH2
Cl2
/MeOH and an aliquot directly analyzed using
HPLC without further treatment (Thermo- Finnigan Surveyor HPLC equipped with a 150 x 2.1
mm, 5 µm LiChrospher Diol-100 column fitted with a 7.5 x 2.1 mm guard column of the same
packing material; Alltech GmbH,Munich, Germany) coupled to an ion-trap mass spectrometer
(ThermoFinnigan LCQ Deca XP Plus) equipped with an electrospray ion source in positive and
negative ionization mode. HPLC analysis was conducted with gradients described by Sturt et
al. (2004) [eluent A: n-hexane, 2- propanol, formic acid and NH3
(79:20:0.12:0.04, v:v:v); eluent
B: propan-2-ol, water, formic acid and NH3
(90:10:0.12:0.04) at 0.2 mL min-1
]. Identification of
the phospholipids was performed largely in positive mode according to published MS data,
whereas the negative mode provided information about the molecular mass of the acyl
moieties (Matsubara et al., 1990; Fang and Barcelona, 1998; Rütters et al., 2002; Sturt et al., 2004;
Zemski Berry and Murphy, 2004; Schubotz et al., 2009).
II.3.6. Quantification of symbiont- and host -derived IPLs
Absolute IPL concentration was estimated from peak areas of molecular ions in
extracted ion mass chromatograms relative to an internal standard (1-O-hexadecyl-2-acetoyl-
sn-glycero-3- phosphocholine; PAF). Relative response factors of individual IPL head group
classes were not accounted for. Since previous studies have shown that the response factor](https://image.slidesharecdn.com/54c05e1e-ddfa-426e-bc0d-230967ccb1b0-160817130319/75/PhD-thesis_Matthias-Kellermann-60-2048.jpg)
![Page | 41
Bacterial symbiosis in mussels
Kellermann (2012)
CHAPTER2
can vary significantly for IPLs with different head groups (e.g. Schubotz et al., 2009; Van Mooy
and Fredricks, 2010), reported IPL concentration values are semiquantitative. Response factors
of various commercially available authentic standards compared with PAF ranged from 0.5 to
2 (cf. Schubotz et al., 2009). This work consequently focuses on the relative distribution of IPLs
among different mussel species and tissues.
The distinction of symbiont- and host-derived IPLs was based on complementary MS
information obtained in positive and negative ionization mode during HPLC–ESI–MS analysis.
Symbiont specific FAs (largely C16:1
FAs; see section II.3.2) were identified in the negative
ionization mode and their corresponding IPL molecular ions (m/z 688 for PE-di-C16:1
and m/z
736 for PG-di-C16:1
) were extracted and quantified in the positive ion mode, resulting in an
approximation of symbiont- and host-derived IPLs.
II.3.7. Identification of plasmalogens
In contrast to PE–plasmalogens (1-O-alk-10-enyl-2-acyl glycerophospholipids),
which are clearly identifiable using HPLC–MS (Fig. II.3a; Zemski Berry and Murphy, 2004), PC-
plasmalogens are not unambiguously recognized since their MS2
fragment (m/z 184) is the
same as for PC-diacylglycerol (DAG). The presence of two PC containing IPL classes became
apparent after visualization of the chromatogram by way of 3D density maps (x – time, y – m/z,
z – intensity; Fig. II.1a). To test for the presence of PC plasmalogens, we used preparative HPLC
to obtain a fraction concentrated with IPLs with PC head groups. Preparation of fractions of
distinct IPL classes was achieved according to a protocol described by Biddle et al. (2006), but
with slight modification. We used a preparative LiChrospher Diol-100 column (250 x 10 mm, 5
µm, Alltech, Germany) connected to a ThermoFinnigan Surveyor HPLC instrument equipped
with a Gilson FC204 fraction collector. Flow rate was 1.5 mL min-1
and the eluent gradient was:
100% A (n-hexane/propan-2-ol; 79:20, v:v) to 100% B (propan-2-ol/water; 90:10, v:v) in 120 min,
then held at 100% B for 30 min, with 30 min column re-equilibration with 100% A. In total, 14
fractions were collected. Fraction 7 contained the fractions of IPLs with PC head groups and
we therefore used this fraction to convert potential PC plasmalogens to dimethyl acetals by
way of acid hydrolysis (Fig. II.1b and c; Rao et al., 1967). Thereby, an aliquot of fraction 7 was
blown down to dryness and treated with methanolic HCl [6 M HCl/MeOH (1:9, v/v)] at 50°C
overnight. Finally, MilliQ water was added and the solution extracted (4x) with n-hexane. The
organic phase was evaporated under a gentle stream of N2
and directly analyzed via GC–MS as
described above. Characteristic fragmentation patters confirmed the presence of plasmalogen-
derived dimethyl acetals during GC–MS analysis (Fig. II.1c).](https://image.slidesharecdn.com/54c05e1e-ddfa-426e-bc0d-230967ccb1b0-160817130319/75/PhD-thesis_Matthias-Kellermann-61-2048.jpg)
![Page | 42
Bacterial symbiosis in mussels
Kellermann (2012)
CHAPTER2
736
(16:1/16:1)
877
854
(20:1p/20:3) 826
(18:0p/20:3; 20:1p/18:2) 796
(18:0p/18:3) 768
742
718
732 (16:0/16:1)
536
(22:1)
556 (24:5)
524 (21:0)
756 (16:0/18:3)
784 (16:0/20:3)
812 (16:0/22:3)
866
840
PG
Plas-PC
lyso -PE
PnE-Cer
PC
643
(16:0)
506
(20:2)
25 30 35
500
600
700
800
900
Time (min)
m/z
(a)
20 25 35
C16:1
C16:0
C18:3
C18:2
C18:0
C20:3
C20:2
C22:3
C20:1
C20:1
18:0p
20:1p
RelativeAbundance
(b)
30
Time (min)
200
m/z
100
m/z
75.0
150 25050 50300 350
C
H
O
O
H3
C
H3
C
75.0
M+
- CH3
O
283.3
M+
314.3
200
m/z
100
m/z
75.0
150 250 300 350
C
H
O
O
H3
C
H3
C
75.0
M+
- CH3
O
309.5
M+
340.3
RelativeAbundance
(c)
Fig. II.1. (a) Partial density map showing distribution of intact polar lipid in preparative HPLC fraction
7 (F7) of B. brooksi (gill tissue). Numbers in bold refer to the molecular mass (Da), numbers in brackets
give information about the FA side chains (p indicates chain length of plasmalogen side chain). For
abbreviations of lipid names refer to the text or see Appendix II.1. (b) Gas chromatogram of FAMEs from
acidic transesterification of F7 (B. brooksi). Plasmalogens are converted to dimethyl acetals (highlighted
in grey). FA abbreviations characterize carbon chain length and number of double bonds. (c) Electron
impact mass spectra of the dimethyl acetals (left: C18:0p
, right: C20:1p
). Mass spectra of dimethyl acetals are
characterized by a typical base peak at m/z 75 [C3
H7
O2
]+
and a fragment ion [M-CH3
O]+
.
II.4. Results and discussion
II.4.1. IPL abundance and distribution in Bathymodiolus mussels
The IPLs in both gill and foot tissue of all three species were dominated by PE and PC (Fig.
II.2). The most abundant core lipid types were diacylglycerols (DAGs) and plasmalogens (Plass;
Fig. II.3a), followed by ceramides (Cers) and lyso-lipids. Total IPL concentration ranged from 2](https://image.slidesharecdn.com/54c05e1e-ddfa-426e-bc0d-230967ccb1b0-160817130319/75/PhD-thesis_Matthias-Kellermann-62-2048.jpg)
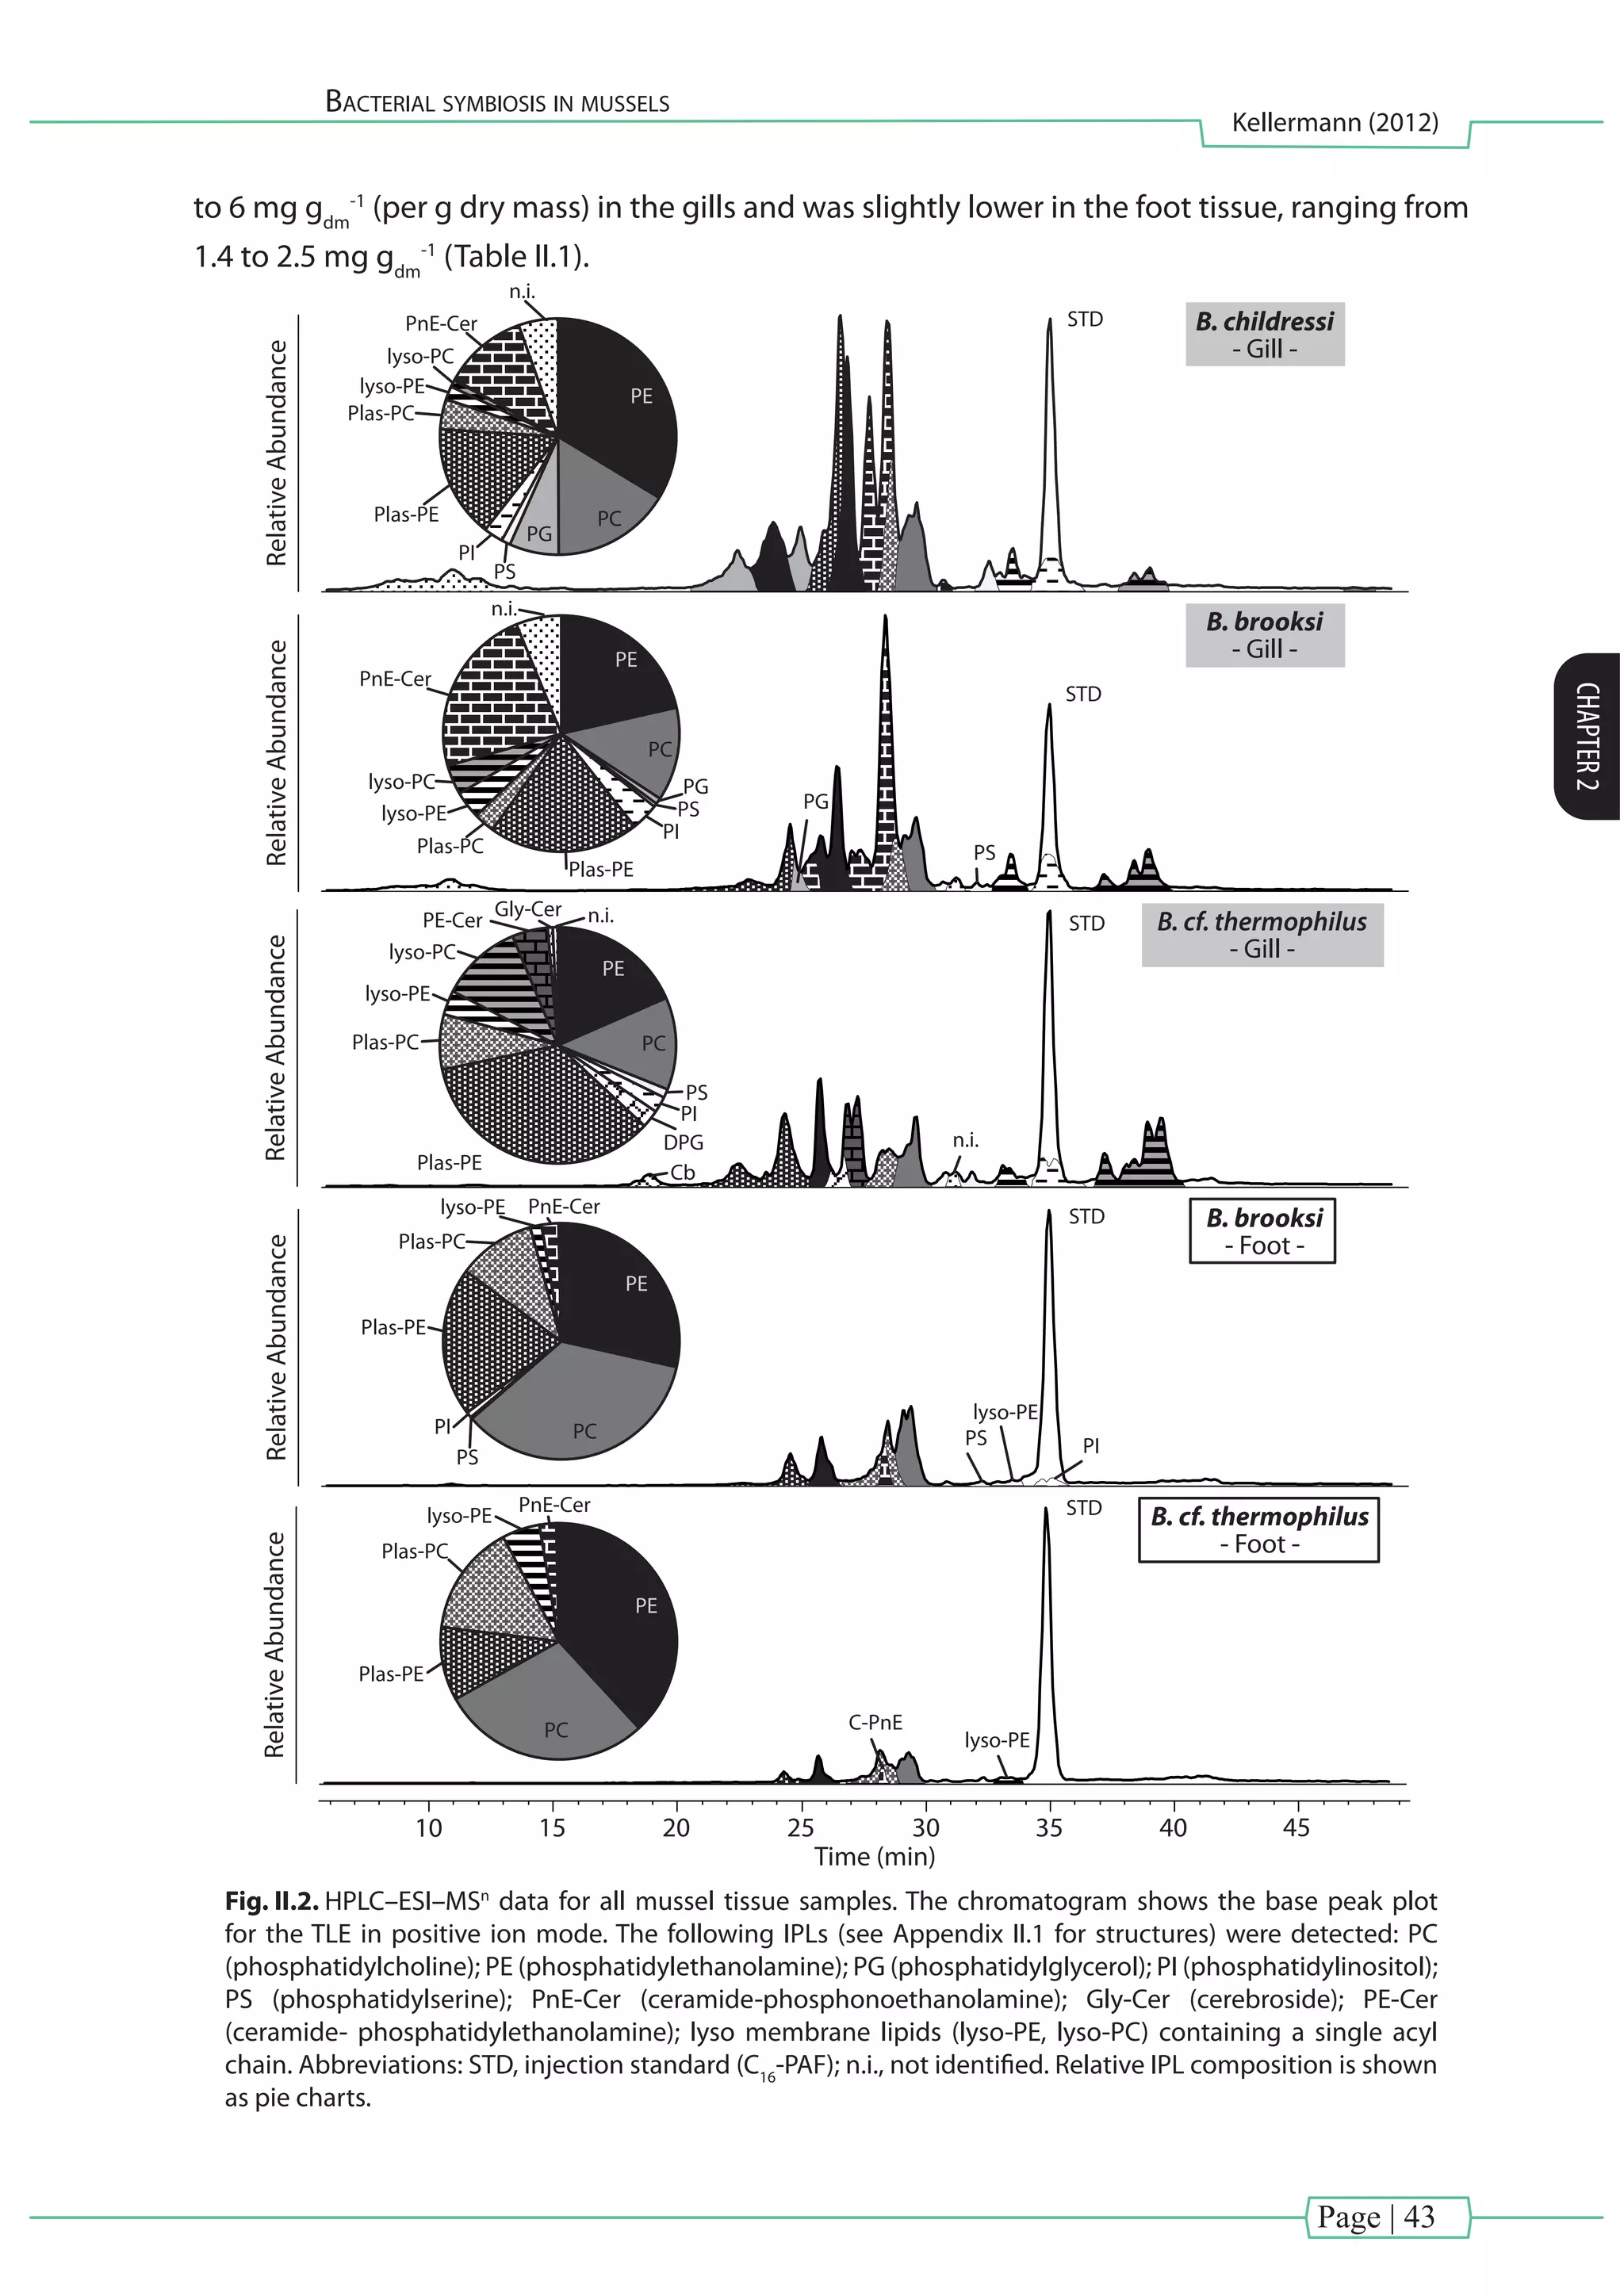
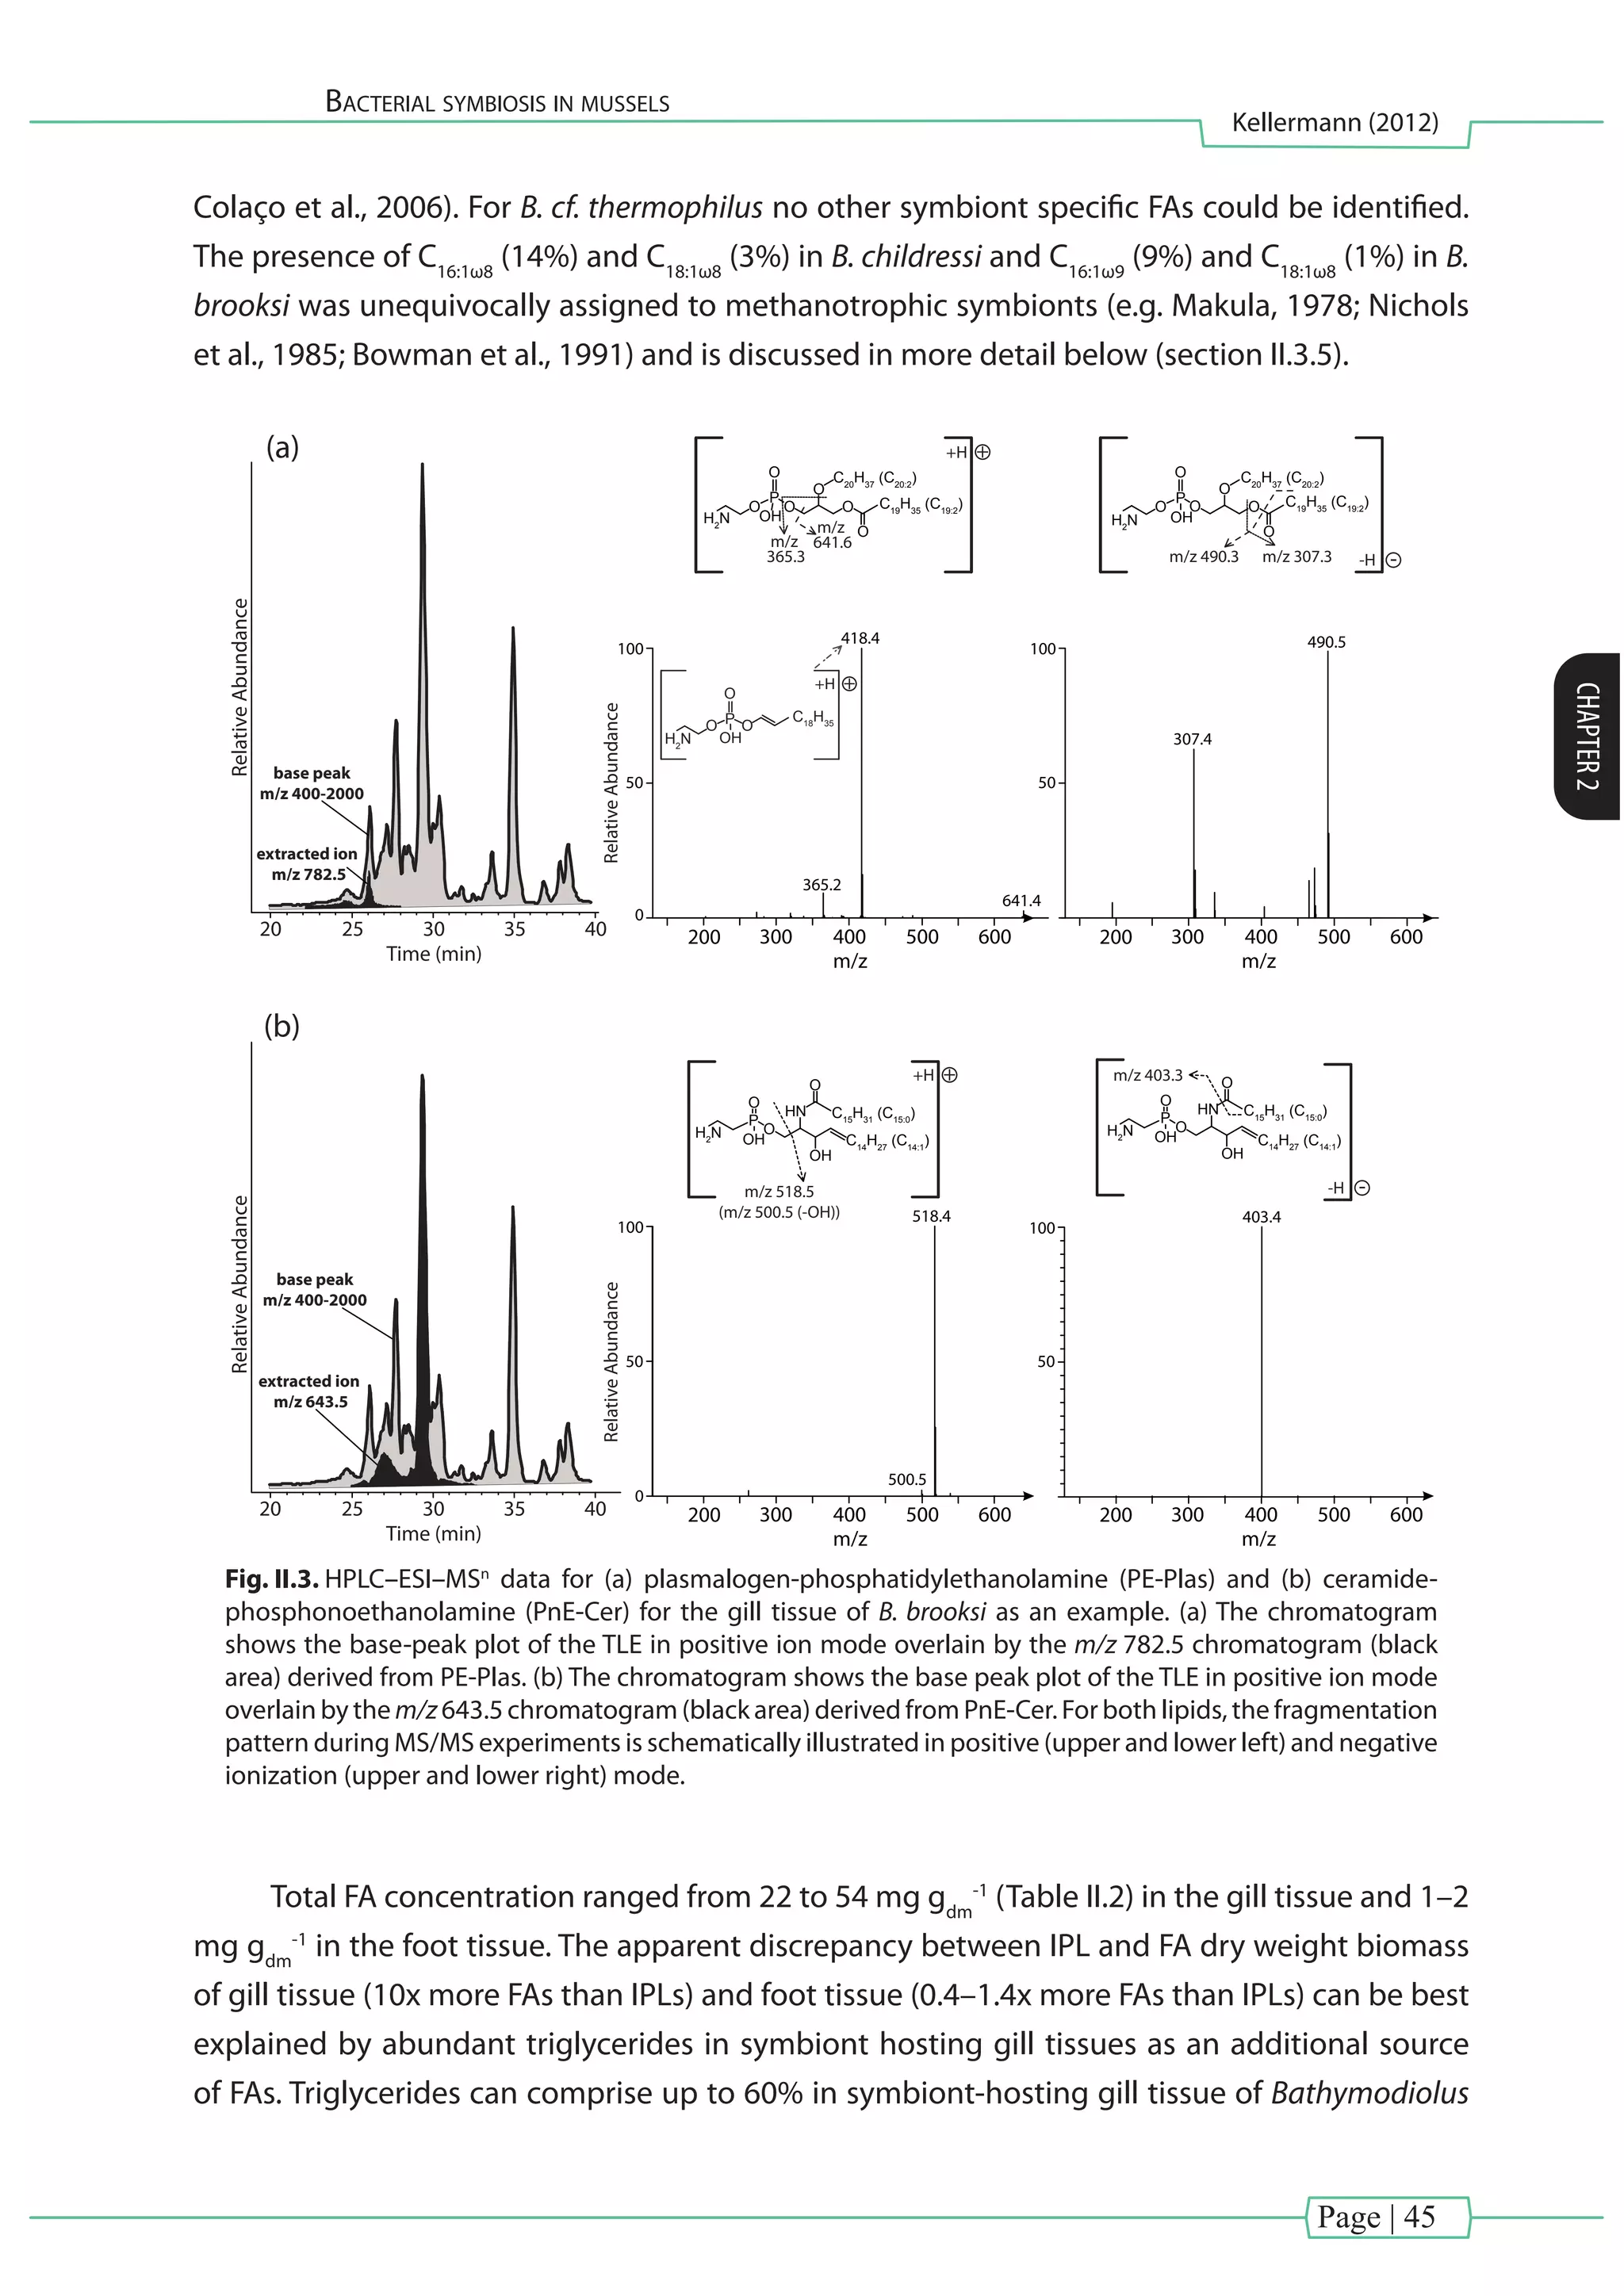
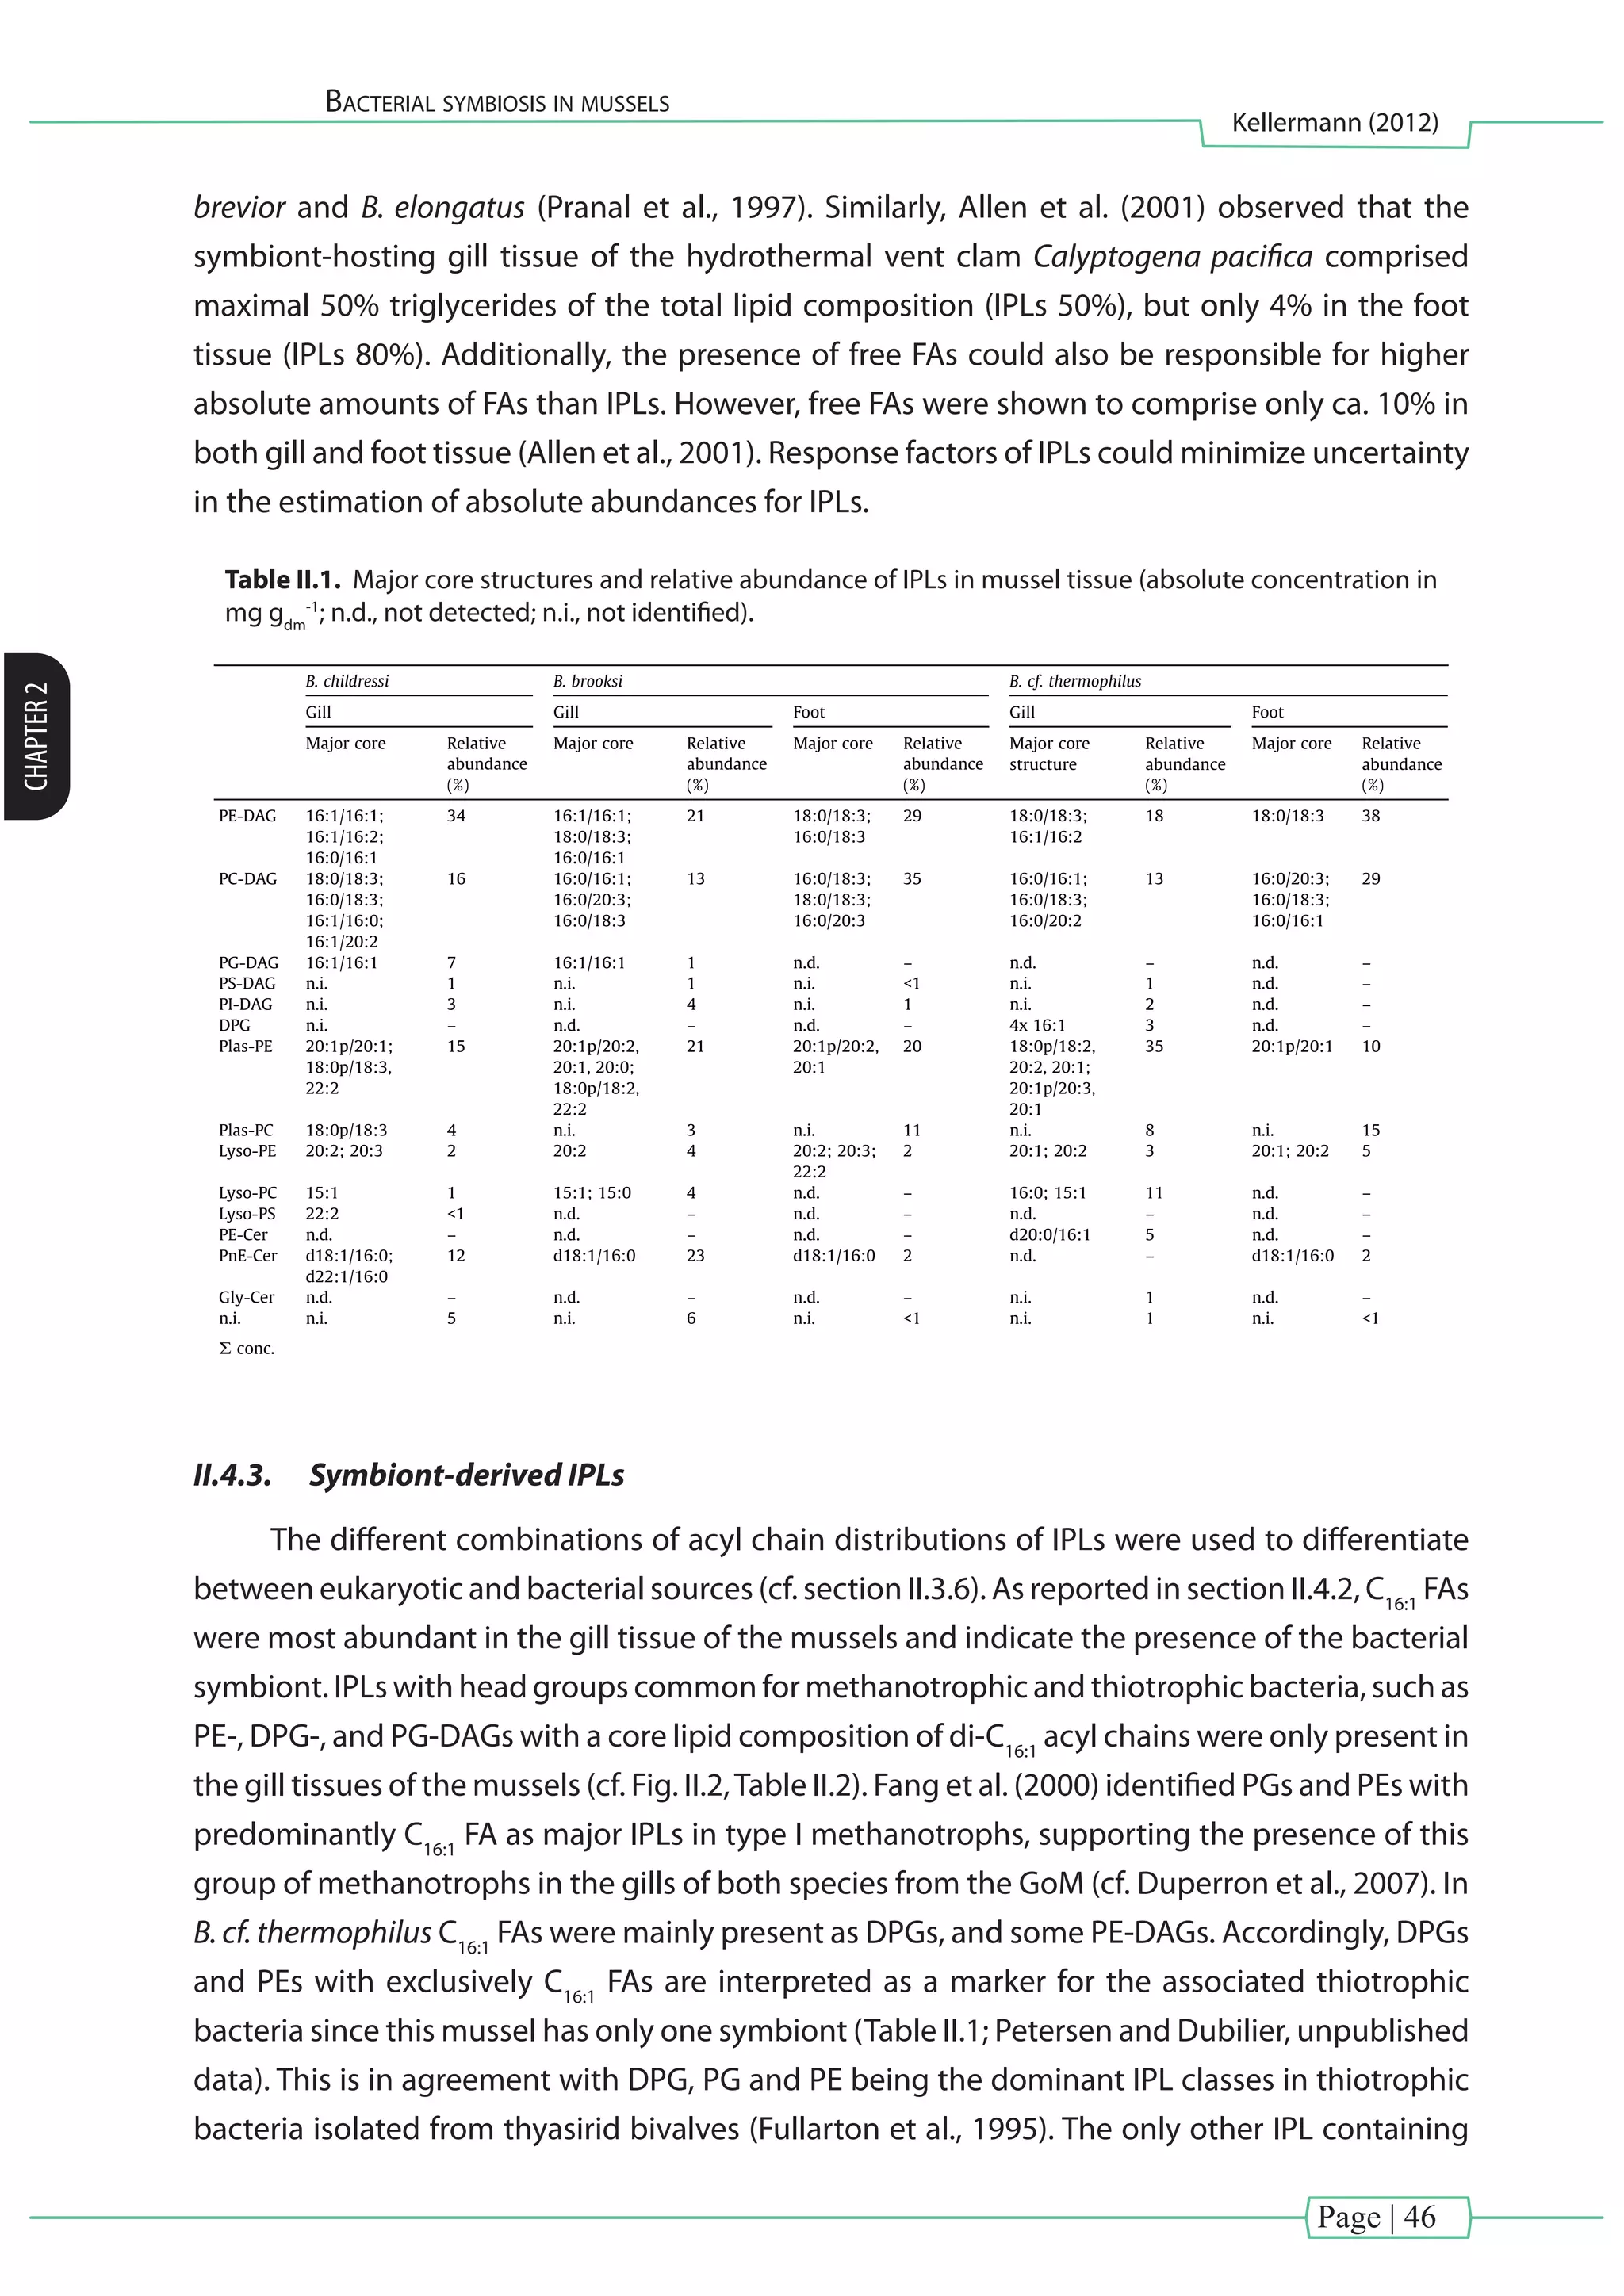
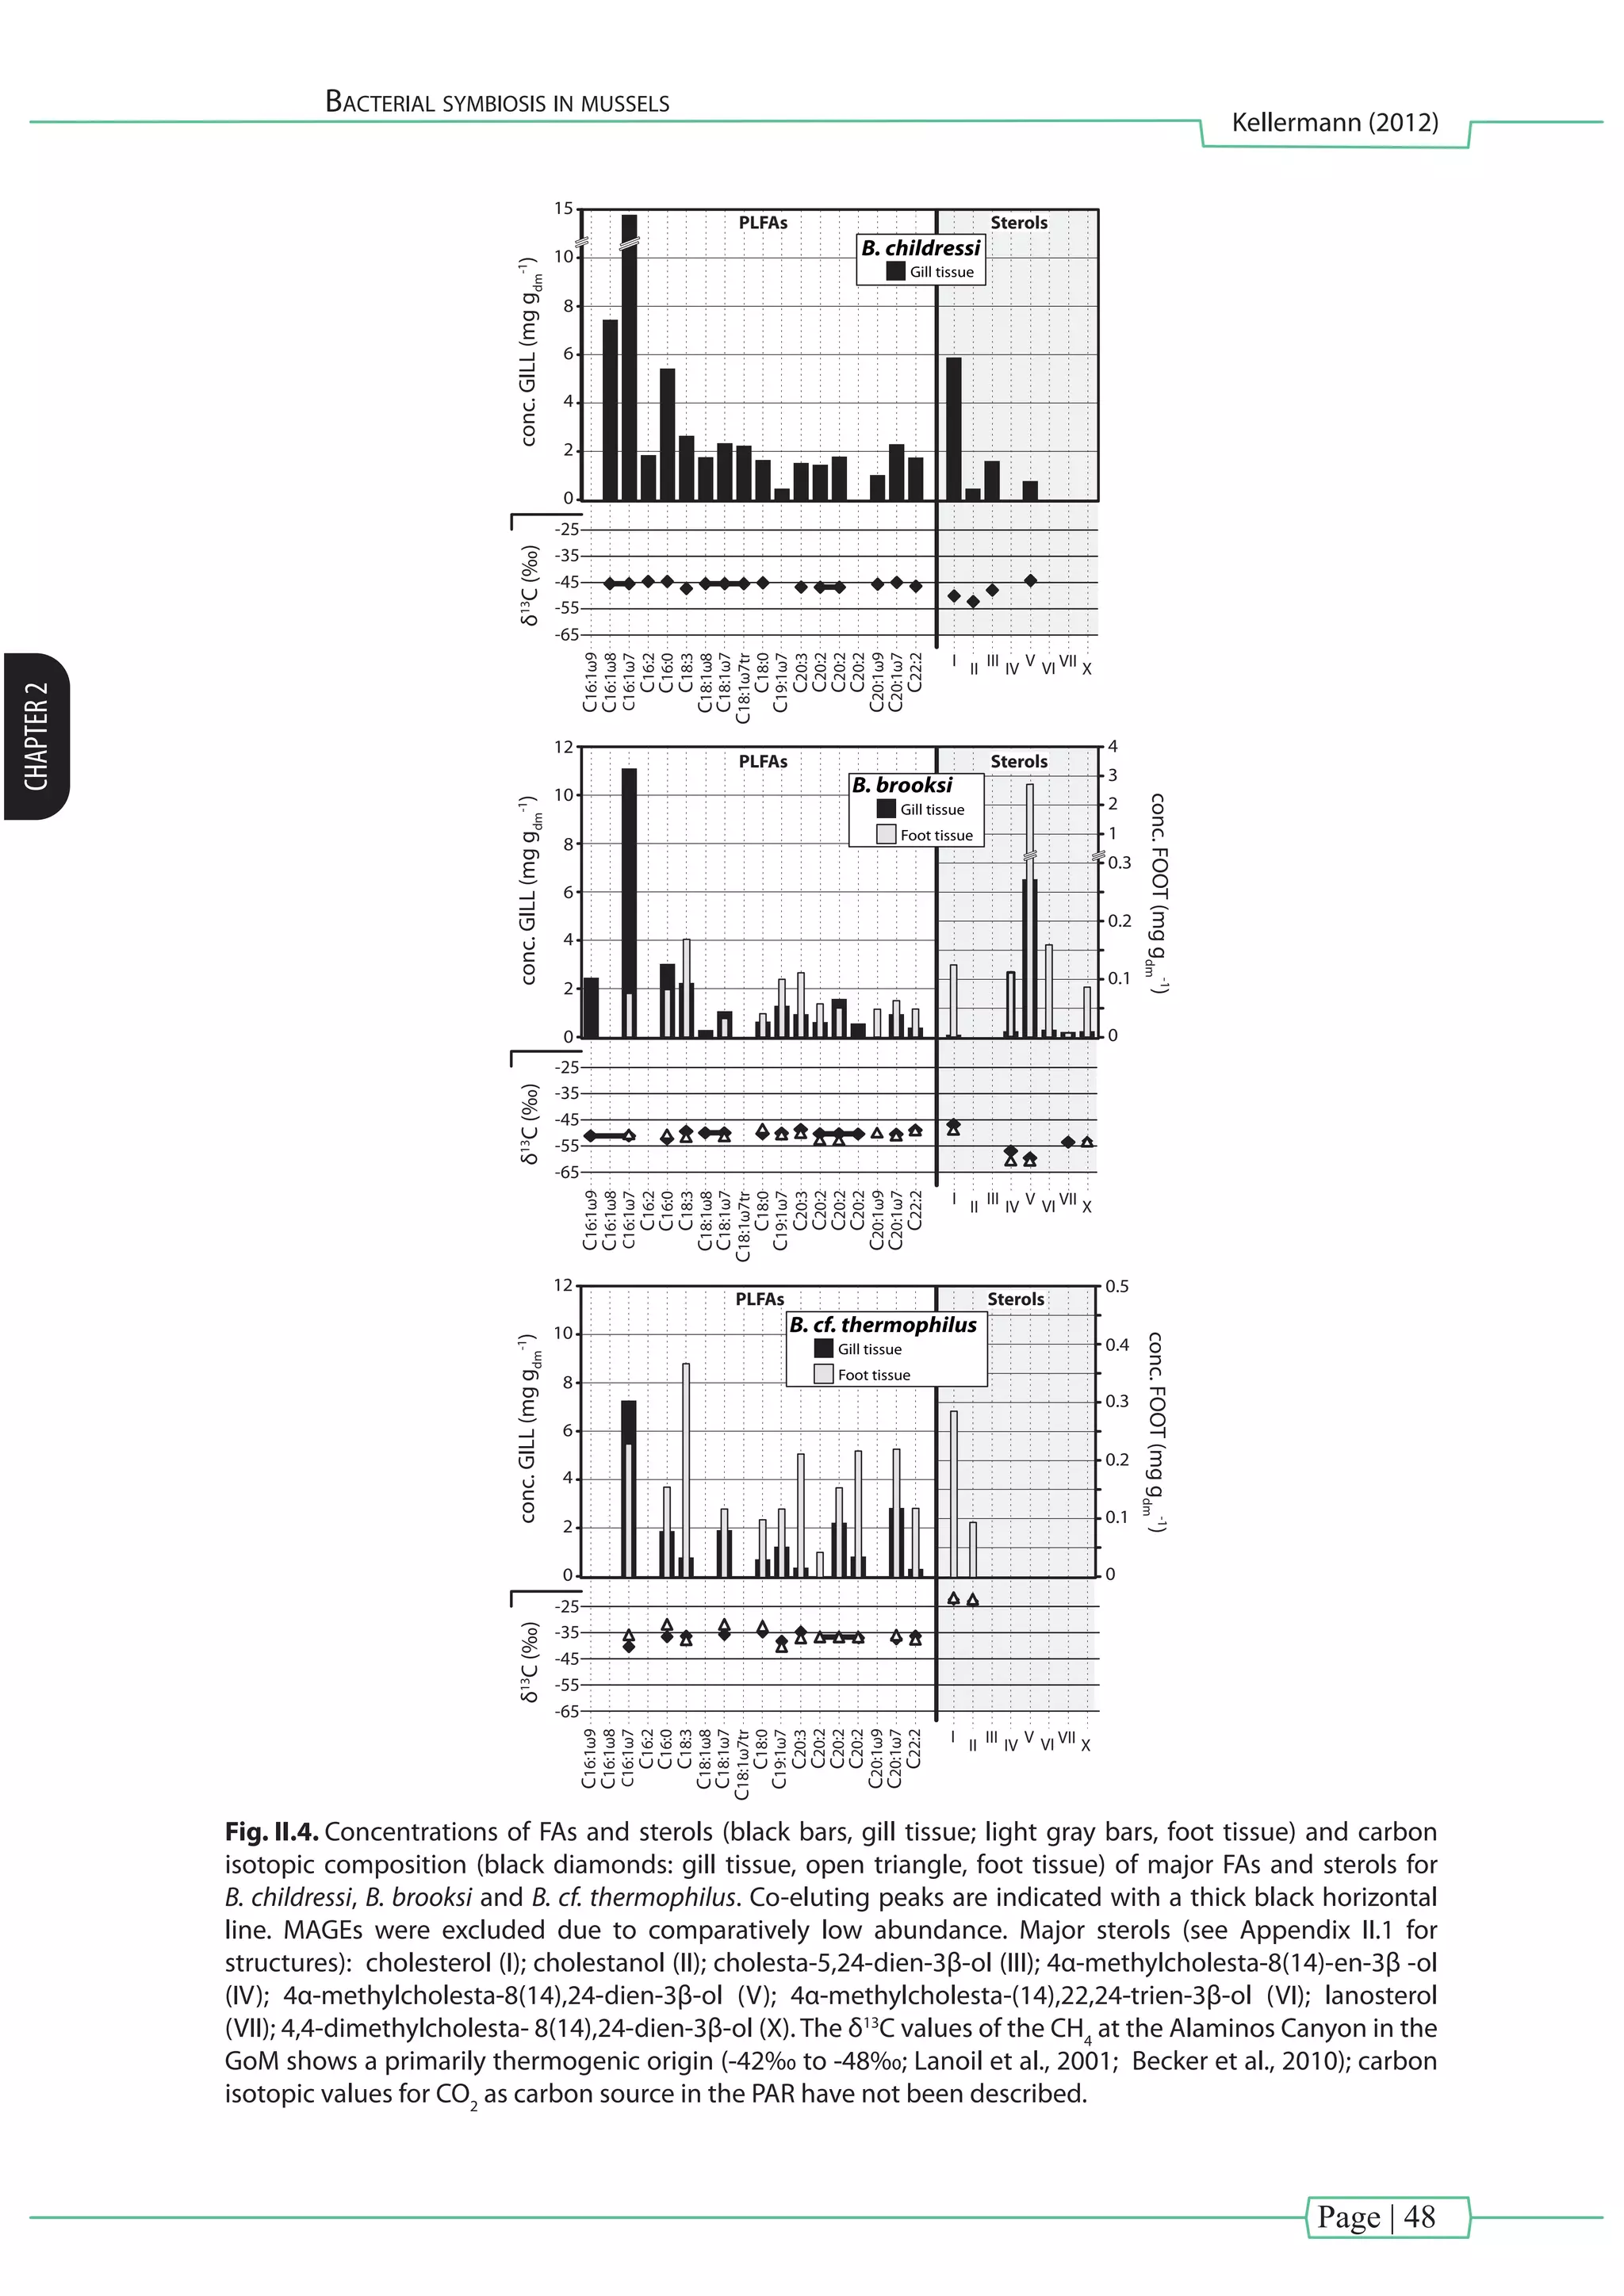
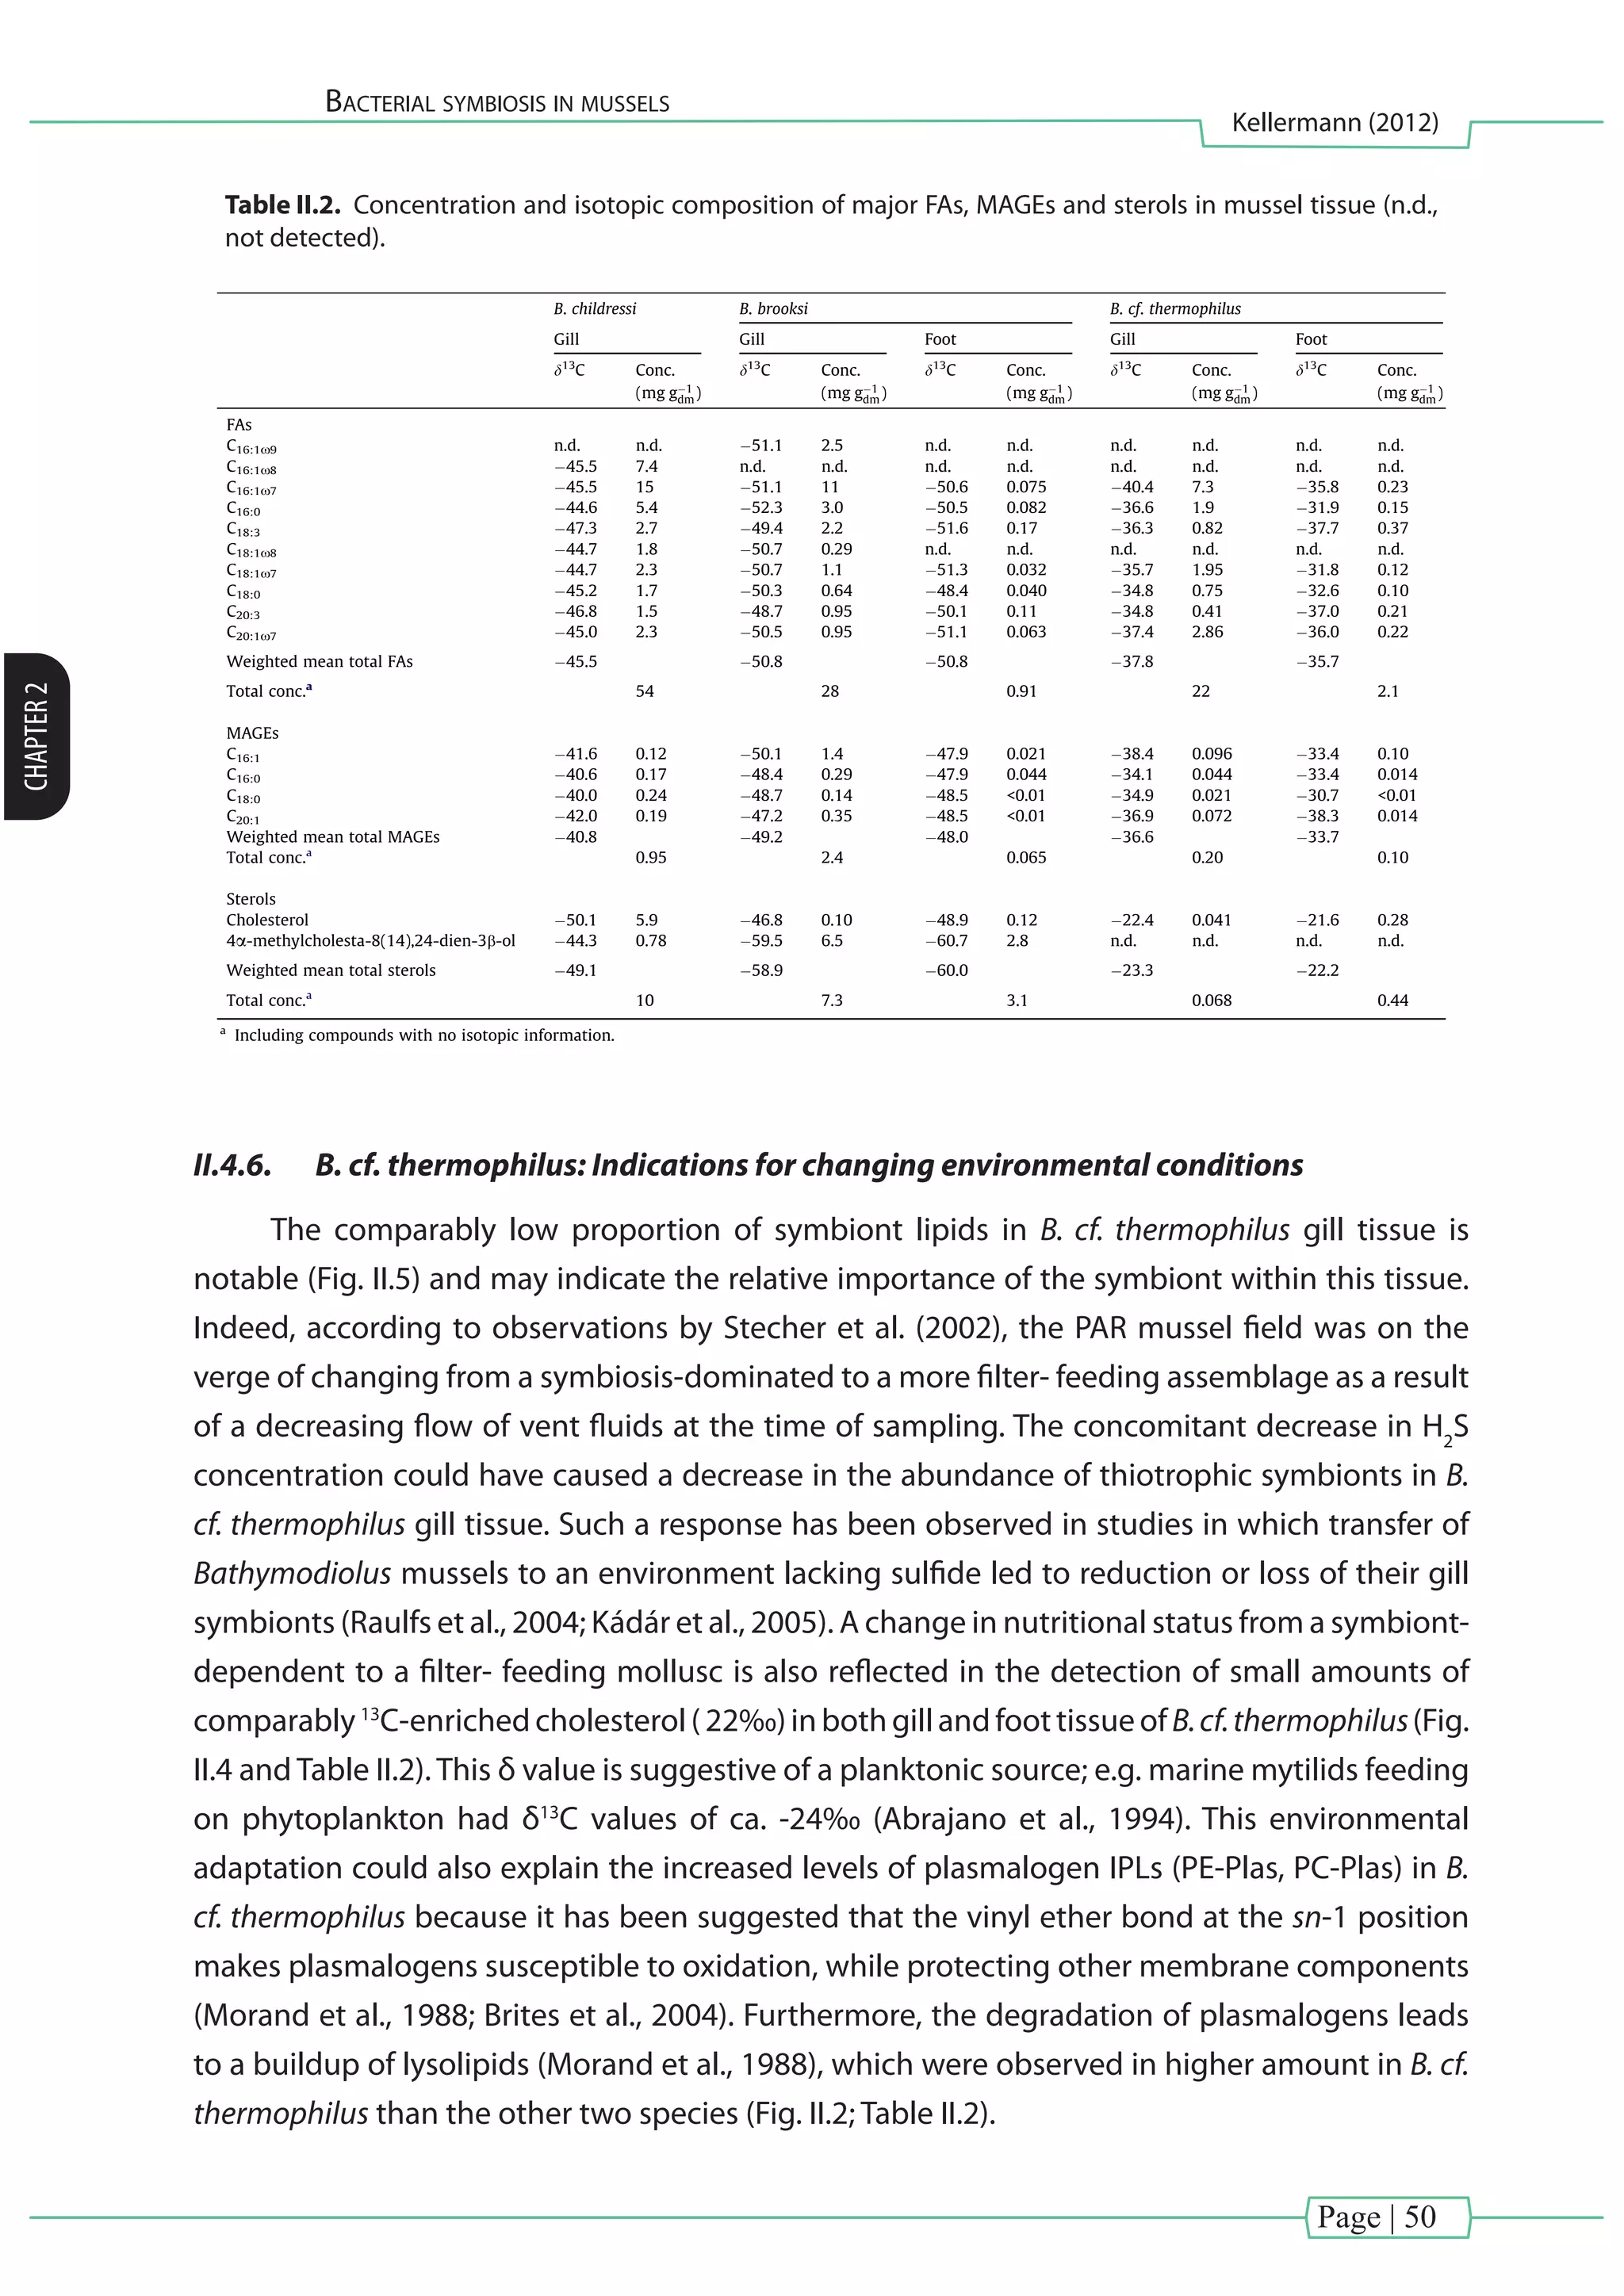
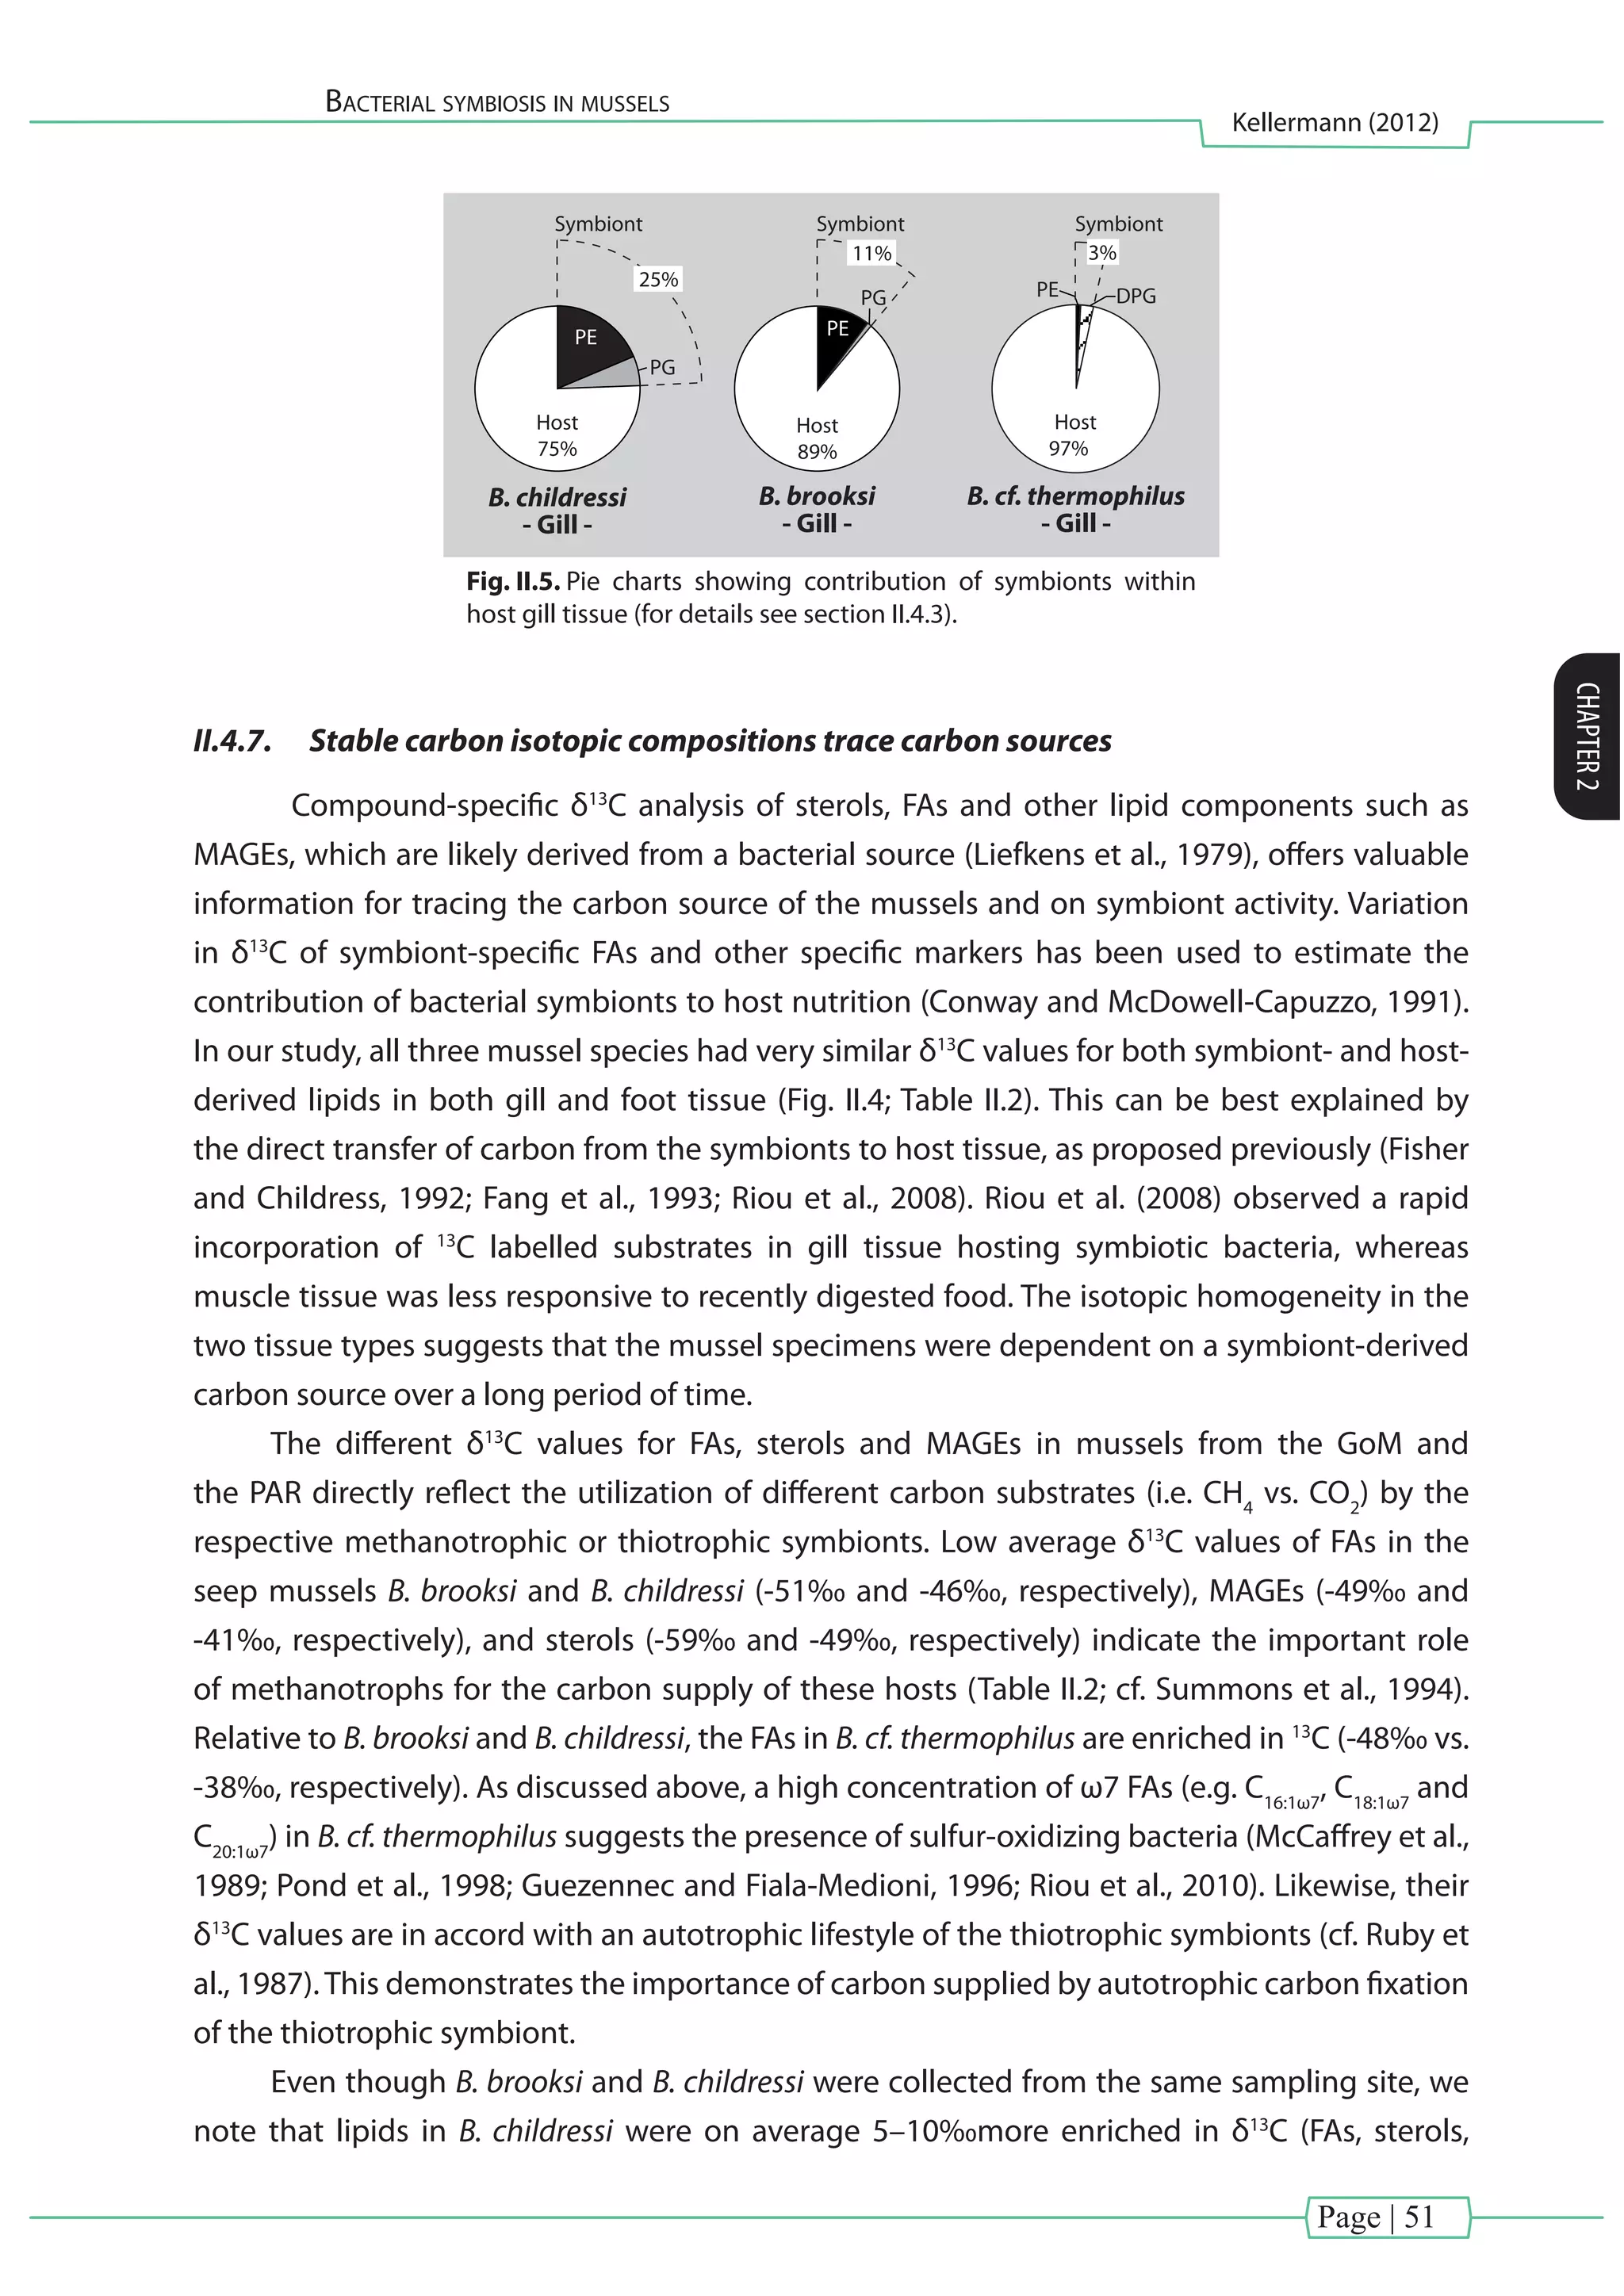
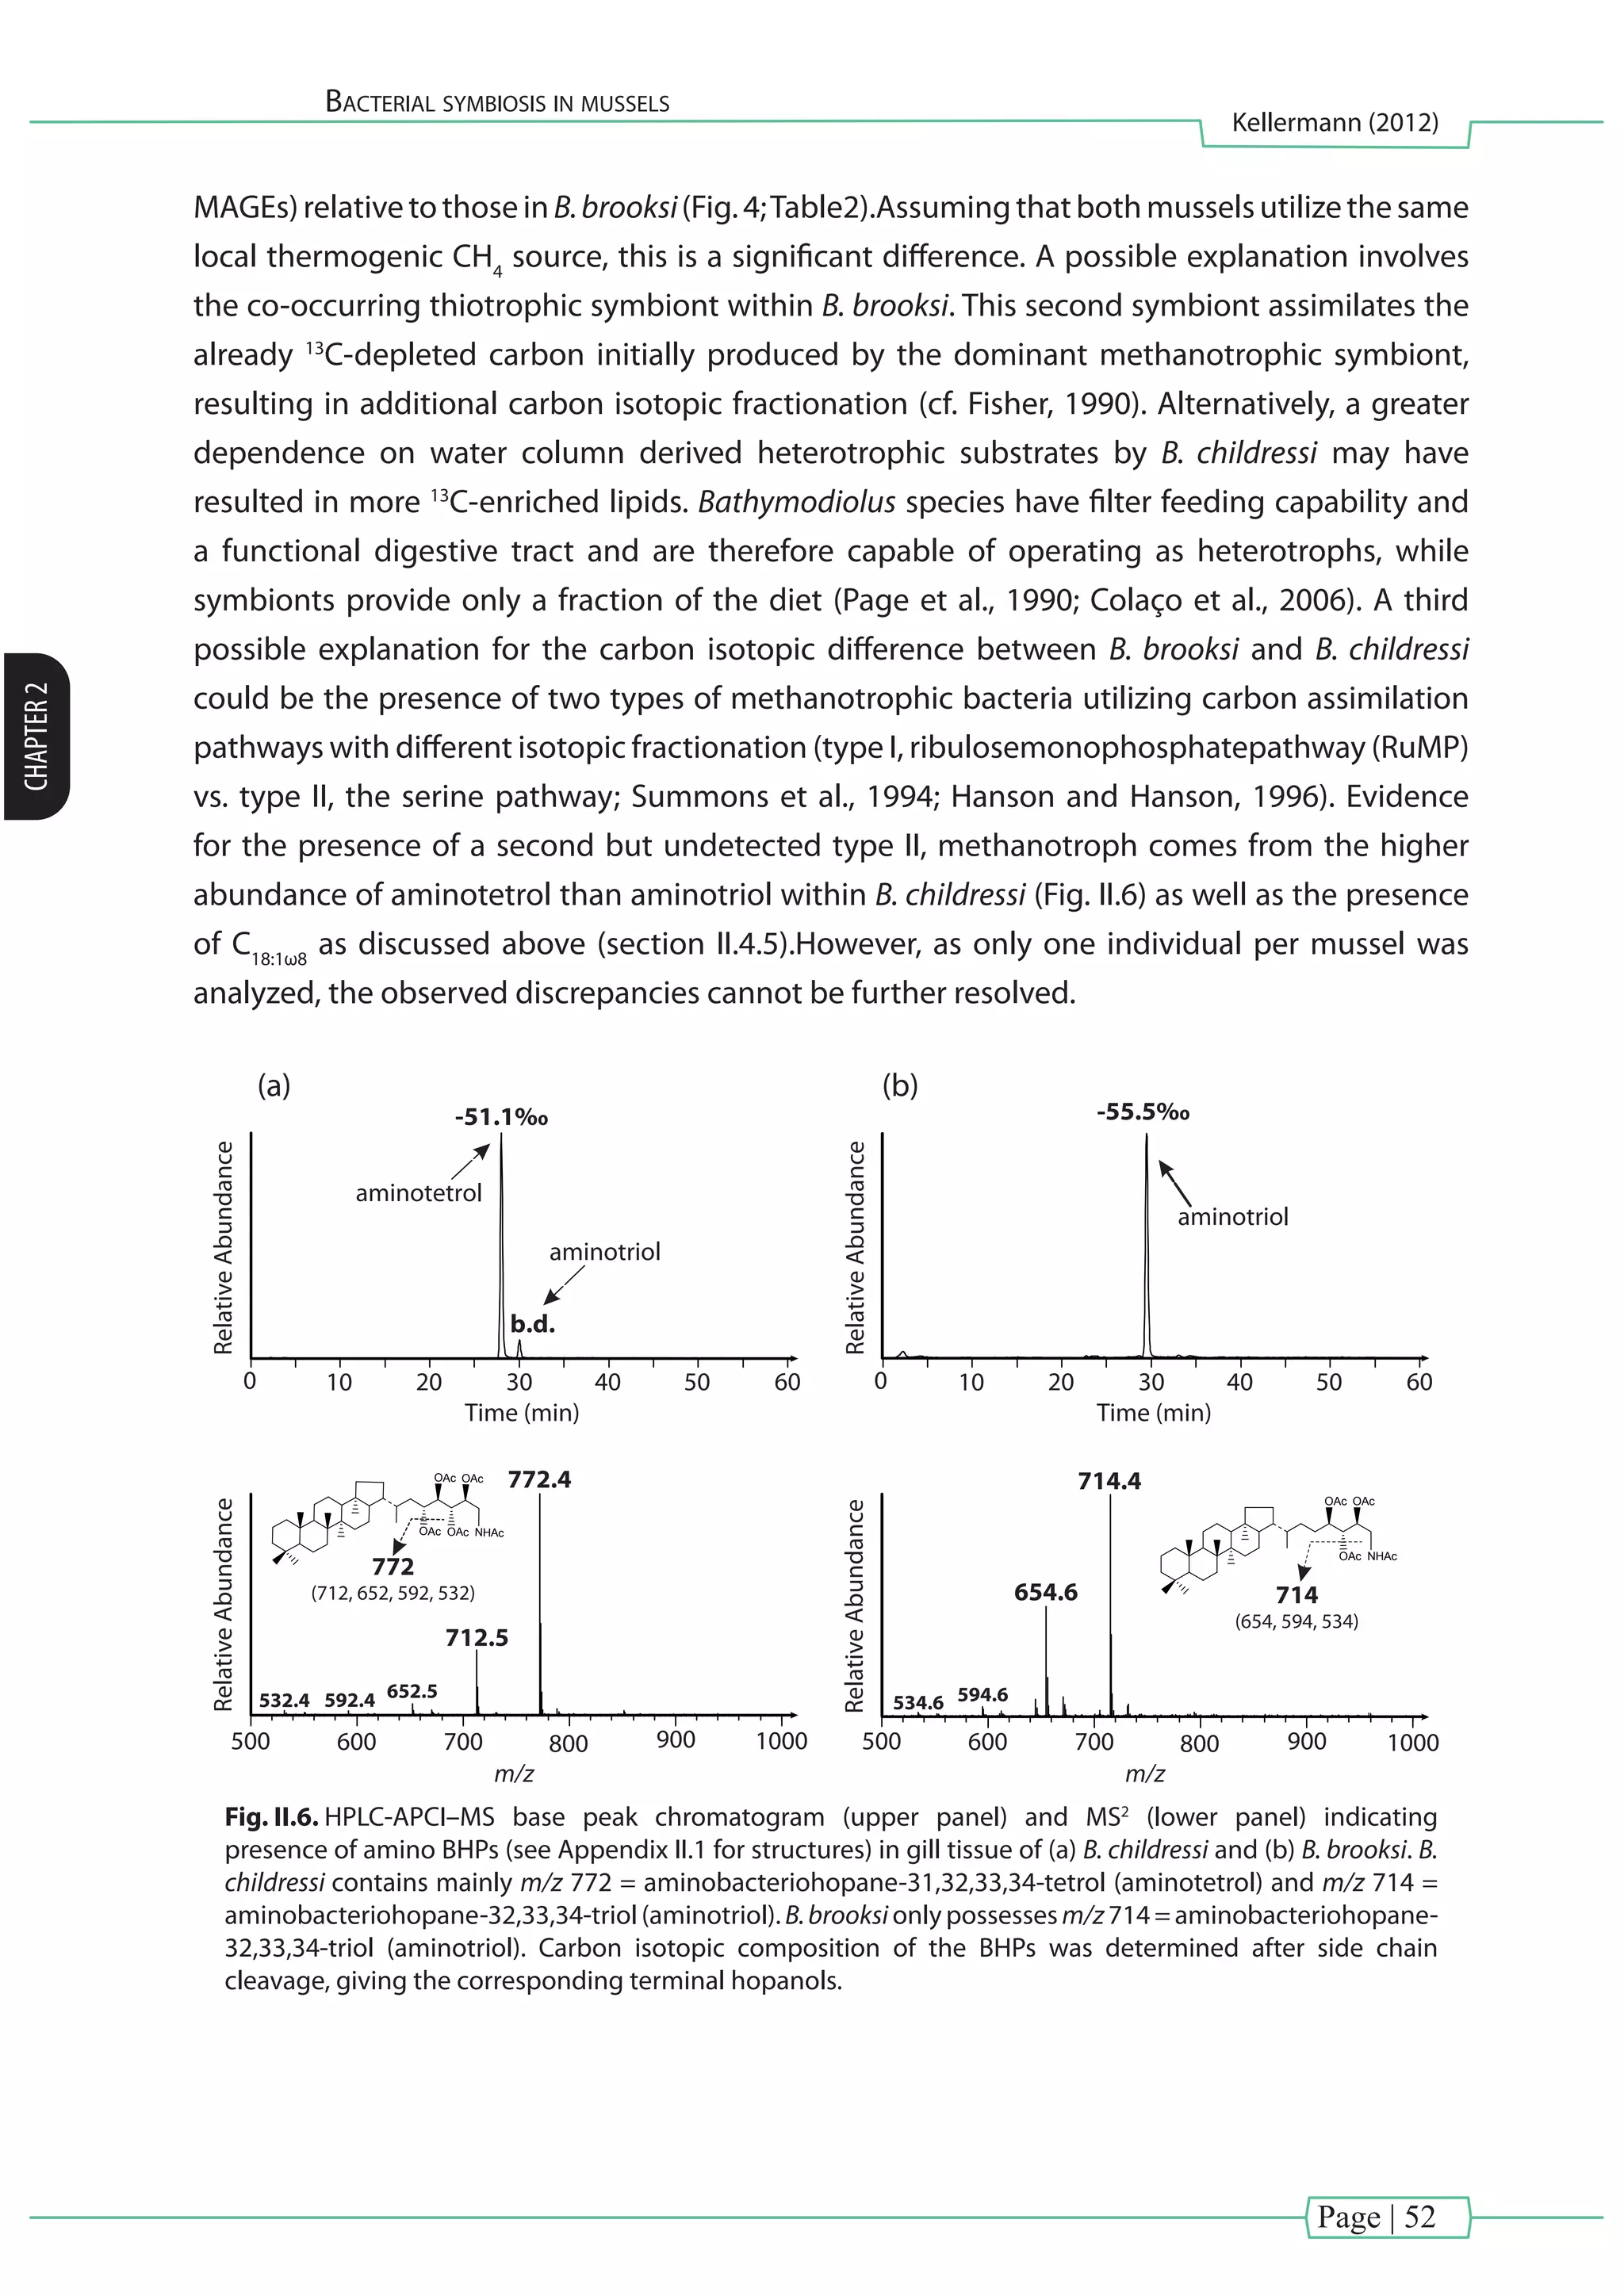
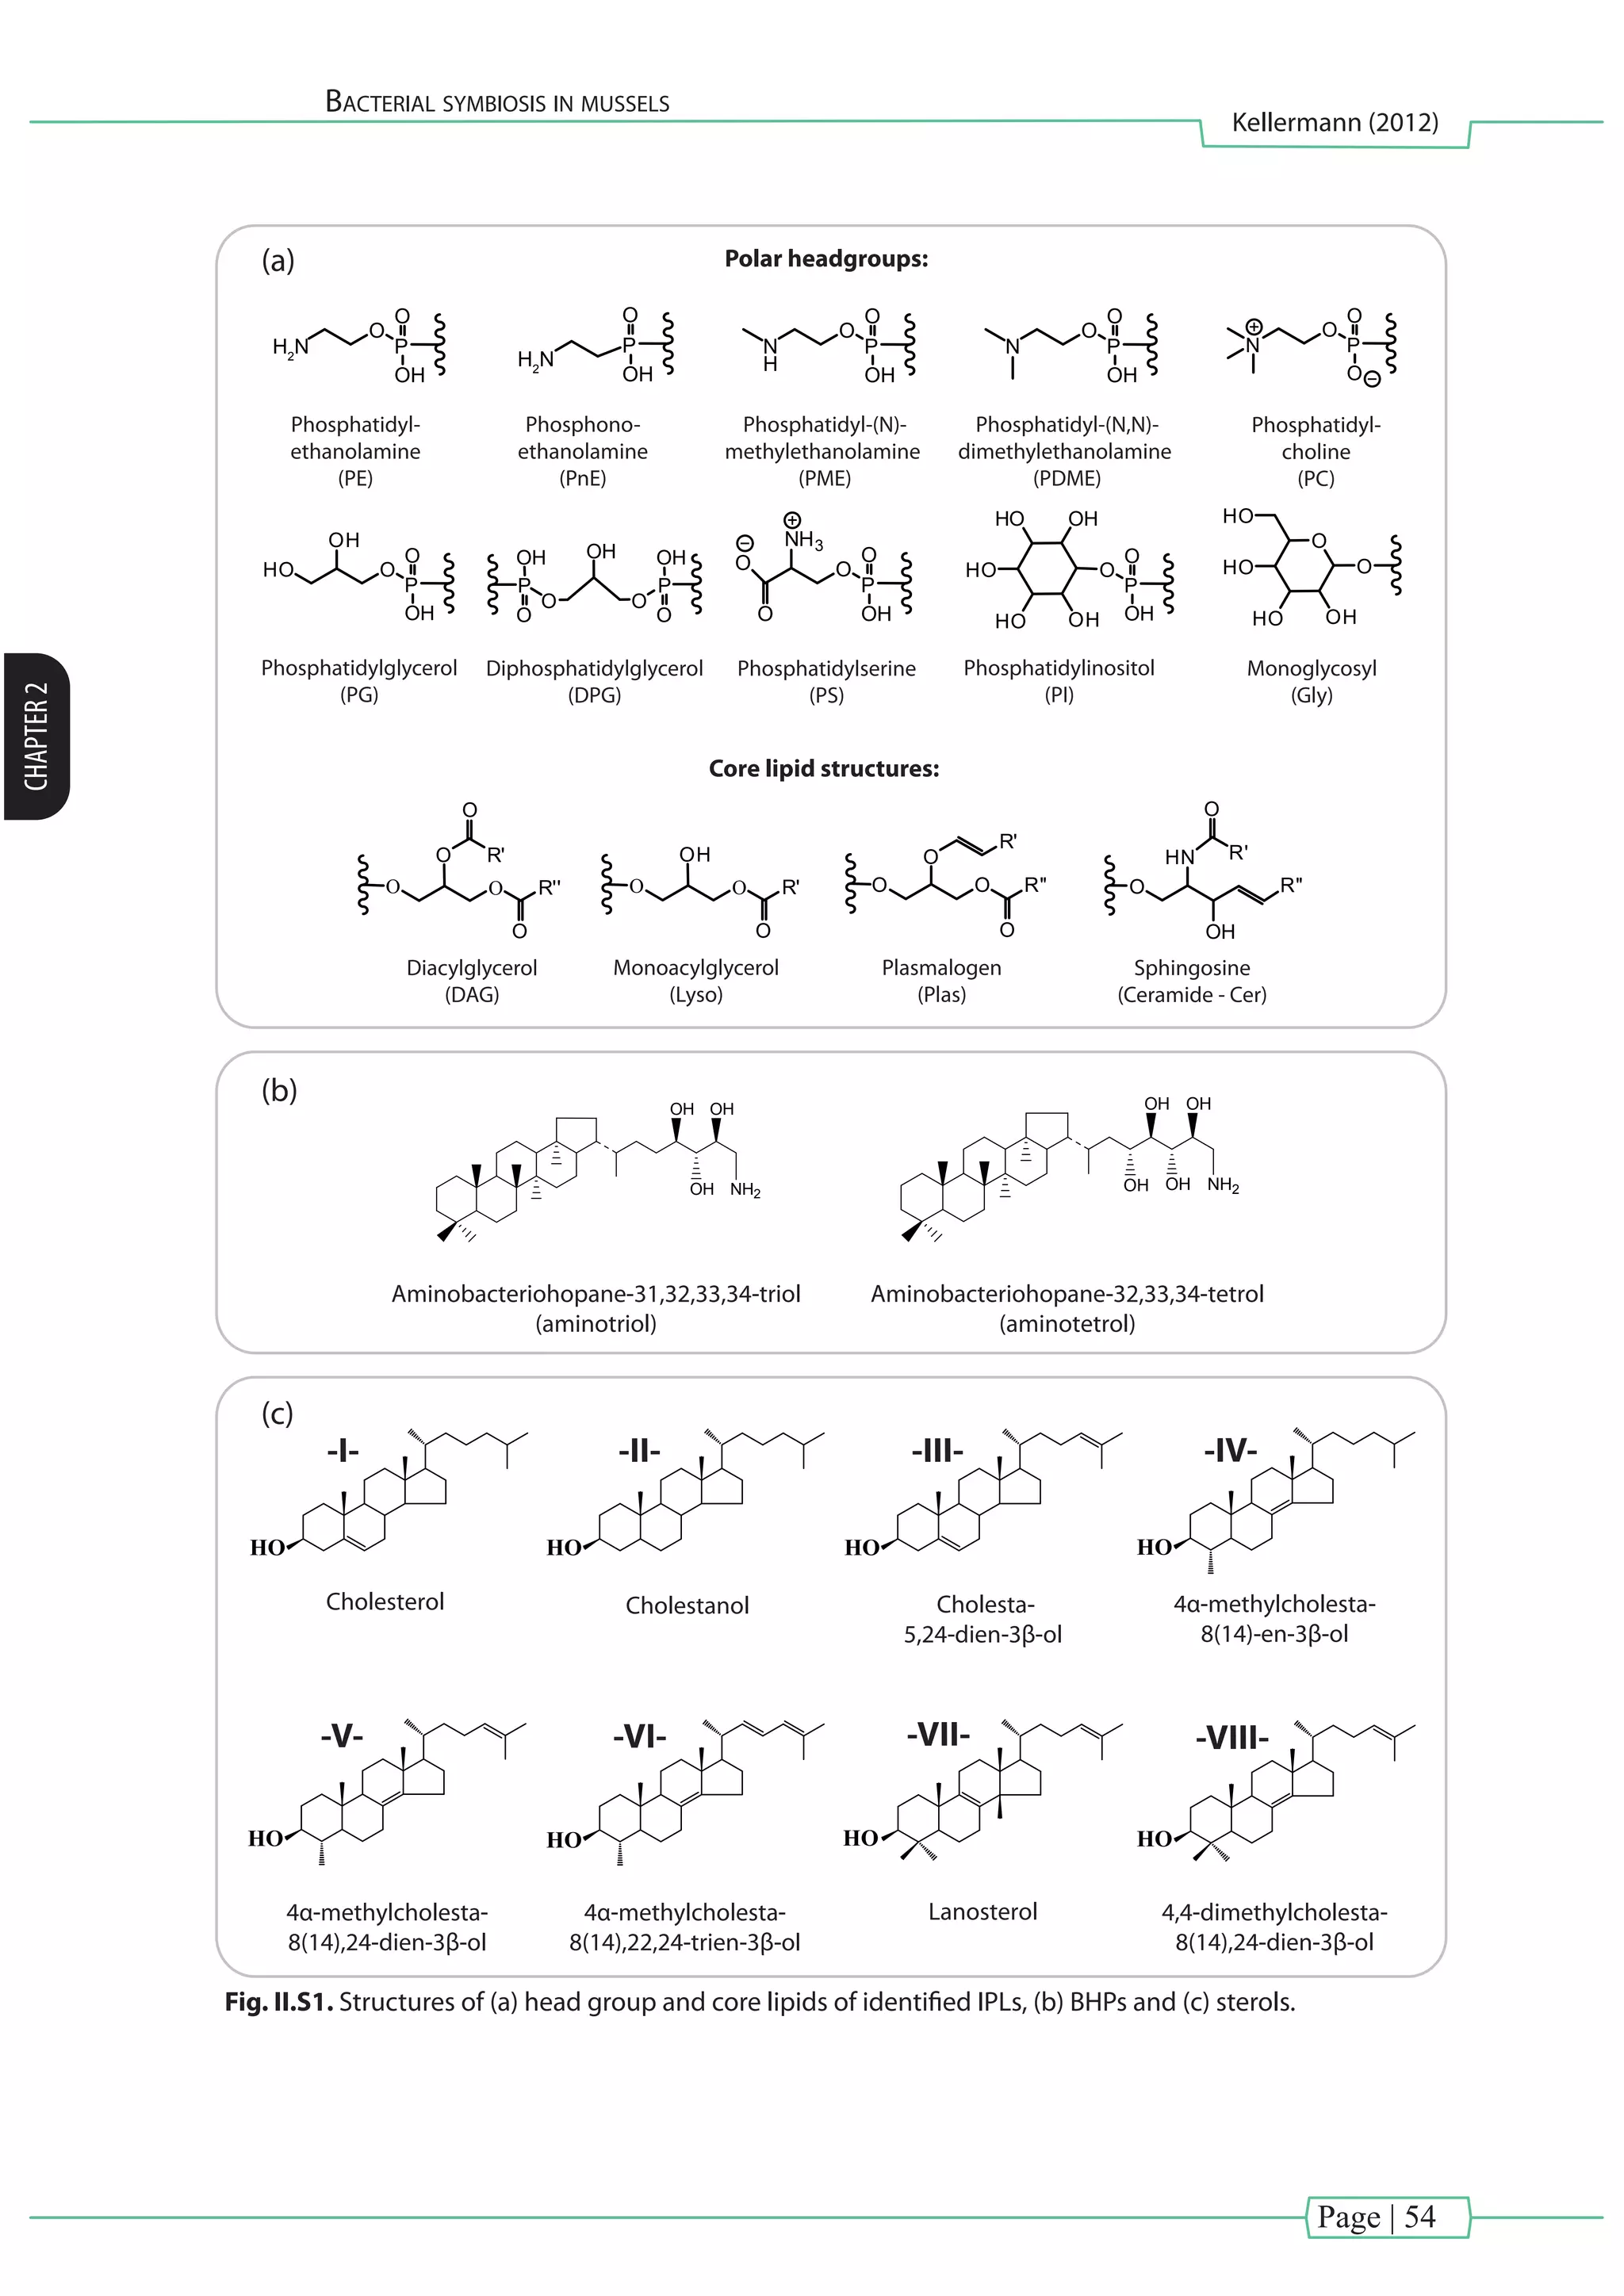

![Page | 57
Dual-SIP approach
Kellermann (2012)
CHAPTER3
[Chapter III] - Dual-SIP approach
Dominance of autotrophic carbon fixation in hydrothermal sediments
inhabited by methanotrophic communities
Matthias Y. Kellermann a
*, Gunter Wegener b
, Marcus Elvert a
, Marcos Y. Yoshinaga a
, Yu–Shih
Lin a
, Thomas Holler b
, Xavier Prieto Mollar a
, Kai–Uwe Hinrichs a
For submission to:
Geochimica et Cosmochimica Acta
a
Organic Geochemistry Group, MARUM Center for Marine Environmental Sciences & Department of
Geosciences, University of Bremen, Leobener Strasse, D–28359 Bremen, Germany
b
Max Planck Institute for Marine Microbiology, Celsiusstr. 1, D–28359 Bremen, Germany
* Corresponding author.
Tel.: +49 421 218 65742; Fax: + 49 421 218 65715
E–mail address: kellermann.matthias@gmail.com
Keywords:
methanotrophy | autotrophy | heterotrophy | AOM | Bacteria | HotSeep–1 | Archaea | ANME–1 |
Guaymas Basin | lipid biomarkers | fatty acids | phytanes | biphytanes | stable isotope probing |
D2
O | 13
CDIC
| 13
CH4](https://image.slidesharecdn.com/54c05e1e-ddfa-426e-bc0d-230967ccb1b0-160817130319/75/PhD-thesis_Matthias-Kellermann-77-2048.jpg)
![Page | 58
Dual-SIP approach
Kellermann (2012)
CHAPTER3
III.1. Abstract
The gas–rich, hydrothermally influenced sediments of the Guaymas Basin are inhabited
by thermophilic microorganisms, including anaerobic methanotrophic archaea (ANME–1) and
sulfate reducing bacteria of the HotSeep–1 cluster. Natural enrichments of these groups have
been used to study microbial carbon fixation in thermophilic seep communities by applying
multiple carbon sources (13
CDIC
and 13
CH4
) and dual stable isotope probing (SIP) of 13
C and D
(13
CDIC
in combination with D2
O) in the presence and absence of methane. The dual SIP allowed
to distinguish between hetero– and autotrophically produced lipids by determining the ratio
(Ra/p
) of the rate of 13
CDIC
assimilation (assimIC
) to the rate of D2
O (prodlipid
) incorporation in newly
synthesized lipids. In the presence of unlabeled methane, 13
CDIC
assimilation was highest in
archaeal phytanes and bacterial C18:1ω7
, iC16:1ω6
and iC18:1ω6
fatty acids, indicating autotrophic
carbon fixation. Incubations with 13
CH4
yielded significantly lower 13
C incorporation into
lipids relative to 13
CDIC
incubations, suggesting that direct methane assimilation is not the
major carbon source for the microbial community. In the absence of methane, archaeal lipid
production stopped and bacterial lipid production dropped by 90%. Under these conditions,
the remaining metabolically active microorganisms performed largely heterotrophic carbon
fixation. This dual stable isotope probing study reveals novel information on the carbon flow in
complex AOM microbial communities.
III.2. Introduction
Methane, an important greenhouse gas, is the most abundant hydrocarbon in anoxic
marine sediments. Its upward flux to the sediment–water interface is strongly reduced by the
anaerobic oxidation of methane (AOM) coupled to sulfate reduction ([Eq. II]; Reeburgh, 1976;
2007). AOM is presumably performed by a syntrophic association of anaerobic methanotrophic
archaea (ANMEs; Hinrichs et al., 1999; Orphan et al., 2002) and sulfate–reducing bacteria (SRB,
mainly relatives of Desulfosarcina or Desulfobulbus, Boetius et al., 2000; Knittel et al., 2005;
Niemann et al., 2006; Schreiber et al., 2010). The free energy yield of the net reaction is one of
the lowest known for catabolic reactions under environmental conditions (–20 to –40 kJ per
mol methane oxidized, e.g., Hoehler et al., 1994; Knab et al., 2008; Alperin and Hoehler, 2009a)
Consequently, doubling times range from 2 to 7 months and growth yields are extremely low
(around 1% relative to oxidized methane; Nauhaus et al., 2007; Treude et al., 2007; Wegener et
al., 2008; Holler et al., 2011).
The biomass of ANMEs and SRBs involved in AOM is usually strongly depleted in 13
C.
For instance, at methane seep locations, the δ13
C values of specific bacterial fatty acids and
archaeal ether lipids range from –60 to –100‰ and –70 to –130‰, respectively (e.g., Elvert
et al., 1999; Hinrichs et al., 2000; Pancost et al., 2000; Elvert et al., 2005; Niemann and Elvert,
2008). Such values were interpreted as evidence for methane incorporation into biomass (e.g.
Hinrichs et al., 1999; Bian et al., 2001; Orphan et al., 2002). One way to establish a direct linkage](https://image.slidesharecdn.com/54c05e1e-ddfa-426e-bc0d-230967ccb1b0-160817130319/75/PhD-thesis_Matthias-Kellermann-78-2048.jpg)
![Page | 62
Dual-SIP approach
Kellermann (2012)
CHAPTER3
performed using the same method and conditions as for the GC–FID. Pyrrolidine derivatives
were analyzed on a GC (Agilent 6890) coupled to mass spectrometer (MS; Agilent 5973 MSD).
Carbon and hydrogen isotopic compositions of FAs and isoprenoids were determined at least
in duplicates using a GC–isotope ratio–MS (Trace GC Ultra coupled to a GC–IsoLink/ConFlow IV
interface and a Delta V Plus isotope ratio mass spectrometer, all from Thermo Scientific GmbH,
Bremen, Germany). Carbon compounds were oxidized in a combustion reactor at 940°C, and
molecular hydrogen was produced in a pyrolysis reactor at 1420°C. The analytical error was
<0.5‰ and <10‰ for non–labeled δ13
C and δD values, respectively. δ13
C and δD values were
corrected for additional carbon introduced during derivatization.
III.3.6. Calculations of total lipid production rate (prodlipid
), assimilation rate of inorganic
carbon (assimIC
), and the assimIC
/prodlipid
ratio (Ra/p
)
The stable hydrogen and carbon isotope values are expressed in the δ–notation in per mill
(‰) as deviation of the isotope ratio to a reference standard of known isotopic compositions
([Eq. IV] and [Eq. III]). Stable isotope probing experiments with cultures of sulfate–reducing
bacteria showed that the majority of microbial lipid hydrogen derives from water protons,
independent of whether the microbe grows hetero– or autotrophically (Wegener et al., in
revision). Hence incorporation of D from amended D2
O serves as a sensitive assay to determine
the rate of total lipid production (prodlipid
). The assimilation rate of 13
C from labeled inorganic
carbon into lipids (assimIC
) is highest during autotrophic growth.
Prodlipid
and assimIC
are calculated by multiplying lipid concentration (conclipid
) with the
increase of the fraction of either D (ΔFD
Lipid
) or 13
C (ΔF13
CLipid
) relative to the fraction of non–
labeled samples, divided by the fraction of D (FD
Medium
) and 13
C (F13C
Medium
) in the incubated
medium ([Eq. V] and [Eq. VI]).
al., in press). Hence the incorporation of D from amended D2O serves as a sensitive505
assay to determine the rate of total lipid production (prodlipid). The assimilation rate of506
13
C from labeled inorganic carbon into lipids (assimIC) has been shown to be highest507
during autotrophic growth.508
Prodlipid and assimIC are calculated by multiplying lipid concentration (conclipid)509
with the increase of the fraction of either D (∆FD
lipid) or 13
C (∆F13C
lipid) relative to the510
fraction of non–labeled samples, divided by the fraction of D (FD
medium) and 13
C511
(F13C
medium) in the incubated medium (Eq. 4 and 5).512
tF
F
concprod D
medium
D
lipid
lipidlipid
[Eq. 4]513
tF
F
concassim C
medium
C
lipid
lipidIC
13
13
[Eq. 5]514
The fractions of FD
and F13C
in individual lipids and incubation medium are515
calculated from the isotope ratios FD
= RD/H
/(RD/H
+1); F13C
= R13C/12C
/(R13C/12C
+1),516
where R derives from the delta notations (Eq. 2, 3). Both, prodlipid and assimIC are517
expressed in µg lipid gdm
–1
yr–1
.518
Based on the assimIC/prodlipid ratio (Ra/p), we can distinguish whether a lipid519
extracted from a mixed community is derived from autotrophic or heterotrophic520
organisms. Ra/p values of 0.3 indicate fully heterotrophic and Ra/p values close to 1521
completely autotrophic lipid production. Ra/p values in between 0.3 and 1 represent a522
mixed signal (Wegener et al., in press).523
[Eq. V]
al., in press). Hence the incorporation of D from amended D2O serves as a sensitive505
assay to determine the rate of total lipid production (prodlipid). The assimilation rate of506
13
C from labeled inorganic carbon into lipids (assimIC) has been shown to be highest507
during autotrophic growth.508
Prodlipid and assimIC are calculated by multiplying lipid concentration (conclipid)509
with the increase of the fraction of either D (∆FD
lipid) or 13
C (∆F13C
lipid) relative to the510
fraction of non–labeled samples, divided by the fraction of D (FD
medium) and 13
C511
(F13C
medium) in the incubated medium (Eq. 4 and 5).512
tF
F
concprod D
medium
D
lipid
lipidlipid
[Eq. 4]513
tF
F
concassim C
medium
C
lipid
lipidIC
13
13
[Eq. 5]514
The fractions of FD
and F13C
in individual lipids and incubation medium are515
calculated from the isotope ratios FD
= RD/H
/(RD/H
+1); F13C
= R13C/12C
/(R13C/12C
+1),516
where R derives from the delta notations (Eq. 2, 3). Both, prodlipid and assimIC are517
expressed in µg lipid gdm
–1
yr–1
.518
Based on the assimIC/prodlipid ratio (Ra/p), we can distinguish whether a lipid519
extracted from a mixed community is derived from autotrophic or heterotrophic520
organisms. Ra/p values of 0.3 indicate fully heterotrophic and Ra/p values close to 1521
completely autotrophic lipid production. Ra/p values in between 0.3 and 1 represent a522
[Eq. VI]
The fractions of FD
and F13C
in individual lipids and incubation medium are calculated from
the isotope ratios FD
= RD/H
/(RD/H
+1); F13
C = R13C/12C
/(R13C/12C
+1), where R derives from the delta
notations ([Eq. III] and [Eq. IV]). Both, prodlipid
and assimIC
are expressed in µg lipid gdm
–1
yr–1
.
Based on the assimIC
/prodlipid
ratio (Ra/p
), we can distinguish whether a lipid extracted
from a mixed community is largely derived from autotrophic or heterotrophic organisms. Ra/p
values of 0.3 indicate fully heterotrophic and Ra/p
values close to 1 completely autotrophic](https://image.slidesharecdn.com/54c05e1e-ddfa-426e-bc0d-230967ccb1b0-160817130319/75/PhD-thesis_Matthias-Kellermann-82-2048.jpg)
![Page | 63
Dual-SIP approach
Kellermann (2012)
CHAPTER3
lipid production. Ra/p
values in between 0.3 and 1 represent a mixed signal (Wegener et al., in
revision).
Table III.1. Duration of the incubation, substrate combinations (DH2O
and 13
CDIC
; 13
CH4
), labeling strength
(δ13
CDIC
and δ13
CCH4
of the headspace; δDH2O
of the aqueous media), and the sulfide production rate of all
analyzed samples incubated at 37 and 50°C. DEAD = ZnCl2
(final conc. 2%); CO2
– 50kPa; CH4
– 200kPa;
N2
– 200kPa.
III.4. Results and discussion
III.4.1. Activity of the thermophilic microbial community
Sediment slurries were incubated at two temperatures, 37°C and 50°C, with and without
methane. To estimate microbial activities sulfide concentrations were tracked (see [Eq. II]). The
incubations with methane showed the highest increase of sulfide, corresponding to sulfate
reduction rates of 6.0±0.4 µmol d–1
gdm
–1
at 37°C and of 9.0 µmol d–1
gdm
–1
at 50°C. Without
methane, sulfide production was reduced to 0.7 and 1.4 µmol d–1
gdm
–1
at 37°C and 50°C,
respectively. In AOM, methane oxidation is coupled to sulfide production in a 1:1 stoichiometry
([Eq. II]; Nauhaus et al., 2002; Holler et al., 2009; 2011). Methane consumption was not directly
measured but was calculated from the isotopic change of the DIC pool (30 mM). During 24 day
incubation at 37°C with 13
C–labeled methane (δ13
CCH4
at T0 ~ +16,000‰), δ13
CDIC
increased by
+950‰ (Table III.1). Via mass balance calculations, we obtained methane oxidation rates of 3.4
µmol d–1
gdm
–1
[Eq. VII].](https://image.slidesharecdn.com/54c05e1e-ddfa-426e-bc0d-230967ccb1b0-160817130319/75/PhD-thesis_Matthias-Kellermann-83-2048.jpg)
![Page | 64
Dual-SIP approach
Kellermann (2012)
CHAPTER3
tF
F
concprod C
medium
C
lipid
lipidIC
13
13
[Eq. 6]
timeconc
FExcess
F
rateoxidationCH DIC
C
CH
C
DIC
/13
4
13
4
This is roughly 80% of the sulfate reduction rate measured from the same batch of
incubation (4.0 µmol d–1
gdm
–1
; Table III.1). The slightly higher sulfate reduction rates can be
attributed to organic matter oxidation (see discussion below). Our results on thermophilic AOM
in Guaymas sediments are similar to other studies showing a tight coupling between sulfate
reduction and methane oxidation (Biddle et al., 2011; Holler et al., 2011).
20 262422
C14:0
3Me-
C16
Phy
BP(0)
BP(1)
BP(2)
aiC15:0
iC15:0
C15:0
iC16:0
iC16:1ω6
iC18:1ω6
C16:1ω7
C16:1ω5
C16:0
C18:1ω7
C18:1ω9
PA
cyC17:0
C17:0
aiC17:0
iC17:0
C18:0
28 30
Time (min)
Time (min)
Relativeitensity
20 25 50 55 60
Relativeitensity
(b)
(a)
(c)
BP(3)
Saturated FAs
[48.5±5.5%]
Archaeal lipids (~60%)
34.4±3.8µg lipid gdm
-1
Bacterial lipids (~40%)
23.2±1.3µg lipid gdm
-1
Monoun-
saturated FAs
[16.1±2.1%]
i- and ai-FAs
[27.5±3.0%]
Methyl-
branched FAs
[7.9±1.1%]
Phy
[22.5±2.1%]
BP(0)
[32.2±1.3%]
BP(1)
[11.9±0.7%]
BP(2)
[22.5±0.7%]
BP(3)
[10.9±0.2%]
Fig. III.1. Gas chromatogram of (a) fatty acids after saponification and (b) archaeal phytane and biphytanes
(0–3) after ether cleavage of the TLE. (c) Pie chart shows the relative abundance of bacterial and archaeal
lipids, averaged over all experiments. Absolute concentrations (calculated relative to the injection standard
squalane) are normalized to gram extracted dry sediment.
III.4.2. Microbial lipid concentration and natural isotopic compositions
After the incubation, a total lipid extract (TLE) was prepared and aliquots of theTLE were
hydrolyzed to yield the total bacterial FAs and archaeal isoprenoids. There was no significant
change in concentrations and relative abundances of the detected lipids over the course of
incubation (e.g. concentrations of archaeal isoprenoids were 34.4±3.8 µg gdm
–1
and bacterial
FAs were 23.2±1.3 µg lipid gdm
–1
; Fig. III.1c), an observation that is consistent with the low
growth rates reported for the microbial community (doubling time of 77 days at 37°C; Holler
et al., 2011). The major archaeal lipid products from ether cleavage were acyclic biphytane](https://image.slidesharecdn.com/54c05e1e-ddfa-426e-bc0d-230967ccb1b0-160817130319/75/PhD-thesis_Matthias-Kellermann-84-2048.jpg)
![Page | 66
Dual-SIP approach
Kellermann (2012)
CHAPTER3
for a given lipid pool (i.e. archaeal vs. bacterial or phytanes vs. biphytanes vs. FAs). The change
in isotopic compositions of microbial lipids was strongest for incubations using D2
O and 13
CDIC
in presence of methane, and the enrichment of heavy isotopes in lipids increased with time.
The extent of label uptake differed between individual compounds, with a highest change in
ΔδD and Δδ13
C found for archaeol–derived phytane and bacterial lipids such as iC18:1ω6
, iC16:1ω6
and C18:1ω7
FAs (Table III.2). For instance, in the 24–day long incubation at 37°C under a methane
atmosphere, changes in phytane isotopes (ΔδD = ~ +12,000‰ and Δδ13
C = ~ +530‰) were
remarkably higher than the weighted average isotopic shift of biphytanes (ØΔδD = ~ +300‰
and ØΔδ13
C = ~ +10‰) (Table III.2; Fig. III.2). The D enrichment of bacterial FAs in the range
from C14
–C18
(ØΔδD = ~ +12,000‰) was comparable to that of phytane, but 13
C enrichment was
significantly lower (ØΔδ13
C = ~ +380‰; (Table III.2; Fig. III.2). In the dead–control, no significant
enrichment of D and 13
C in lipids was detected (Table III.S1).
ØΔδ13
C
37°C 50°C
t(10)+
t(17)+
t(24)+
t(24)
13
CH4
t(24)
w/o-CH4
t(17)+ t(10)+
t(17)+
t(24)+
t(24)
13
CH4
t(24)
w/o-CH4
t(17)+
12,000
14,000
10,000
8,000
6,000
4,000
2,000
600
500
400
300
100
0
200
0
Total FAs
Total ARs
ØΔδD[‰]
n.d.
ØΔδ13
C[‰]
(a) (b)ØΔδD
50°C
Total GDGTs
37°C
Total FAs
Total ARs
Total GDGTs
Fig. III.2. Weighted–average isotopic shifts of (a) hydrogen and (b) carbon expressed as ØΔδ of total fatty
acids, archaeols and GDGTs in the incubations. (+) indicates incubations with unlabeled methane.
In the 24–day long incubations without CH4
at 37°C, archaeal lipids showed only traces
of D label assimilation and no uptake of 13
C (ØΔδD = ~ +50‰; ØΔδ13
C = ±0‰); likewise the
uptake into bacterial lipids was strongly reduced compared to the incubations with methane
(ØΔδD = ~ +2,200‰ and ØΔδ13
C = ~ +20‰; Table III.2; Fig. III.2). This observation confirms the
central role of methane as an energy substrate in the examined thermophylic AOM system,
analogous to findings in cold seep sediments (e.g. Nauhaus et al., 2007; Wegener et al., 2008).
Incubation with 13
CH4
(37°C; 24 days) caused a relatively low increase of 13
C in lipids.
The ØΔδ13
C values are around 30‰ for both bacterial and archaeal lipids (Table III.2; Fig. III.2),
corresponding to about 1/12 and 1/4 of the ØΔδ13
C values for the respective lipid pools in
the parallel experiment with addition of 13
CDIC
and unlabeled methane. We address the slight
positive shift in δ13
C values of lipids in the course of this experiment not to direct biosynthetic
utilization of 13
CH4
but rather to indirect uptake via assimilation of the increasingly 13
C–](https://image.slidesharecdn.com/54c05e1e-ddfa-426e-bc0d-230967ccb1b0-160817130319/75/PhD-thesis_Matthias-Kellermann-86-2048.jpg)
![Page | 67
Dual-SIP approach
Kellermann (2012)
CHAPTER3
enriched DIC pool resulting from continuous methane oxidation (after 24 days δ13
CDIC
was
approximately 950‰; Table III.1). This implies that not only SRBs, but also ANME–1 archaea
assimilate predominantly inorganic carbon. Our findings are in agreement with the result from
Treude and coworkers (2007), who detected a predominance of 14
CO2
over 14
CH4
incorporation
within a microbial mat known to be dominated by ANME-1/SRB consortia. However, this result
differs from a previous labeling study with cold seep sediments by Wegener et al. (2008), in
which methane contribution of up to 50% were found in the archaeal lipid carbon pool of
mixed ANME–1/ANME–2 and ANME–2 dominated communities.
Table III.2. Isotopic shifts (Δδ) of individual lipids relative to time–zero values and the weighted average
isotopic shifts (ØΔδ) of specific lipid pools.
34
name
microbial lipids
t(10) + CH4 t(17) + CH4 t(24) + CH4 t(24) + 13
CH4 t(24) w/o–CH4 t(17) + CH4
(50°C)
Δδ13
C ΔδD Δδ13
C ΔδD Δδ13
C ΔδD Δδ13
C ΔδD Δδ13
C ΔδD Δδ13
C ΔδD
[‰] [‰] [‰] [‰] [‰] [‰] [‰] [‰] [‰] [‰] [‰] [‰]
ØΔδ bacterial lipids 200 6,400 290 9,600 380 12,000 32 n.a. 22 2,200 180 7,200
C14:0 64 1,800 100 3,200 135 4,000 26 7 1,200 13 1,200
3Me – C15 1 400 0 660 0 580 0 0 480 0 710
i–C15:0 41 3,800 57 6,500 86 7,600 13 33 4,500 71 6,900
ai–C15:0 200 8,600 270 12,000 370 16,000 74 110 7,900 260 9,800
C15:0 50 2,000 64 2,700 96 3,800 9 21 1,700 21 2,800
i–C16:1ω6 830 20,000 1,200 32,000 1,600 40,000 120 0.31 630 1,100 3,1000
iC16:0 340 12,000 500 19,000 700 25,000 73 18 4,700 700 28,000
C16:1ω7 170 5,800 260 7,500 350 10,000 27 0 1,500 91 6,400
C16:1ω5 160 3,100 200 4,500 240 6,100 19 46 1,900 40 6,500
C16:0 63 3,300 100 4,100 150 6,600 12 8 1,500 38 2,900
i–C17:0 44 3,100 75 5,400 100 5,600 6 12 2,500 78 7,700
ai–C17:0 160 5,500 200 8,200 280 10,000 30 16 2,500 290 11,000
C17:0 38 1,500 52 1,800 113 2,100 1 9 830 33 2,200
i–C18:1ω6 1,300 31,000 1,600 56,000 2,300 49,000 180 0.41 700 1,800 41,000
PA 93 6,900 200 11,000 200 11,000 8 55 2,600 64 2,300
C18:1ω9 370 14,000 680 24,000 690 23,000 48 170 7,000 180 8,300
C18:1ω7 830 20,000 1,300 28,000 1,500 32,000 100 20 2,000 300 8,900
C18:0 31 1,200 52 2,700 72 5,200 7 3 560 3 1,200
ØΔδ archaeal lipids 95 2,100 110 2,200 120 2,900 34 n.a. 0.41 46 48 1,500
Phytane 420 9,200 450 8,900 530 12,000 140 2 170 170 4,700
Bp(0) 4 180 13 430 12 420 3 0 20 12 510
Bp(1) 0 130 5 400 15 510 6 0 10 24 850
Bp(2) 0 27 0 93 2 190 2 0 0 13 550
Bp(3) 0 6 0 5 0 16 0 0 0 0 150
III.4.4. Rates of total lipid production (prodlipid
) and inorganic carbon assimilation (assimIC
)
and implications for microbial carbon fixation
By conversion of the bacterial and archaeal lipid incorporation of D2
O and 13
CDIC
into total
lipid production rates (prodlipid
) and assimilation rates of inorganic carbon (assimIC
), respectively,
we are able to evaluate the relative importance of heterotrophic (Ra/p
~ 0.3) and autotrophic
(Ra/p
~ 1) microbial carbon metabolism (Wegener et al., in revision).](https://image.slidesharecdn.com/54c05e1e-ddfa-426e-bc0d-230967ccb1b0-160817130319/75/PhD-thesis_Matthias-Kellermann-87-2048.jpg)
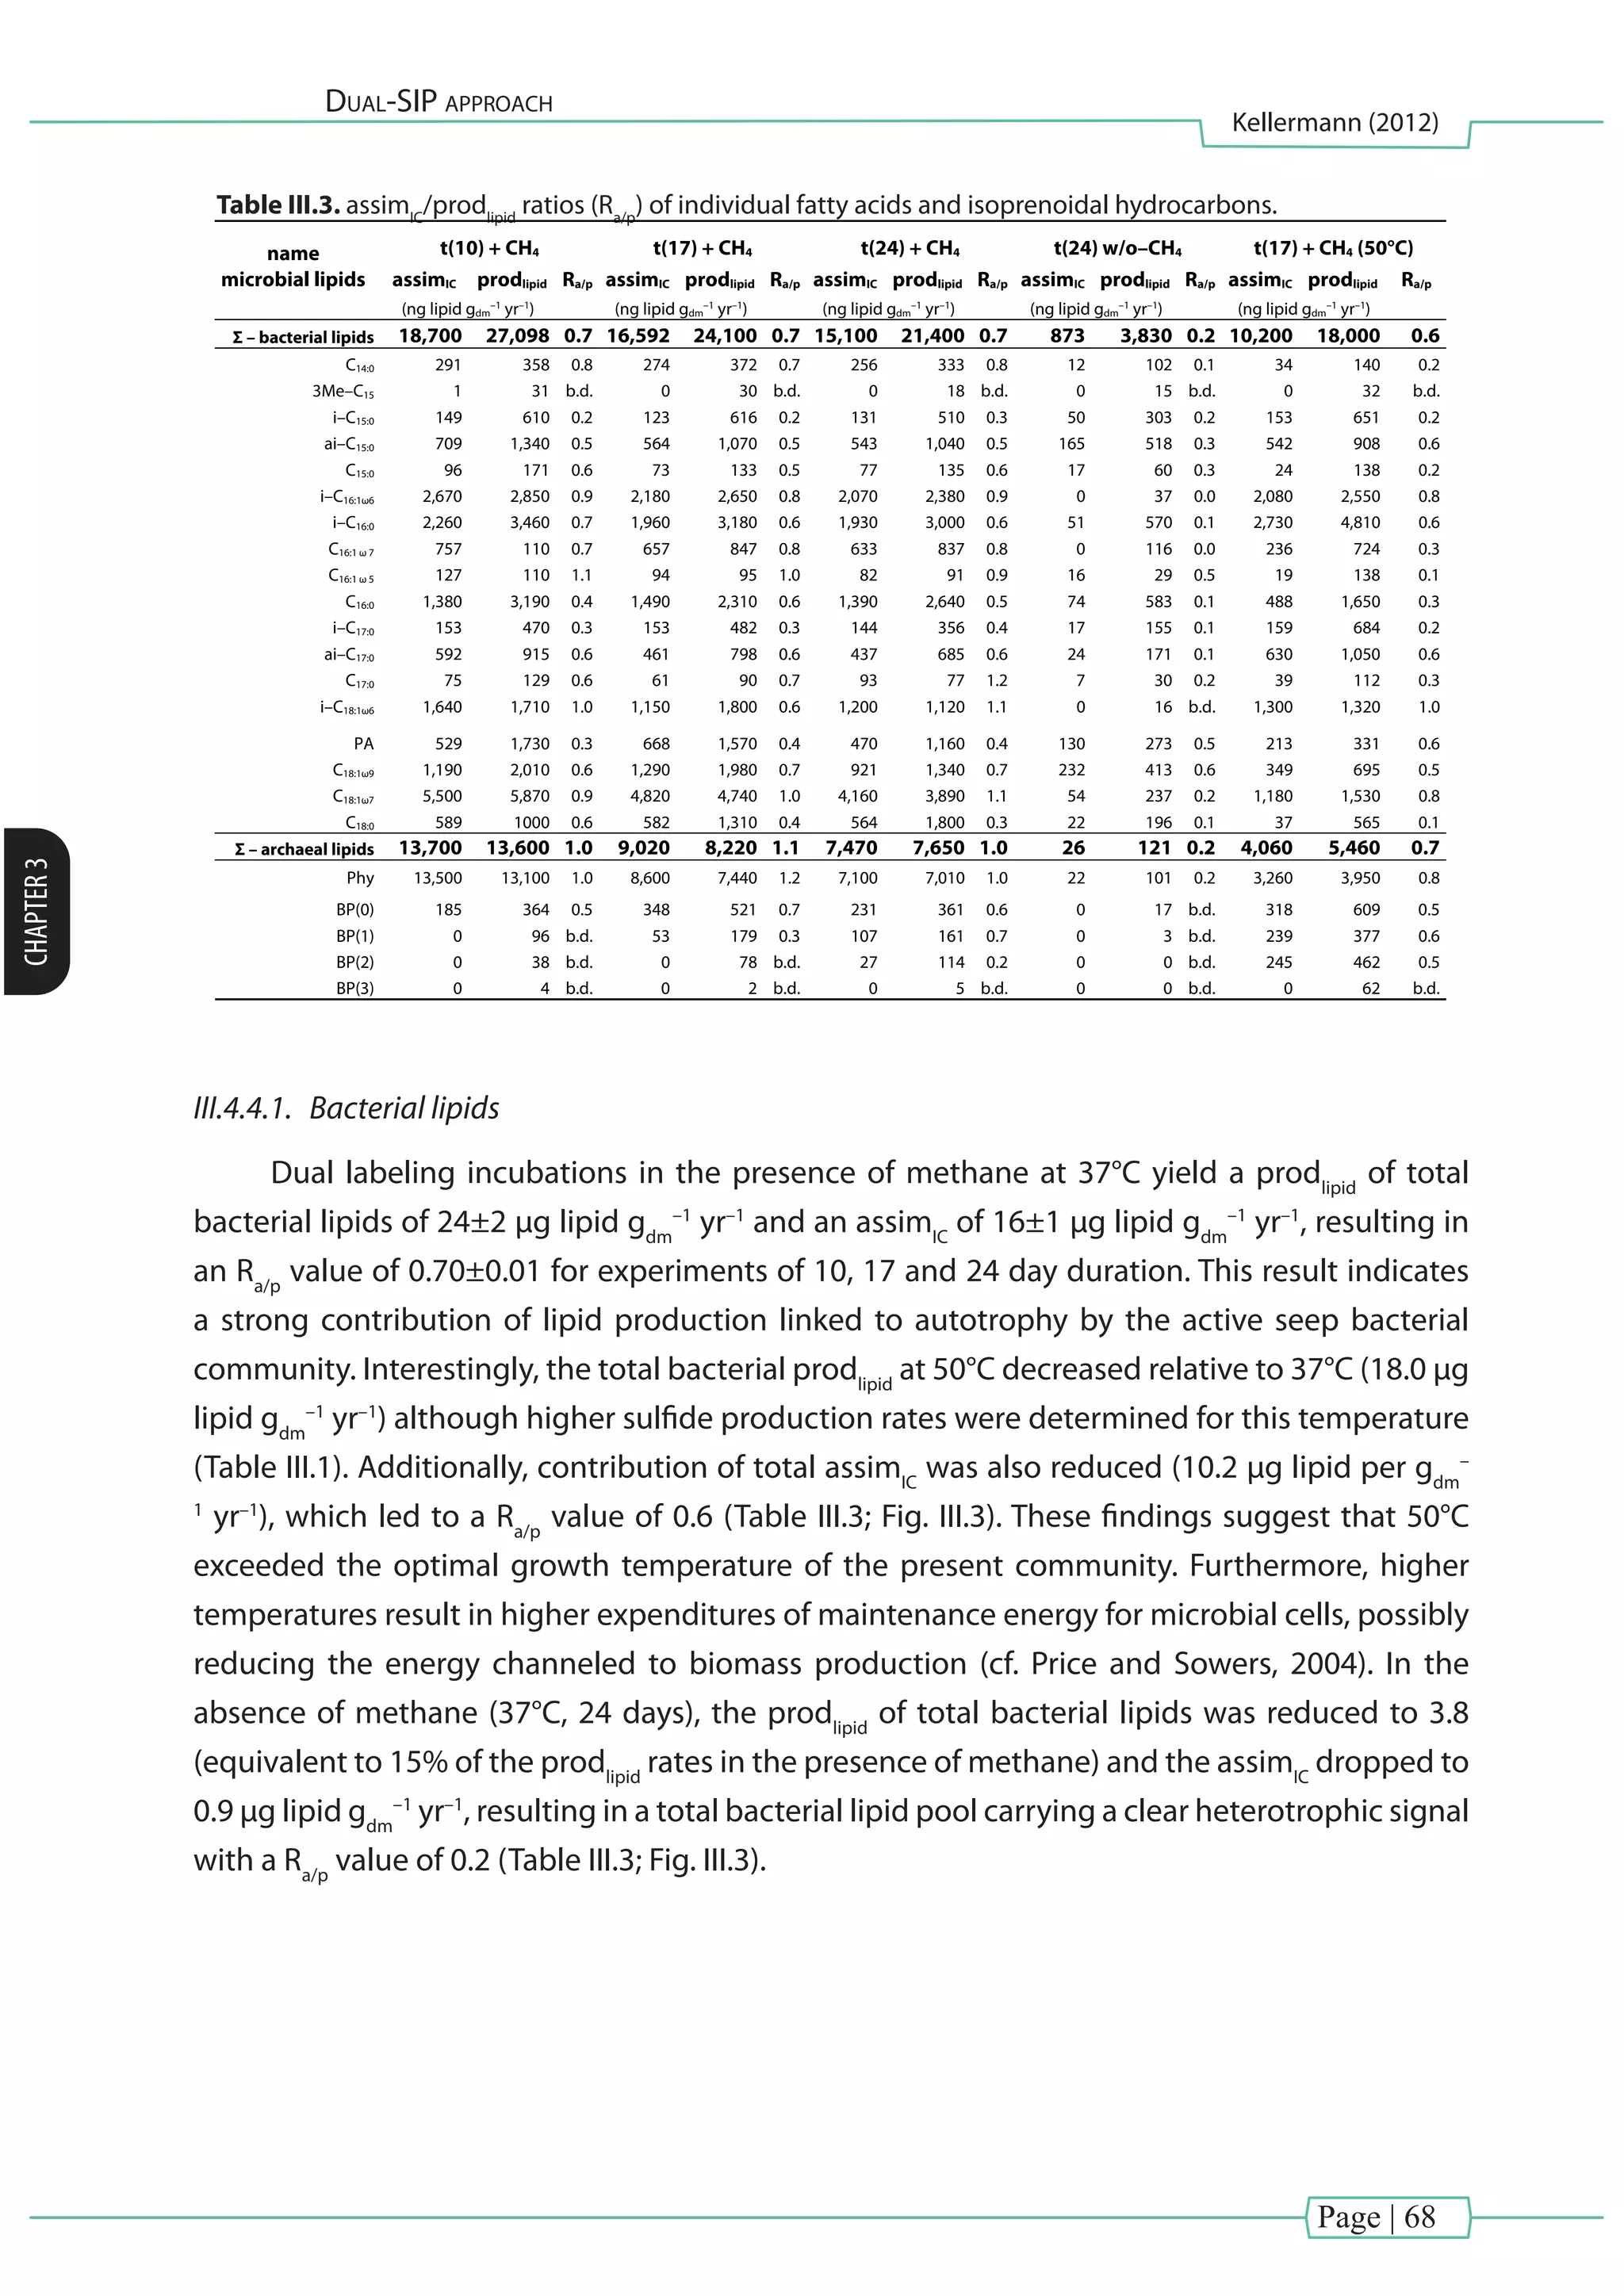
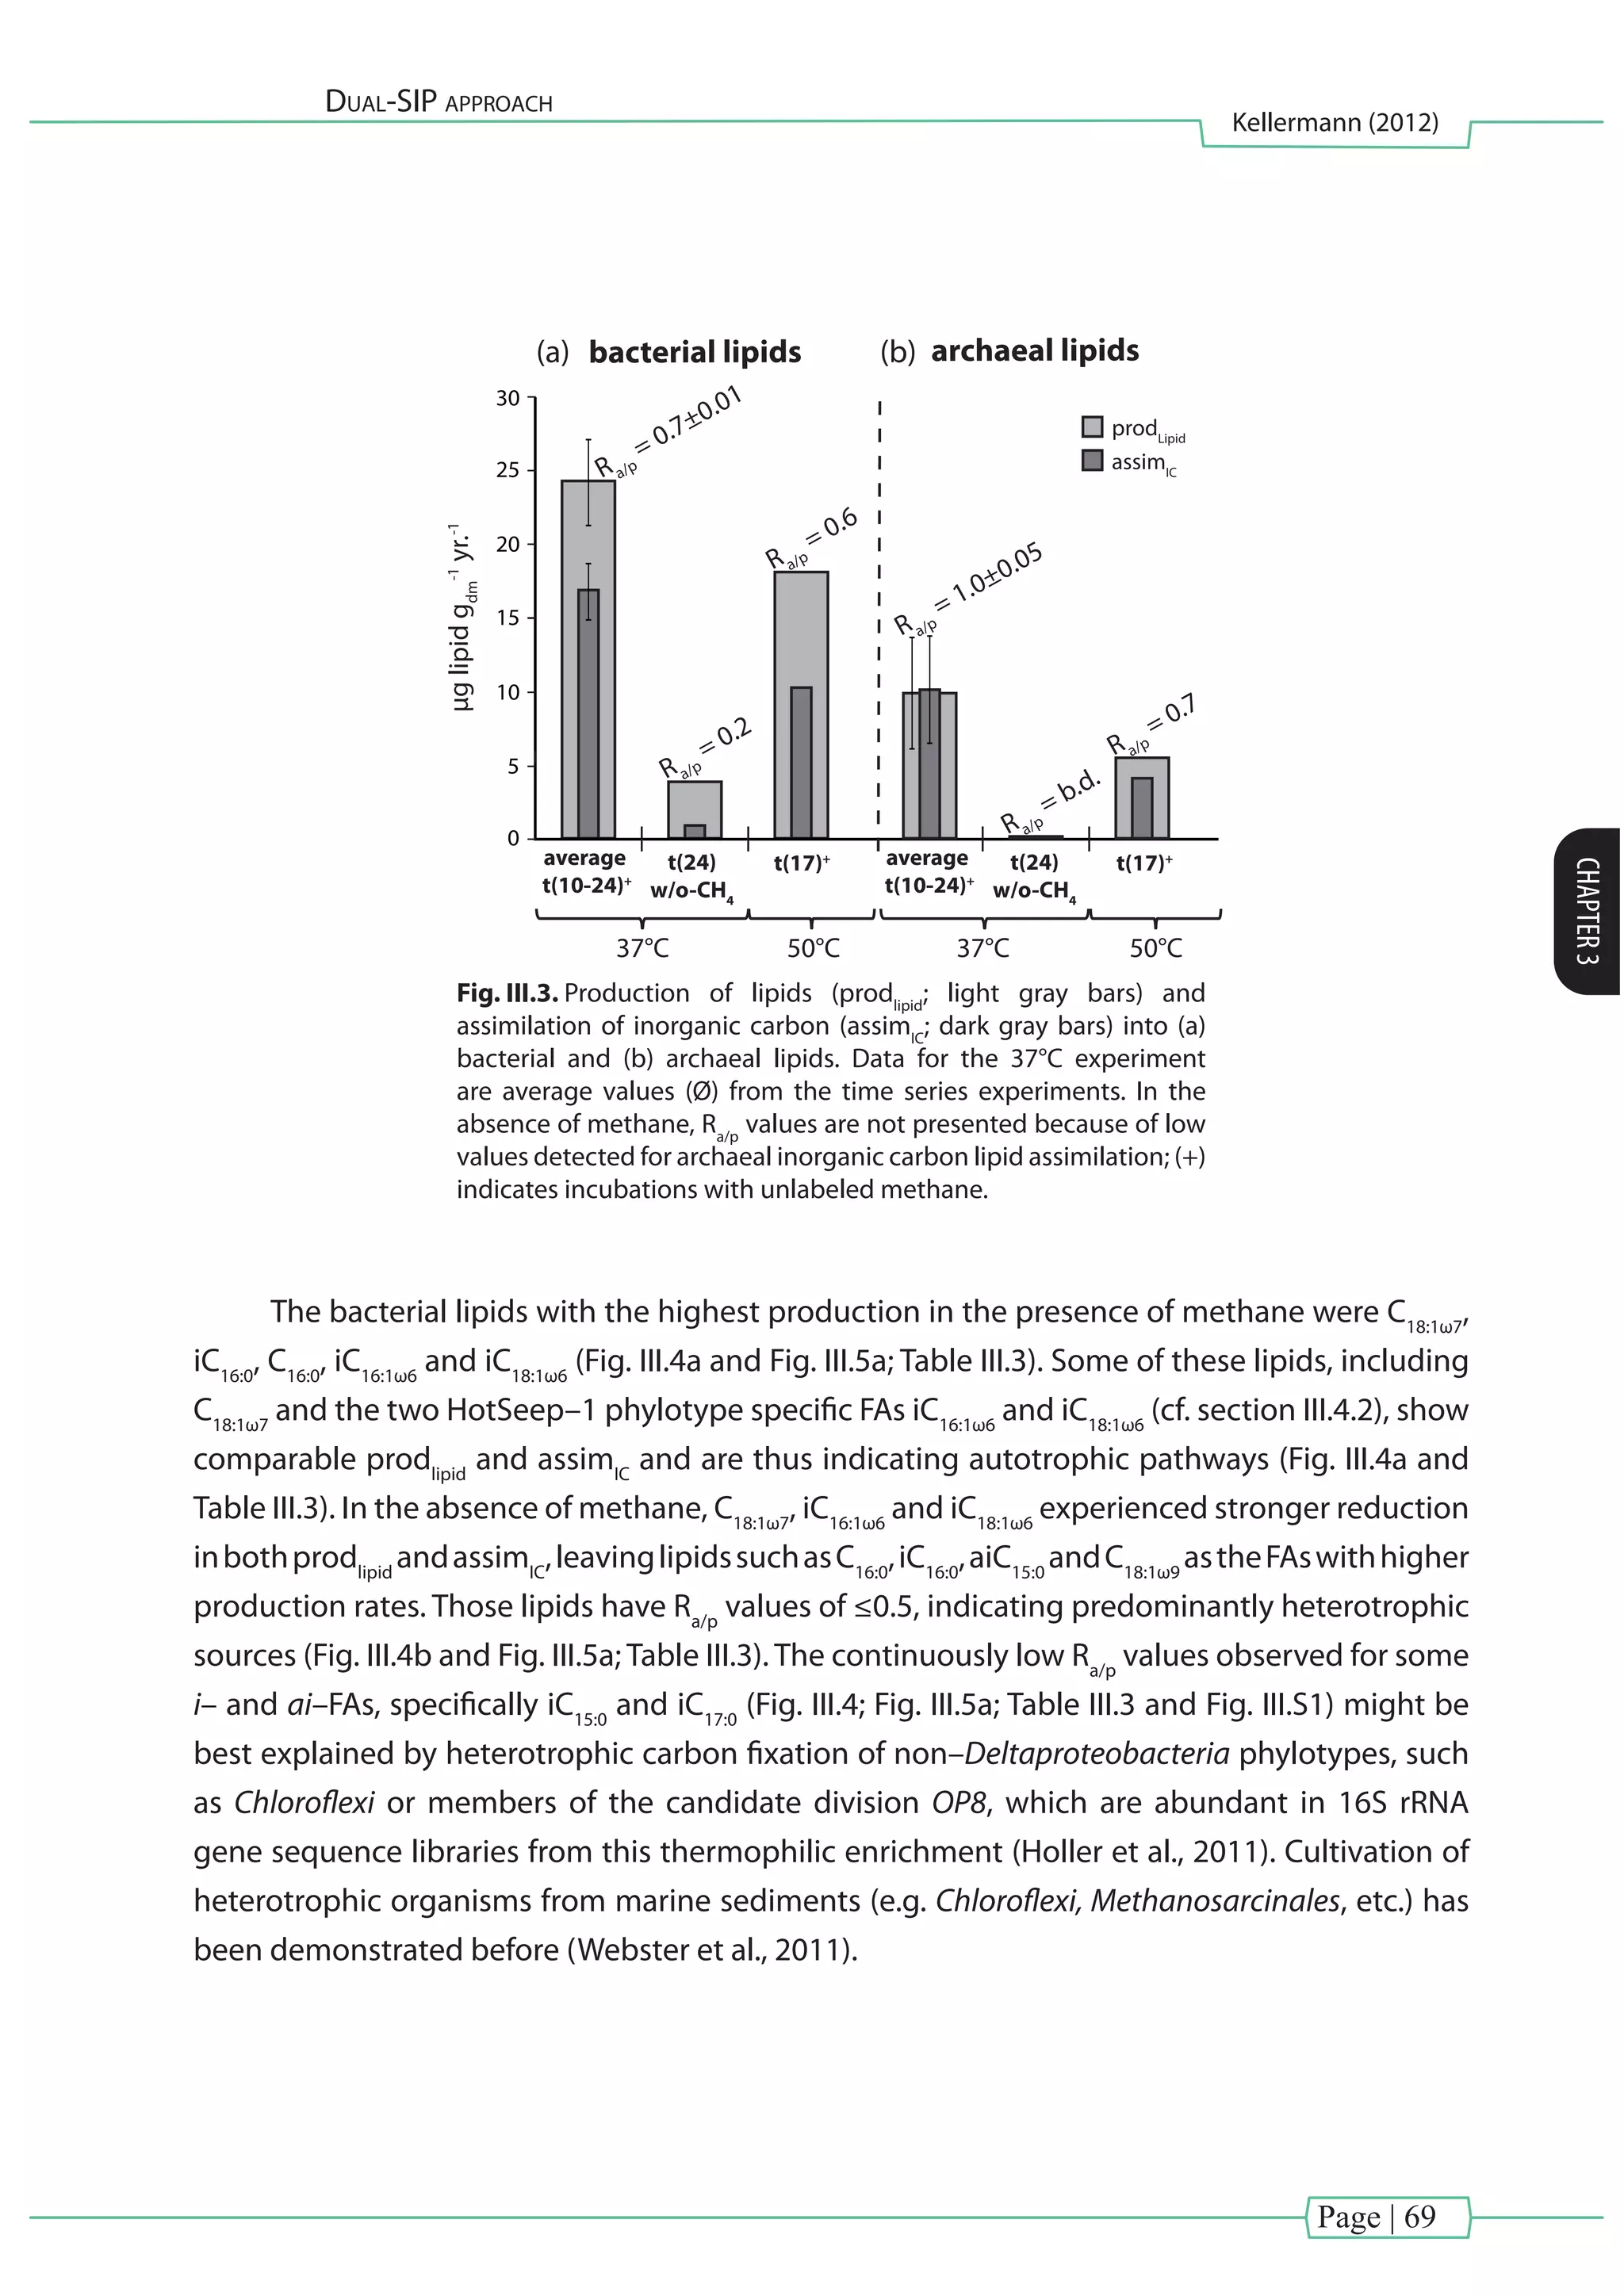
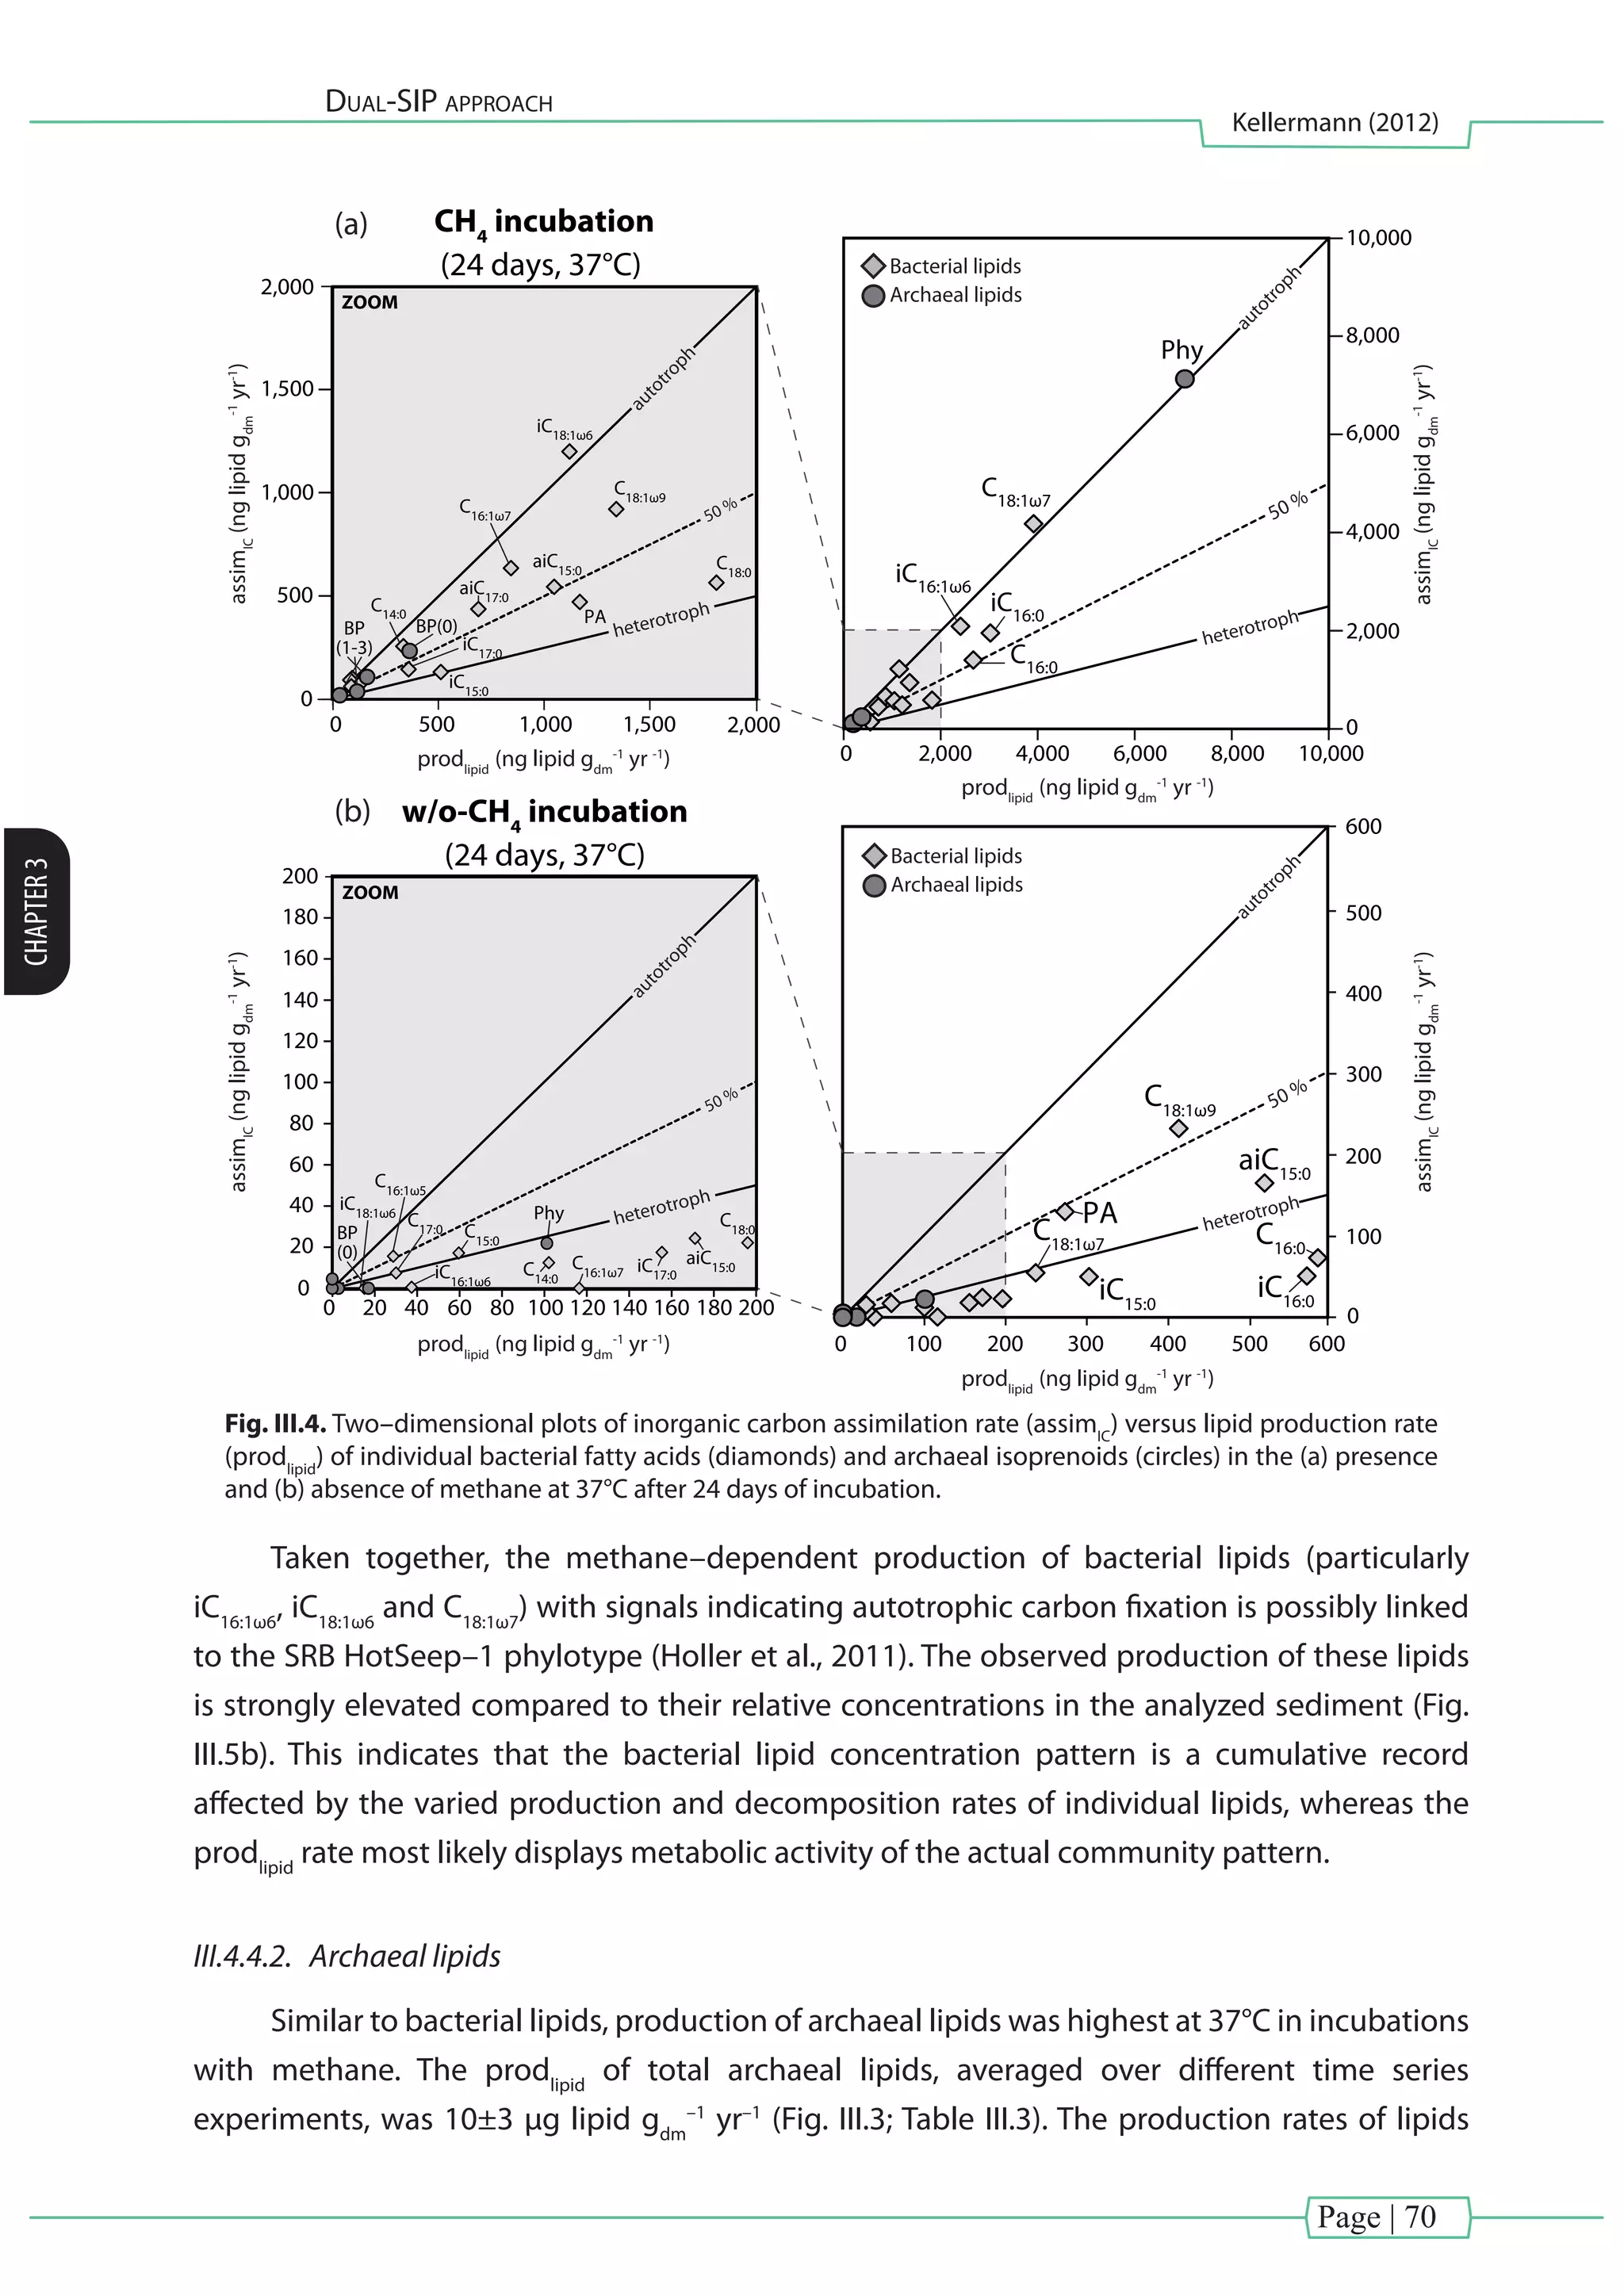
![Page | 71
Dual-SIP approach
Kellermann (2012)
CHAPTER3
and assimilation rates of carbon assimilation were similar (Ra/p
values of 1.03±0.05), implying
a strictly autotrophic archaeal community (Fig. III.3). At 50°C, the prodlipid
and assimIC
(5.4 and
4.1 µg lipid gdm
–1
yr–1
, respectively) of total archaeal lipids were both lower than those of the
37°C incubations and resulted in a lower Ra/p
value of 0.74 (Table III.3 ; Fig. III.S1). This suggests
an increasing contribution of heterotrophy at the higher temperature range, possibly related
to increased release of palatable substrates such as acetate from sedimentary organic matter
at elevated temperatures (Wellsbury et al., 1997). In the absence of methane, the archaeal
prodlipid
and assimIC
rates were marginal (0.1 and 0.03 µg lipid per gdm
–1
yr–1
, respectively; Fig.
III.3), demonstrating that the presence of methane is mandatory to sustain elevated growth of
archaeal communities in hot seep sediments.
Lipid production
[prodlipid
]
[prodlipid
] & [conclipid
] - normalized to C16:0
Lipid concentration
[conclipid
]
i-16:0
ai-17:0
ai-15:0
i-15:0
16:0
PA
18:1ω9
14:0
16:1ω5
17:0
15:0
i-17:0
BP(1)
16:1ω7
i-16:1ω6
18:1ω7
18:0
BP(0)
Phy
i-18:1ω6
(a) (b)
Ra/p
- values
heterotrophy autotrophy
0 0.2
0.3 1.0
0.4 0.6 0.8 1.2
BP(1)
Bulk
BP(0)
Bulk
Phy
i-16:1ω6
i-18:1ω6
16:1ω7
18:1ω7
18:0
i-16:0
16:0 ai-17:0
16:1ω5
18:1ω9
14:0
17:015:0
ai-15:0
i-15:0
i-17:0
PA
2
3
4
5
6
7
8
9
10
1
20
30
40
50
60
70
80
90
100
[assimIC
/ prodlipid
]
0
Influenceofmethaneonindividuallipidproduction
log[(prodlipid
+CH4
)/(prodlipid
-w/o-CH4
)]
Fig. III.5. (a) Illustration showing the increase of individual prodlipid
by methane addition compared to
incubations without methane, plotted against the ratio of assimIC
/ prodlipid
(Ra/p
). Archaeal (circles) and
bacterial (diamonds) derived lipids were either produced in the presence (black) or absence of methane
(gray). Ra/p
values could not be determined for iC18:1ω6
; iC16:1ω6
, C16:1ω7
, and for BP(0) and BP(1) in the absence of
methane due to assimIC
values close to the detection limit. (b) Distribution of C16:0
–normalized prodlipid
and
concentrations (conclipid
) (experiment: 37°C, 24 days) of individual lipids. Gray arrows indicate the direction
of changes in prodlipid
values (enhancement or reduction) relative to conclipid
. Gray bars indicate windows of
significance for heterotrophy or autotrophy.](https://image.slidesharecdn.com/54c05e1e-ddfa-426e-bc0d-230967ccb1b0-160817130319/75/PhD-thesis_Matthias-Kellermann-91-2048.jpg)
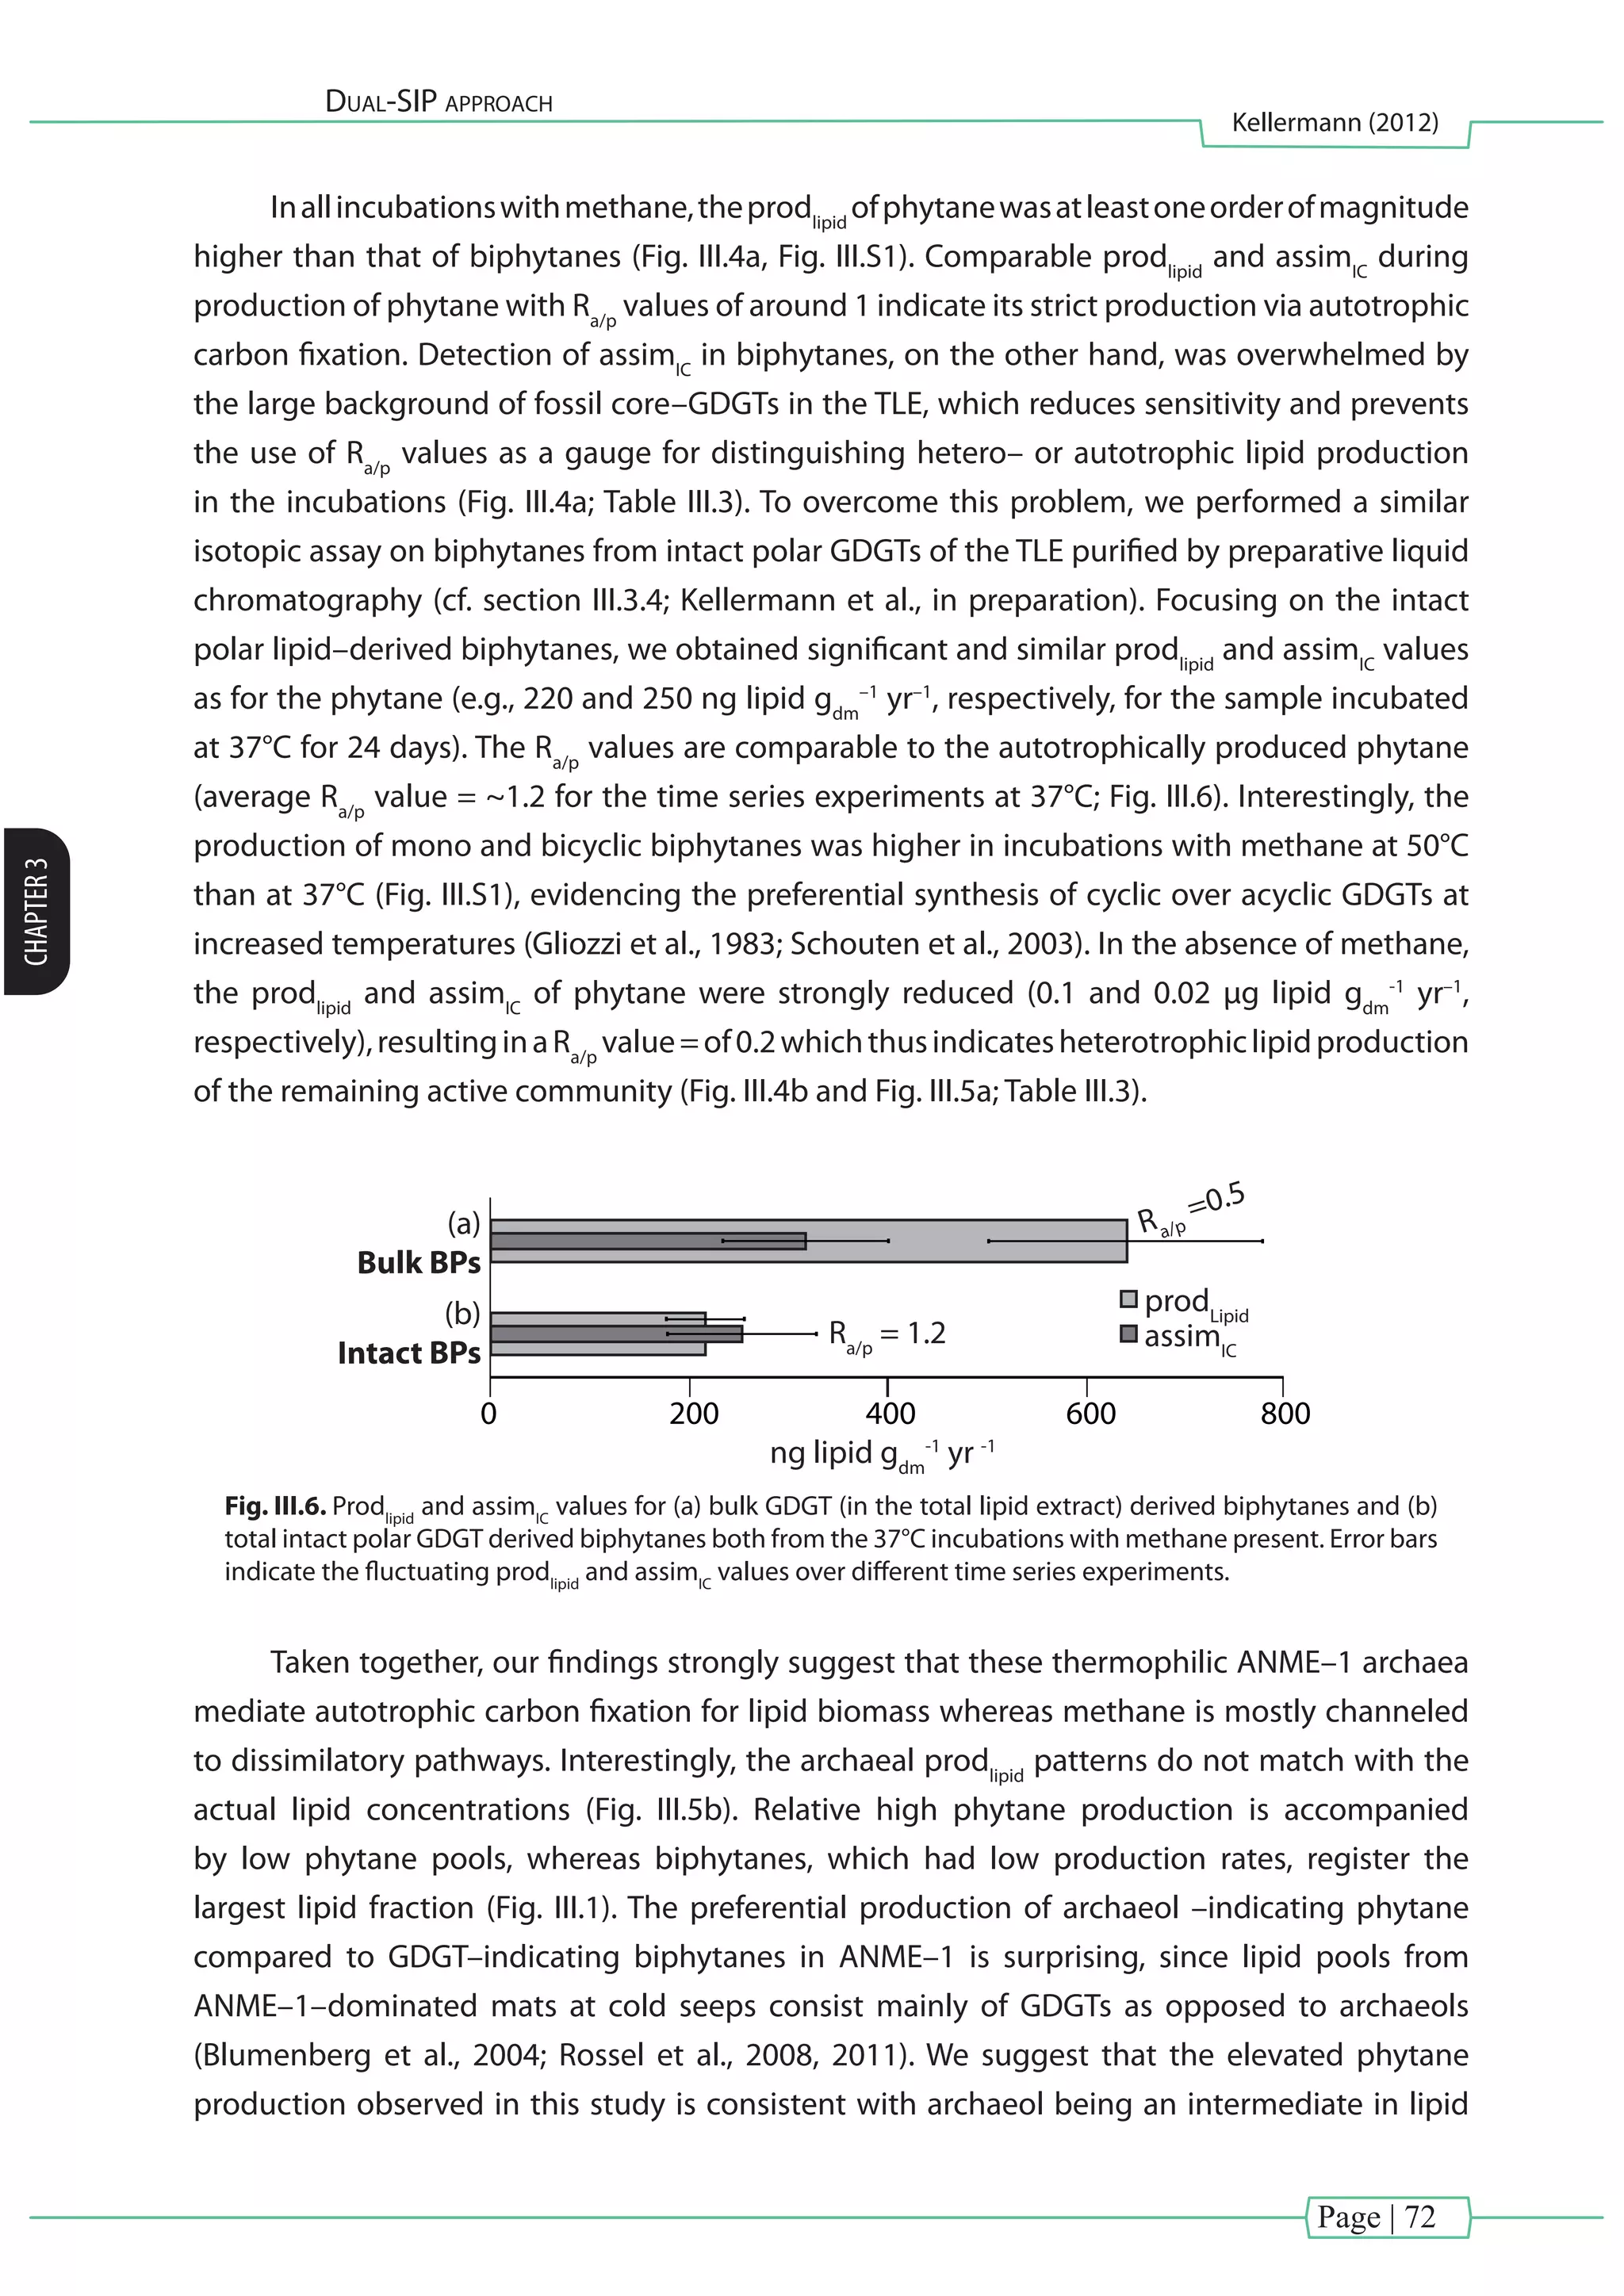
![Page | 74
Dual-SIP approach
Kellermann (2012)
CHAPTER3
III.7. Supporting information
50 %
ZOOM
iC18:1ω6
C18:1ω7
C18:1ω9
C16:1ω7
C16:0
C18:0
PA
iC15:0
iC17:0
aiC17:0
aiC15:0
iC16:0
BP (0-2)
Phy
iC16:1ω6
50 %
0
2,000
4,000
6,000
8,000
10,000
0 2,000 4,000 6,000 8,000 10,000
0
500
1,000
1,500
2,000
0 500 1,000 1,500 2,000
CH4
incubation
(17 days, 50°C)
autotroph
heterotroph
autotroph
heterotroph
Bacterial lipids
Archaeal lipids
assimIC
[nglipidgdm
-1
yr-1
]
prodlipid
(ng lipid gdm
-1
yr -1
)
Fig. III.S1. Two–dimensional plots of inorganic carbon assimilation rate (assimIC
) versus lipid production rate
(prodlipid
) of individual bacterial (diamonds) and archaeal (circles) lipids in the presence of methane at 50°C
and after 17 days of incubation.
0
50
208
M-43
(264)196
100 150 200 300250
50
100
RelativeAbundance
113
41
55
70
85
98
140
154
168182
196
208
absence or low abundance
of characteristic mass
fragments indicates
position of methyl group
interval of 12
atomic mass units
identifies double
bond position
236
250222
264 307
292
126
m/z
N C
iC16:1ω6
M+
: 307 (C20
H37
NO)
O
Fig. III.S2. Mass spectrum of the iC16:1ω6
pyrrolidine derivative enabling the determination
of double bond and methyl group positions (Andersson and Holman, 1974).](https://image.slidesharecdn.com/54c05e1e-ddfa-426e-bc0d-230967ccb1b0-160817130319/75/PhD-thesis_Matthias-Kellermann-94-2048.jpg)
![Page | 75
Dual-SIP approach
Kellermann (2012)
CHAPTER3
TableIII.S1.Absoluteconcentrations(averagedoverallexperiments)andisotopiccomposition(δ13
CandδD)ofindividualbacterialand
archaeallipidsfromeachtimepoint(T0,T10,T17,T24),temperatures(37and50°C)andsubstratecombinations(D2
Oand13
CDIC
;13CCH4
)
withandwithoutmethaneheadspace.
38
Name
microbial
lipids
absolute
concentration
t(0)
–nolabel–
t(10)
+CH4
t(17)
+CH4
t(24)
+CH4
t(24)
+13
CH4
t(24)
w/o–CH4
t(24)
–dead–
t(17)+CH4
(50°C)
δ13
CδDδ13
CδDδ13
CδDδ13
CδDδ13
CδDδ13
CδDδ13
CδDδ13
CδD
(nglipidgdm
–1
)[‰][‰][‰][‰][‰][‰][‰][‰]
Bacteria:
C14:01100–27–89371,700753,1001103,900–0.31–110–201,100–2877–141,100
3Me–C15410–21b.d.–21290–21550–21470–22b.d.–22370–24140–23600
i–C15:0880–49b.d.–8.43,7008.16,5003776–36b.d.–164,500–5276226,800
aiC15:0850–48–1201518,40022012,00032016,00025–170637,800–51–432109,700
C15:0460–29b.d.202,000352,600673,800–20b.d.–8.01,700–31100–8.32,700
i–C16:1ω6770–39–11079120,0001,10032,0001,50040,00079–190–39520–42301,10030,000
i–C16:01600–48–9229112,00045018,00065025,00025–150–304,600–5015065028,000
C16:1ω71100–37–861365,7002207,40031010,000–9.8–130–391,400–39730556,300
C16:1ω5200–46b.d.1092,8001504,2002005,800–26b.d.–0.111,700–47390–6.36,300
C16:05200–30–150333,200864,0001206,500–18–180–221,300–31–547.82,800
i–C17:0820–38–896.23,000375,300625,500–32–110–262,400–42230407,600
ai–C17:0900–50–1001075,0001608,1002309,900–20–140–352,400–528924011,000
C17:0470–30b.d.7.41,500221,700822,100–29b.d.–21790–37313.22,200
i–C18:1ω6300–44b.d.1,30031,0001,50056,0002,30049,000130b.d.–43620–44–781,70041,000
PA1400–32–180616,80017011,00017011,000–25–20023.02,400–35–92322,100
C18:1ω9770–41–19033014,00064024,00065022,0007.4–2001306,800–43–401408,100
C18:1ω71600–49–23078020,0001,20027,0001,50032,00055–230–291,700–50–3002508,600
C18:04500–27–1903.81,000252,500445,000–21–180–25370–2934–24960
Archaea:
Phy7,700–42–1503779,1004128,80049012,000100–230–4024–461301294,600
Bp(0)11,000–27–290–23–110–14150–14140–23–290–28–270–29–260–15220
Bp(1)4,100–47–260–49–130–42150–32250–41–260–48–250–50–240–23590
Bp(2)7,800–41–270–44–240–42–180–39–77–40–280–42–270–43–260–29280
Bp(3)3,700–18–260–18–250–18–250–18–240–18–260–17–260–17–240–21–110](https://image.slidesharecdn.com/54c05e1e-ddfa-426e-bc0d-230967ccb1b0-160817130319/75/PhD-thesis_Matthias-Kellermann-95-2048.jpg)
![Page | 77
Fragmentation patterns of archaeal IPLs
Kellermann (2012)
CHAPTER4
[Chapter IV] - Fragmentation patterns of archaeal IPLs
Systematic fragmentation patterns of archaeal intact polar lipids by high-
performance liquid chromatography/electrospray ionization ion-trap mass
spectrometry
Marcos Y. Yoshinaga1,2
*, Matthias Y. Kellermann1,2
, Pamela E. Rossel1,2†
, Florence Schubotz1,2‡
,
Julius S. Lipp1,2
and Kai-Uwe Hinrichs1
Published in Rapid Communication in Mass Spectrometry
Vol: 25 (2011), page: 3563-3574, doi:0.1002/rcm.5251
© 2011 John Wiley & Sons, Ltd.
1
MARUM – Center for Marine Environmental Sciences, University of Bremen. Leobener Str./MARUM,
28359 Bremen, Germany
2
Department of Geosciences, University of Bremen. Leobener Str./MARUM, 28359 Bremen, Germany
†
Present address: Max Planck Research Group for Marine Geochemistry, Carl von Ossietzky University,
ICBM, Carlvon- Ossietzky-Strasse 9–11, 26111 Oldenburg, Germany.
‡
Present address: Department of Earth and Planetary Sciences, Massachusetts Institute ofTechnology,
45 Carleton St, Cambridge, MA 02139, USA.
* Corresponding author.
Tel.: +49 421 218 65744; Fax: + 49 421 218 65715
E–mail address: marcosyukio@gmail.com
Keywords:
archaeal lipids | HPLC/ESI-ITMSn
| intact polar lipids | MS/MS fragmentation patterns](https://image.slidesharecdn.com/54c05e1e-ddfa-426e-bc0d-230967ccb1b0-160817130319/75/PhD-thesis_Matthias-Kellermann-97-2048.jpg)
![Page | 79
Fragmentation patterns of archaeal IPLs
Kellermann (2012)
CHAPTER4
(a)
(b)
O
O
O
O
O
O
Phospho
H
Glyco
Phospho
Glyco
headgroup
glycerol
isoprenoidal chains
glycerol
(C20
)
(C20
or C25
)
O
O
O
OH
headgroup
glycerol
isoprenoidal chains
INTACT GDGTs
INTACT ARCHAEOLs
Gly-GDGT
1472 - 1482 (NH4
+
)
2Gly-GDGT or Gly-GDGT-Gly
1634 - 1644 (NH4
+
)
PG-GDGT
1446 - 1456 (H+
)
1463 - 1473 (NH4
+
)
Gly-GDGT-PG
1626 - 1636 (NH4
+
)
PG-GDGT-PG
1600 - 1610 (H+
)
1617 - 1627 (NH4
+
)
PG-GDGT-PE
1569-1579 (H+
)
2Gly-GDGT-PG
1771 - 1781 (H+
)
1788 - 1798 (NH4
+
)
3Gly-GDGT
1796 - 1806 (NH4
+
)
800
900
1000
1600
1700
1800
1900
2000
1500
700
600
Gly-AR
832 (H+
)
2Gly-AR
994 (NH4
+
) 977 (H+
)
PA-OH-AR
749 (H+
)
PG-AR
807 (H+
) 824 (NH4
+
)
PG-OH-AR
823 (H+
)
PE-AR
776 (H+)
PE-OH-AR
792 (H+
)
PE-MAR
770-774 (H+
)
PS-AR
820 (H+
)
PI-AR
895 (H+
) 912 (NH4
+
)
PS-OH-AR
836 (H+
)
PS-uns-OH-AR
832 (H+
)
PI-OH-AR
911 (H+
) 928 (NH4
+
)
Gly-PS-OH-AR
998 (H+
)PI-ext-OH-AR
981 (H+
) 998 (NH4
+
)
PS-diOH-AR
852 (H+
)
3Gly-AR
1156 (NH4
+
)
Phospho
H
Glyco
headgroup
m/z
increasing polarity
Fig. IV.1. (a) Schematic structures of archaeal IPLs, showing DGDs and GDGTs. Major structural differences
influencingMS/MSfragmentationofIPLsarerelatedtoheadgroups(glyco-,phospho-orglycophospho-based)
and functionalization of isoprenoidal alkyl substituents. The latter can vary not only in length (C20
, C25
and C40
),
but also contain OH-groups, double bonds and cyclopentane and cyclohexane rings. (b) Schematic density
map plot showing the major diagnostic ions of selected archaeal lipids in MS1
mode, including the majority of
headgroups found in this study, and their elution time during normal-phase/positive-mode HPLC/ ESI-ITMSn
.
Thin and thick bars represent molecular masses of intact archaeols (m/z<1200) and intact GDGTs (m/z >1400),
respectively. For the latter, the range of [M H] is given because these compounds are often observed acyclic
or containing one to five rings in their core lipids. Filled and open bars represent major and minor adduct
formation,respectively.Notethatglycolipidsarecommonlyionizedasammoniumadducts,whereasphospho-
and mixed phosphoglycolipids (e.g., Gly-PS-OH-AR) are often found in their protonated form. Compound
abbreviations, GDGT: glycerol dibiphytanyl glycerol tetraether (C40
-C40
isoprenoidal chains); DGD: glycerol
dialkyl diether; AR: archaeol (C20
-C20
isoprenoidal chains); Ext-AR: extendedarchaeol (C20
-C25
isoprenoidal
chains); OH-AR: monohydroxylated-archaeol; diOH-AR: dihydroxylated-archaeol; Uns-AR: unsaturated-
archaeol; MAR: macrocyclic-archaeol; Gly: glycosyl (hexose); dGly: deoxy-glycosyl; PA: phosphatidic acid;
PE: phosphatidylethanolamine; PME: phosphatidylmethylethanolamine; PG: phosphatidylglycerol; PGP:
phosphatidylglycerolphosphate; PI: phosphatidylinositol; PS: phosphatidylserine.](https://image.slidesharecdn.com/54c05e1e-ddfa-426e-bc0d-230967ccb1b0-160817130319/75/PhD-thesis_Matthias-Kellermann-99-2048.jpg)
![Page | 82
Fragmentation patterns of archaeal IPLs
Kellermann (2012)
CHAPTER4
collector (Gilson Inc., Middleton, WI, USA). The flow rate was set to 1.5 mL min–1
, and the eluent
gradient was: 100% A to 100% B in 120 min, hold at 100% B for 30 min, then 30 min column re-
equilibration with 100% A, where eluent A was n-hexane/propan-2-ol (79:20, v/v) and eluent B
was propan-2-ol/Milli-Q water (90:10, v/v). Fractions were collected in time windows between
5 to 10 min and were subsequently analyzed by HPLC/ESI-ITMSn
. Identification of compounds
was based on mass spectral information in MS2
in positive ionization mode. Additional and
complementary fragmentation patterns can be also obtained in negative ionization mode and
in MS3
in positive and negative ionization modes (Sturt et al., 2004). The structures of archaeal
IPLs presented in the paper are tentative. However, fragmentation patterns were confirmed
with commercially available standards (e.g., PE-AR, Gly-GDGT-PG) and with complementary
analysis of core lipids by GC/MS and HPLC/APCI (for DGDs and GDGTs, respectively).
IV.4. Results
We identified a systematic fragmentation of archaeal IPLs under MS/MS conditions that is
related to the structural properties of headgroups and isoprenoidal chains. Stereoconfiguration
oftheglycerolbackbonecannotberesolvedbyESI-ITMSn
,sothattheexactsn-2orsn-3positions
for isoprenoidal chains and their functional groups (e.g., hydroxyl group) or double bounds
cannot be predicted in DGDs. Likewise, the number of rings and their position in intact GDGTs
cannot be determined.
Here we focused on fragmentation patterns observed in positive ionization mode (Fig.
IV.1b),becauseityieldsmoredetailedinformationonstructuralpropertiesofisoprenoidalchains.
Molecular ions of IPLs obtained in positive mode are observed either in their protonated form
([M H]) or as an ammonium adduct ([M NH4
]). Typically, glycolipids are present as ammonium
adducts, while phospholipids tend to be protonated, but a few exceptions in adduct formation
areobservedandillustratedinFig.IV.1b.AlthoughMS2
experimentsaresufficientforcompound
elucidation, positive mode MS3
can be useful for further elucidation of core lipids, especially for
glycophospholipids, and intact polar GDGTs.
Neutral losses of alkyl substituents in MS2
experiments are generally associated with
the transfer of an H-atom from the cleaved phytanyl substituent and two H-atoms from the
biphytanyl substituent, as also observed by Knappy et al. (2009), resulting in a charged residual
fragment of 1 and 2 Da higher mass, respectively. For example, in ARs, a saturated phytanyl
substituent is lost as phytane (280.3 Da) and the biphytanyl substituent is presumably lost
as a biphytadiene (558.6 Da). In order to distinguish losses of saturated vs. unsaturated alkyl
substituents, we will therefore refer to the degree of unsaturation in the original compound
and not the cleaved fragment (e.g., phytanyl for saturated ARs and phytenyl for (poly)-
unsaturated ARs). Similarly, losses resulting from cleavage of hexoses or phosphoester-linked
polar headgroups (e.g., ethanolamine from phosphatidylethanolamine (PE)) are associated
with the transfer of an H-atom to the charged core fragment.](https://image.slidesharecdn.com/54c05e1e-ddfa-426e-bc0d-230967ccb1b0-160817130319/75/PhD-thesis_Matthias-Kellermann-102-2048.jpg)
![Page | 83
Fragmentation patterns of archaeal IPLs
Kellermann (2012)
CHAPTER4
TableIV.1.ArchaealIPLsfromenvironmentalsamplesorganizedaccordingtoheadgroupsandcorelipidcharacteristics.Molecularmasseswithtypesofadduct
formationinpositiveionmodeMS1,neutralfragmentsanddiagnosticionsinMS2experimentsareshown.Forcompoundabbreviationsseemaintext.Detailed
interpretationsofmassspectraareavailableinthemaintextandintheAppendices(seeSupportingInformation).
Table1.ArchaealIPLsfromenvironmentalsamplesorganizedaccordingtoheadgroupsandcorelipidcharacteristics.Molecularmasseswithtypesofadductformationin
positiveionmodeMS1
,neutralfragmentsanddiagnosticionsinMS2
experimentsareshown.Forcompoundabbreviationsseemaintext.Detailedinterpretationsofmass
spectraareavailableinthemaintextandintheAppendices(seeSupportingInformation)
IPLa
m/z
Neutrallossesb
(Da)Diagnosticionsc
inMS2
Sample
locationd
PhosphoarchaeolsPA-AR733.6[MH]phytanyl-1H=280.3453.3,357.4A
PA-OH-AR749.6[MH]OH-phytanyl-1H=296.3453.3A,B,D,E
PG-AR807.7[MH]74.0(lossofglycerol)733.6,653.7,527.4,373.4A,B,D,E
PG-OH-AR823.7[MH]OH-phytanyl-1H=296.3527.4A,B,D,E
PG-diOH-AR839.7[MH]TwotimesOH-phytanyl-1H=296.3247.1,543.4(525.4)A
PG-Uns(2)-OH-AR817.6[MH]phytadienyl-1H=276.3,OH-phytanyl-1H=296.3541.3(523.3),247.1A
PG-Uns(1)-Ext-OH-AR891.7[MH]sesterterpenyl-1H=348.3,OH-phytanyl-1H=296.3543.4(525.4),595.4,247.1A
PE-AR776.7[MH]43.0(lossofethanolamine)733.6,453.3,357.4A,B,C,D,E
PE-OH-AR792.7[MH]OH-phytanyl-1H=296.3496.4,453.3A,B,C,D,E
PME-AR790.7[MH]57.0(lossofmethyl-ethanolamine)733.6,453.3,357.4A,C
PME-OH-AR806.7[MH]OH-phytanyl-1H=296.3510.4,453.3C
PS-AR820.7[MH]87.0(lossofserine)733.6,453.3,357.4A,D
PS-OH-AR836.7[MH]OH-phytanyl-1H=296.3540.4(522.4),453.3A,D
PS-diOH-AR852.7[MH]TwotimesOH-phytanyl-1H=296.3556.4(538.4),260.1A,D,E
PS-Uns(2)-AR816.6[MH]phytadienyl-1H=276.3540.4,260.1A
PS-Uns(5)-AR810.6[MH]phytadienyl-1H=276.3,phytatrienyl-1H=274.3534.3,260.1A
PS-Uns(2)-OH-AR832.6[MH]phytadienyl-1H=276.3,OH-phytanyl-1H=296.3556.4(538.4),260.1A
PS-Uns(1)-diOH-AR850.7[MH]OH-phytenyl-1H=294.3,OH-phytanyl-1H=296.3554.3(536.3),556.4
(538.4),260.1
A
PS-Ext-OH-AR906.8[MH]OH-phytanyl-1H=296.3610.4(592.4),260.1A
PI-AR895.7[MH]162.1(lossofinositol)733.6,653.7,615.4A,D
PI-OH-AR911.7[MH]OH-phytanyl-1H=296.3615.4,261.0A,D,E
PI-diOH-AR927.7[MH]TwotimesOH-phytanyl-1H=296.3631.4,335.1,261.0A
PI-Uns(2)-OH-AR907.7[MH]phytadienyl-1H=276.3,OH-phytanyl-1H=296.3631.4,335.1A
PI-Ext-OH-AR981.8[MH]OH-phytanyl-1H=296.3685.5,261.0A,D,E
PI-Ext-Uns(1)-OH-AR979.8[MH]sesterterpenyl-1H=348.3,OH-phytanyl-1H=296.3683.4,631.4,335.1A
PI-Ext-Uns(5)-OH-AR971.7[MH]340.3(sesterterpapentenylchain),OH-phytanyl-
1H=296.3
631.4(613.4),335.1A
PI-Ext-Uns(4)-diOH-AR989.7[MH]358.3(OH-sesterterpatetraenylchain),OH-phytanyl-
1H=296.3
631.4(613.4),335.1A
GlycoarchaeolsGly-AR832.8[MNH4]179.1(lossofhexoseplusNH3)653.7,373.4A
Gly-OH-AR848.8[MNH4]179.1(lossofhexoseplusNH3),OH-phytanyl-1H=296.3669.7(651.7),373.4A,D
2Gly-AR994.8[MNH4]341.1(lossoftwohexosesplusNH3)653.7,373.4A,B,D,E
2Gly-Uns-AR992.8[MNH4]341.1(lossoftwohexosesplusNH3),phytenyl-1H=278.3813.7,651.7,535.4,373.4A,D
3Gly-AR1156.9[MNH4]503.1(lossofthreehexosesplusNH3)653.7,373.4A
3Gly-Uns-AR1154.8[MNH4]503.1(lossofthreehexosesplusNH3),phytenyl-
1H=278.3
813.7,651.7,535.4,373.4A
M. Y. Yoshinaga et al.
wileyonlinelibrary.com/journal/rcm Copyright © 2011 John Wiley & Sons, Ltd. Rapid Commun. Mass Spectrom. 2011, 25, 3563–3574
3566](https://image.slidesharecdn.com/54c05e1e-ddfa-426e-bc0d-230967ccb1b0-160817130319/75/PhD-thesis_Matthias-Kellermann-103-2048.jpg)
![Page | 84
Fragmentation patterns of archaeal IPLs
Kellermann (2012)
CHAPTER4
TableIV.1.(continued)
Table1.(Continued)
IPLa
m/z
Neutrallossesb
(Da)Diagnosticionsc
inMS2
Sample
locationd
Glyco-phospho-
archaeol
Gly-PS-OH-AR998.7[MH]162.1(lossofonehexose),OH-phytanyl-1H=296.3836.7(818.7),540.4(522.4)A,D
Macrocyclic-
archaeol
PE-MAR(2)770.6[MH]43.0(lossofethanolaminefromheadgroup)727.6,629.6,553.6B
Glyco-GDGTsGly-GDGT(2)1477.4[MNH4]179.1(lossofonehexoseplusNH3)1298.3,743.7A,B,E
2Gly-GDGT(1)1641.4[MNH4]341.1(lossoftwohexosesplusNH3)1462.4,1300.3,743.7A,B,D,E
3Gly-GDGT(2)1801.5[MNH4]503.1(lossofthreehexosesplusNH3)1460.4,1298.3A,D,E
4Gly-GDGT(1)1965.5[MNH4]665.1(lossofthreehexosesplusNH3)1462.4,1300.3,743.7A,D
2Gly-GDGT(2)-dGly1785.5[MNH4]341.1(lossoftwohexosesplusNH3
+
),146.1
(lossofdeoxysugar)
1444.3,1298.3A,D
Phospho-GDGTsPG-GDGT(1)1454.3[MH]74.0(lossofglycerol),80.0(lossofPA)1380.3,1300.3(1282.3),
897.7
A,B,D,E
PG-GDGT(2)-PG1606.3[MH]154.0(lossofPG),74.0(lossofglycerol)1452.3(1434.3),1378.3,
1298.3
A,B,D,E
PG-GDGT(2)-PGP1686.3[MH]234.0(lossofPGP)1452.3D
PG-GDGT(1)-PE1577.3[MH]154.0(lossofPG),43.0(lossofethanolamine)1423.3,1380.3A,D,E
Glyco-Phospho-
GDGTs
Gly-GDGT(2)-PG1631.4[MNH4]179.1(lossofonehexoseplusNH3)1452.3A,D
2Gly-GDGT(2)-PG1793.4[MNH4]342.1(lossoftwohexosesplusNH3)1452.3,897.7A,D,E
2Gly-GDGT(1)-PE1747.4[MH]324.1(lossoftwohexoses),43.0(lossofethanolamine)1423.3,1380.3A,D
2Gly-GDGT(1)-PME1761.4[MH]324.1(lossoftwohexoses)1437.3,823.7A
a
Numberinparenthesesforarchaeolsdenotesthenumberofunsaturationsinisoprenoidalchains,andinMARandGDGTsitdenotesthenumberofcyclopentylrings.
b
NotethatneutrallossesinMS/MSexperimentsareassociatedwithtransferofoneH-atomfromthecleavedphytanylsubstituentandtwoH-atomsfromthebiphytanyl
substituent.
c
DiagnosticionsinboldindicatethemajorbasepeakobservedinMS2
spectra.
d
A=Makrancoldseeps,B=Cascadiamarginsediments,C=Alaskanlakes,D=Rosseletal.,[17,20]
E=Schubotzetal.[21]
Fragmentation patterns of archaeal intact polar lipids
wileyonlinelibraryCopyright © 2011 John Wiley & Sons, Ltd.Rapid Commun. Mass Spectrom. 2011, 25, 3563–3574](https://image.slidesharecdn.com/54c05e1e-ddfa-426e-bc0d-230967ccb1b0-160817130319/75/PhD-thesis_Matthias-Kellermann-104-2048.jpg)
![Page | 85
Fragmentation patterns of archaeal IPLs
Kellermann (2012)
CHAPTER4
In the following section, we classify several archaeal IPLs according to their distinct
structural characteristics, and demonstrate how these features influence fragmentation
patterns during ESI-ITMSn
. A complete list of compounds is given in Table IV.1 and examples of
mass spectral interpretations are given throughout the manuscript.
IV.4.1. C20
- C20
Saturated Intact polar DGDS
In MS2
experiments, saturated intact archaeols give a base peak corresponding to the
neutral loss of the headgroup (Fig. IV.2a and Fig. IV.2b). Glycosylated (Gly) ARs lose the sugar
headgroup(s), yielding a core AR fragment ion of m/z 653.7 (Table IV.1). On the other hand,
phospho-based(Phos)ARspartiallylosetheirheadgroup(e.g.glycerolfromphosphatidylglycerol
(PG), serine from phosphatidylserine (PS)), while retaining phosphatidic acid (PA), as shown by
the major base peak at m/z 733.6. Minor fragment ions, particularly at m/z 373.4 (for Gly-AR,
Fig. IV.2) and m/z 453.3 (for Phos-AR, Fig. 2(b)), result from the loss of one phytanyl group (as
phytene, 280.3 Da loss) from major ions in MS2
(Table IV.1). Consequently, the polar headgroup
can be identified by subtraction of m/z 653.7 (AR) for Gly-ARs and m/z 733.6 (PA-AR) for Phos-
ARs from the [M H] deduced in MS1
experiments.
IV.4.2. Hydroxylated, saturated C20
- C20
intact polar DGDS
Fragmentation of Gly-mono-hydroxy (OH) AR in MS2
is similar to saturated Gly-ARs, with
the distinction that Gly-OH-AR shows a base peak at m/z 373.4 (Fig. IV.2c). This fragment ion
derives from the concerted losses of the sugar headgroup (hexose plus 17 Da of NH3
, 179.1 Da
loss) and the OH-phytanyl chain (lost as OH-phytene, 296.3 Da). Ions at m/z 669.7 and 651.7
arise from the exclusive loss of the sugar headgroup. The former fragment ion is equivalent
to the OH-AR core lipid while the latter results from additional loss of water, presumably from
the phytanyl moiety. The base peak of Phos-OH-ARs in MS2
spectra results from the loss of the
OH-phytanyl chain, i.e. a 296.3 Da loss (Table 1, Fig. IV.2d). Polar headgroup assignments can be
obtained by subtraction of m/z 749.6 (PA-OH-AR) for Phos-OH-ARs from the [M H] deduced in
MS1
experiments.
Dihydroxy (diOH) ARs were characterized by single hydroxylation of each phytanyl
substituent and were only observed in combination with Phos-based headgroups, exclusively
the PG, PS and PI (Table IV.1). Fragmentation of this IPL class involves two losses of OH-phytanyl
(296.3 Da) chains, thus a Phos-based headgroup attached to a glycerol backbone appears as
the major fragment ion in MS2
spectra (Fig. IV.2e). Minor fragment ions derived from the loss of
one OH-phytanyl chain.](https://image.slidesharecdn.com/54c05e1e-ddfa-426e-bc0d-230967ccb1b0-160817130319/75/PhD-thesis_Matthias-Kellermann-105-2048.jpg)
![Page | 86
Fragmentation patterns of archaeal IPLs
Kellermann (2012)
CHAPTER4
653
373
RelativeAbundance
(a)
2Gly-AR
[M NH4
] = 994.8
653.7
373.4
O O
OO
OHHO
HO
O
O
OHHO
HO
HO +NH4
733
+H
RelativeAbundance
(b)
PE-AR
[M H] = 776.7
733.6
453.3
357.4
O O
O
P
O
O
OH
H2N
453
RelativeAbundance
(c)
1Gly-OH-AR
[M NH4
] = 848.8
373.4
651.7
669.7
O O
OO
OHHO
HO
HO OH
669 (651)
373
+NH4
+H
RelativeAbundance
(d)
PE-OH-AR
[M H] = 792.7
496.4
453.3
O O
O
P
O
O
OH
H2N
OH
496
453
200100 300 400 500 600 700
m/z
800 900 1000 12001100
Fig. IV.2. Positive mode MS2
spectra of selected archaeal lipids. (a–h) Gly- and Phos-based C20
-C20
ARs with
saturated, monohydroxylated (OH), dihydroxylated (diOH) and unsaturated (Uns) core lipids; (i, j) saturated
and unsaturated phospho C20
-C25
extended (Ext) OH-ARs; (k) PE macrocyclic archaeol (MAR) and (l) MS2
and
MS3
of a novel archaeal glycophospholipid. The m/z value in parentheses represents the base peak after loss
of water. The reader is referred to the main text for detailed interpretation of mass spectra.](https://image.slidesharecdn.com/54c05e1e-ddfa-426e-bc0d-230967ccb1b0-160817130319/75/PhD-thesis_Matthias-Kellermann-106-2048.jpg)
![Page | 87
Fragmentation patterns of archaeal IPLs
Kellermann (2012)
CHAPTER4
+H543 (525)
247
RelativeAbundance
(e)
PG-diOH-AR
[M H] = 839.7
525.4 543.4
247.1
O O
O
P
O
O
OH
OH
HO
OH OH
335
RelativeAbundance
(g)
PI-Uns-OH-AR
[M H] = 907.7
335.1
631.4
O O
O
P
O
O
OH
OHHO
HO
HO OH
OH
631 +H
651
373
813
RelativeAbundance
(f)
2Gly-Uns-AR
[M NH4
] = 992.8
373.4
535.4 651.7
813.4
O O
OO
OHHO
HO
O
O
OHHO
HO
HO +NH4
RelativeAbundance
(h)
PS-diUns-AR
[M H] = 810.6
534.3
260.1
242.1
O
O
O
P
O
O
OH
NH2
HO
O
534
260 (242)
534
+H
200100 300 400 500 600 700
m/z
800 900 1000 12001100
Fig. IV.2. (Continued)](https://image.slidesharecdn.com/54c05e1e-ddfa-426e-bc0d-230967ccb1b0-160817130319/75/PhD-thesis_Matthias-Kellermann-107-2048.jpg)
![Page | 88
Fragmentation patterns of archaeal IPLs
Kellermann (2012)
CHAPTER4
RelativeAbundance
(k)
PE-MAR(2)
[M H] = 770.6
727.6
629.6
553.6
P
O
O
OH
H2N
O
O
O
727 629
+H
540 (522)
836 (818)
RelativeAbundance
(l)
Gly-PS-OH-AR
[M H] = 998.7
836.7 ms2
ms3
818.7
540.4
540.4
522.4
(m/z = 836.7)
O
O
O
P
O
O
OH
NH2
O
O
OH
O
OHHO
HO
HO
+H
RelativeAbundance
(i)
PS-Ext-OH-AR
[M H] = 906.8
610.4
260.1
592.4
O
O
O
P
O
O
OH
NH2
HO
O
OH
610 (592)
+H
RelativeAbundance
(j)
PI-Ext-Uns(5)-OH-AR
[M H] = 971.7
631.4
613.4335.1
O O
O
P
O
O
OH
OHHO
HO
HO OH
OH
335
631 (613)
+H
200100 300 400 500 600 700
m/z
800 900 1000 12001100
Fig. IV.2. (Continued)](https://image.slidesharecdn.com/54c05e1e-ddfa-426e-bc0d-230967ccb1b0-160817130319/75/PhD-thesis_Matthias-Kellermann-108-2048.jpg)
![Page | 91
Fragmentation patterns of archaeal IPLs
Kellermann (2012)
CHAPTER4
RelativeAbundance 743.7
(a)
4Gly-GDGT
[M NH4
] = 1965.5
1300.3
4 O
O
O
OH
O
HO
HO OH
OH
O
O
1300
743 +NH4
RelativeAbundance
(b)
PG-GDGT
[M H] = 1454.3
1300.3
1380.3
1282.3
O
O
O
O
O
OH
P
O
OH
O
HO
OH
897.7
1300 (1282)
1380
+H
O
O
O
O
O
O
P
O
O
OH
NH2
P
O
OH
O
HO
OH
RelativeAbundance
(d)
PG-GDGT-PE
[M H] = 1577.3
1423.3
1380.3
1423
1380
+H
RelativeAbundance
(c)
2Gly-GDGT-PME
[M NH4
] = 1761.4
1437.3
823.7
2 O
O
O
O
O
HO OH
O
O
O
P
O
O
OH
NH
H
HO 823
897
1437
+NH4
400 600 800 1000 1200 1400 1600 1800 2000
m/z
Fig. IV.3. Positive mode MS2
spectra of intact polar GDGTs with one headgroup (a, b) and two mixed
headgroups (c, d). Numbers inside the hexoses in (a) and (c) represent the number of sugar headgroups of the
IPLs.The m/z value in parentheses represents loss of water from the base peak ion.The reader is referred to the
main text for detailed interpretation of mass spectra.
IV.4.7. Negative ionization mode
In negative ionization mode, the major fragments of Phos-ARs are commonly formed by
theheadgroup(e.g.,majorfragmentionatm/z241.1forPI-AR(Jahnetal.,2004)).However,minor
fragment ions from OH-AR, Uns-AR and Ext-OH-AR are not regularly related to the cleavage of
the isoprenoidal chains from the molecular ion (data not shown). Thus, important information
about the isoprenoidal chains, such as whether the compound possesses a combination of
unsaturated, hydroxylated or saturated alkyl substituents, cannot be directly obtained. In case
of unknown compounds, the complementary information provided by the negative ion mode
can, however, be useful. For instance, headgroups can be differentiated based on types of
adduct formation (Sturt et al., 2004).](https://image.slidesharecdn.com/54c05e1e-ddfa-426e-bc0d-230967ccb1b0-160817130319/75/PhD-thesis_Matthias-Kellermann-111-2048.jpg)
![Page | 92
Fragmentation patterns of archaeal IPLs
Kellermann (2012)
CHAPTER4
IV.5. Discussion
Systematic order in fragmentation of archaeal IPLs during MS/MS experiments as a
function of headgroups and isoprenoidal substituents
During MS2
experiments, sugar headgroups are preferentially cleaved, regardless of the
complexity of the archaeal core lipid (i.e. diether, tetraether, hydroxylated, unsaturated or
saturated, Fig. IV.4). This fragmentation pattern is likely related to the stability of the neutral
fragmentobtained,buttheexactmechanismisnotexaminedinthisstudy.Thecompound2Gly-
Uns-AR containing both a phytanyl and a phytenyl substituent is often observed in methane
seep sediments (Rossel et al., 2011) and exemplifies this systematic fragmentation (Fig. IV.2f).
The base peak at m/z 373.4 in the MS2
spectrum results from the cleavage of sugar headgroups
and the loss of a phytenyl chain (278.3 Da loss). Minor fragment ions at m/z 813.7 ([M NH4
] –
Gly), 651.7 ([M NH4
] – 2Gly) and 535.4 (m/z 813.7 – 278.3 Da loss) demonstrate successive losses
of sugar headgroups and an unsaturated isoprenoidal chain (Fig. IV.2f). Gly-based GDGTs with
single or mixed phospho and glycosylated headgroups show invariably sugar loss(es) during
fragmentation in MS2
experiments, independent of the number of cyclopentane rings in the
core GDGT and/or the associated type of phospho headgroup (Fig. IV.4).
Because isoprenoidal substituents are structurally more diverse in phospho than
in glycosylated ARs, fragmentation patterns during MS2
experiments are more complex. In
phospho-DGDs, the preferential order of fragmentation is unsaturated C20
and C25
isoprenoidal
substituents followed by other IPL components. The PI-Uns(2)-OH-AR and the PI-Uns(5)-Ext-
OH-AR contain phytadienyl and sesterterpapentenyl chains, respectively, combined with an
OH-phytanyl (Fig. IV.2g and Fig. IV.2j, respectively). These IPLs show the preferential loss of
unsaturated over hydroxylated alkyl chains (Fig. IV.4). In turn, cleavage of OH-phytanyl in MS2
experiments is favored over saturated alkyl substituents (phytanyl and sesterterpanyl) and
phosphoester-linked polar headgroups (i.e. glycerol, ethanolamine, serine, etc.) (Fig. IV.2d
andFig. IV.2i).The major base peak in MS2
spectra of saturated Phos-ARs corresponds to a PA-AR
and indicates that the phosphoester-linked polar headgroups are cleaved preferentially over
the saturated phytanyl chains (Fig. IV.2b).
In this study, the PG-GDGT-PE and PG-GDGT-PGP (PGP = phosphatidylglycerol
phosphate) were the only GDGTs with two different phospho headgroups (Table IV.1). The
former compound exhibits a preferential loss of PG over PE, ensuing PE-GDGT as the major
fragment ion in the MS2
spectrum (Fig. IV.2d). It is thus reasonable to infer that fragmentation of
GDGTs with two distinct headgroups also follows a systematic order of neutral losses: hexoses
followed by PG, which is preferentially lost over PE in MS2
experiments (Fig. IV.4). Interestingly,
losses observed in intact MARs are related to the headgroup, and these IPLs appear as the most
stable core lipids during MS2 fragmentation (Fig. IV.2k).
Having established the systematic patterns of fragmentation of archaeal IPLs under MS/
MS conditions, in the following we describe a novel glycophospholipid AR that exemplifies the](https://image.slidesharecdn.com/54c05e1e-ddfa-426e-bc0d-230967ccb1b0-160817130319/75/PhD-thesis_Matthias-Kellermann-112-2048.jpg)
![Page | 93
Fragmentation patterns of archaeal IPLs
Kellermann (2012)
CHAPTER4
benefits of the knowledge of fragmentation patterns established in this study.The putative Gly-
PS-OH-AR is a minor archaeal IPL in seep sediments (Fig. IV.2l, this study). Its protonated mass at
m/z 998.7 yields a base peak at m/z 836.7 and a related peak at m/z 818.7 in MS2
, corresponding
to the loss of a hexose ([M H] –162.1 Da) and a further loss of water from the major fragment
ion in MS2
. Minor fragment ions (better visualized in MS3
) at m/z 540.4 and 522.4 are related to
a subsequent 296.3 Da loss (OH-phytanyl chain) from m/z 836.7, mirroring the fragmentation
observed in PS-OH-AR (Table IV.1).The characteristics observed above are in line with the order
of reactions during MS2
experiments (Fig. IV.4), in which first hexoses are lost, followed by the
OH-phytanyl chain.
Kinetic order of fragmentation during MS2
of archaeal IPLs
Diethers GDGTs
OH
OH
O
HO
HO OH
HO
OH
O
HO
HO OH
HO
O
P
OH
OH
O
Polar
Headgroup
HO
O
O
O
P
O
H2
N
OH
OH
O
P
O
HO
OH
OH
OH
preferentialneutrallosses
preferentialneutrallosses
1.
2.
3.
4.
1.
2.
3.
4.
5.
Fig. IV.4. Simplified overview of fragmentation patterns of archaeal di- and tetraether IPLs during HPLC/ESI-
ITMSn
.
IV.6. Final considerations
Previous publications using HPLC/ESI-ITMSn
focused on ecological microbial processes
rather than compound elucidation. The present study is a detailed examination of 48 mass
spectra of archaeal IPLs from several samples of natural environments (Table IV.1, Fig. IV.2 and
Fig. IV.3, and Appendices, see Supporting Information), in which not only the fragmentation
patterns of Gly- and Phos-based intact archaeal lipids were depicted, but also novel compounds
weretentativelyidentified.ThelowconcentrationsofarchaealIPLsoftenfoundinenvironmental
samples prevent the analysis of individual compounds by NMR, which is mandatory for strict
structural identification. Improved characterization of previously unknown archaeal IPLs was
facilitated by preparative HPLC, which attenuates the influence of the complex organic matrices
from natural environments in MSn
experiments. Given the central importance of archaeal
membrane lipids in ecological and evolutionary research, this report will be a useful guide for
the mass spectral identification of IPLs in both natural environmental samples and microbial
cultures.](https://image.slidesharecdn.com/54c05e1e-ddfa-426e-bc0d-230967ccb1b0-160817130319/75/PhD-thesis_Matthias-Kellermann-113-2048.jpg)
![Page | 95
Fragmentation patterns of archaeal IPLs
Kellermann (2012)
CHAPTER4
RelativeAbundance
PA-OH-AR
[M + H]+
= 749
453
RelativeAbundance
PA-AR
[M + H]+
= 733
453
357
+H453
+H
+H
+H
453
357
733
653
527
RelativeAbundance
PG-AR
[M + H]+
= 807
733
653
527
373
O O
O
P
HO
O
OH
O O
O
P
HO
O
OH
OH
O O
O
P
O
O
OH
HO
OH
527
RelativeAbundance
PG-OH-AR
[M + H]+
= 823
527
O O
O
P
O
O
OH
OH
HO
OH
RelativeAbundance
PG-Uns(1)-Ext-OH-AR
[M + H]+
= 891
595
543
525
247
+H
O O
O
P
O
O
OH
OH
HO
OH
247
595
543 (525)
200100 300 400 500 600 700
m/z
800 900 1000 12001100](https://image.slidesharecdn.com/54c05e1e-ddfa-426e-bc0d-230967ccb1b0-160817130319/75/PhD-thesis_Matthias-Kellermann-115-2048.jpg)
![Page | 96
Fragmentation patterns of archaeal IPLs
Kellermann (2012)
CHAPTER4
RelativeAbundance
PG-diUns-OH-AR
[M + H]+
= 817
523
541
247
O O
O
P
O
O
OH
OH
HO
OH
+H
247
541 (523)
540 (522)
RelativeAbundance
PS-AR
[M + H]+
= 820
733
357 453
O
O
O
P
O
O
OH
NH2
HO
O
RelativeAbundance
PS-OH-AR
[M + H]+
= 836
540
522
453435
O
O
O
P
O
O
OH
NH2
HO
O
OH
733
453
453 (435)
200100 300 400 500 600 700
m/z
800 900 1000 12001100
+H
+H
+H
+H
510
RelativeAbundance
PME-AR
[M + H]+
= 790
733
453357
O O
O
P
O
O
OH
HN
733
453
RelativeAbundance
PME-OH-AR
[M + H]+
= 806
510
453
OH
O O
O
P
O
O
OH
HN
453](https://image.slidesharecdn.com/54c05e1e-ddfa-426e-bc0d-230967ccb1b0-160817130319/75/PhD-thesis_Matthias-Kellermann-116-2048.jpg)
![Page | 97
Fragmentation patterns of archaeal IPLs
Kellermann (2012)
CHAPTER4
PS-diOH-AR
[M + H]+
= 852
538
556260
242
RelativeAbundance
O
O
O
P
O
O
OH
NH2
HO
O
OH
OH
RelativeAbundance
PS-Uns-OH-AR
[M + H]+
= 832
556
538
260
O
O
O
P
O
O
OH
NH2
HO
O
OH
RelativeAbundance
PS-Uns(1)-diOH-AR
[M + H]+
= 850
242
260
536
554
O
O
O
P
O
O
OH
NH2
HO
O
OH
OH
RelativeAbundance
PS-Uns-AR
[M + H]+
= 816
540
260
O
O
O
P
O
O
OH
NH2
HO
O
556 (538)
260 (242)
540
260
554 (536)
260 (242)
556 (538)
556 (538)
260
615
RelativeAbundance
PI-AR
[M + H]+
= 895
733
615
653
O O
O
P
O
O
OH
OHHO
HO
HO OH
733
653
200100 300 400 500 600 700
m/z
800 900 1000 12001100
+H
+H
+H
+H
+H](https://image.slidesharecdn.com/54c05e1e-ddfa-426e-bc0d-230967ccb1b0-160817130319/75/PhD-thesis_Matthias-Kellermann-117-2048.jpg)
![Page | 98
Fragmentation patterns of archaeal IPLs
Kellermann (2012)
CHAPTER4
335
335
RelativeAbundance
PI-Ext-OH-AR
[M + H]+
= 981
261 505
685
O O
O
P
O
O
OH
OHHO
HO
HO OH
OH
RelativeAbundance
PI-OH-AR
[M + H]+
= 911
615
261
RelativeAbundance
PI-Ext-Uns(1)-OH-AR
[M + H]+
= 979
335
631
613
683
O O
O
P
O
O
OH
OHHO
HO
HO OH
OH
O O
O
P
O
O
OH
OHHO
HO
HO OH
OH
615
RelativeAbundance
PI-diOH-AR
[M + H]+ = 927
335
261
613
631
O O
O
P
O
O
OH
OHHO
HO
HO OH
OH
OH
631 (613)
631 (613)
683
685
631 (613)
RelativeAbundance
200100 300 400 500 600 700
m/z
800 900 1000 12001100
PI-Ext-Uns-diOH-AR
[M + H]+
= 989
631
613
335
O O
O
P
O
O
OH
OHHO
HO
HO OH
OH
OH
335
631 (613)
+H
+H
+H
+H
+H](https://image.slidesharecdn.com/54c05e1e-ddfa-426e-bc0d-230967ccb1b0-160817130319/75/PhD-thesis_Matthias-Kellermann-118-2048.jpg)
![Page | 99
Fragmentation patterns of archaeal IPLs
Kellermann (2012)
CHAPTER4
373
RelativeAbundance
Gly-AR
[M + NH4
]+
= 832
653
O O
OO
OHHO
HO
HO
653
373
653
651
373
813
992
RelativeAbundance
3Gly-AR
[M + NH4
]+
= 1156
653
O O
OO
OHHO
HO
O
O
OHHO
HO
O
O
OHHO
HO
HO
RelativeAbundance
3Gly-Uns-AR
[M + NH4
]+
= 1154
651 992
813
373
O O
OO
OHHO
HO
O
O
OHHO
HO
O
O
OHHO
HO
HO
200100 300 400 500 600 700
m/z
800 900 1000 12001100
+NH4
+NH4
+NH4](https://image.slidesharecdn.com/54c05e1e-ddfa-426e-bc0d-230967ccb1b0-160817130319/75/PhD-thesis_Matthias-Kellermann-119-2048.jpg)
![Page | 100
Fragmentation patterns of archaeal IPLs
Kellermann (2012)
CHAPTER4
RelativeAbundance
1Gly-GDGT
[M + NH4
]+
= 1476
1298
743
RelativeAbundance
2Gly-GDGT
[M + NH4
]+
= 1641
1300
2
3
743
RelativeAbundance
3Gly-GDGT
[M + NH4
]+
= 1802
1298
O
O
O
O
O
O
HO
HO OH
HO
OH
O
O
O
O
O
O
HO
HO OH
HO
OH
O
O
O
OH
O
HO
HO OH
OH
O
O
1298
743
1300
743
1298
+NH4
+NH4
+NH4
m/z
400 600 800 1000 1200 1400 1600 1800 2000
400 600 800 1000 1200 1400 1600 1800 2000
400 600 800 1000 1200 1400 1600 1800 2000](https://image.slidesharecdn.com/54c05e1e-ddfa-426e-bc0d-230967ccb1b0-160817130319/75/PhD-thesis_Matthias-Kellermann-120-2048.jpg)
![Page | 101
Fragmentation patterns of archaeal IPLs
Kellermann (2012)
CHAPTER4
RelativeAbundance
2Gly-GDGT-dGly
[M + NH4
]+
= 1786 1444
1298
2
O
O CH3
O
O
O
O
HO
HO OH
HO
O
HO
HOOH
O
O
O
O
O
O
HO
HO OH
HO
O
P
O
OH
O
OH
OH
m/z
400 600 800 1000 1200 1400 1600 1800 2000
RelativeAbundance
2Gly-GDGT-PG
[M + NH4
]+
= 1793
1452
897
803
O
O
O
O
O
O
HO
HO OH
HO
O
P
O
OH
O
OH
OH
RelativeAbundance
Gly-GDGT-PG
[M + NH4
]+
= 1632
1452
897
2
1444
1452
1298
897
1452
897
+NH4
+NH4
+NH4
400 600 800 1000 1200 1400 1600 1800 2000
400 600 800 1000 1200 1400 1600 1800 2000](https://image.slidesharecdn.com/54c05e1e-ddfa-426e-bc0d-230967ccb1b0-160817130319/75/PhD-thesis_Matthias-Kellermann-121-2048.jpg)
![Page | 102
Fragmentation patterns of archaeal IPLs
Kellermann (2012)
CHAPTER4
400 600 800 1000 1200 1400 1600 1800 2000
m/z
400 600 800 1000 1200 1400 1600 1800 2000
RelativeAbundance
PG-GDGT-PG
[M + H]+
= 1606
1452
1378
1434
O
O
O
O
O
P
O
OH
O
OH
OH
O
P
O
OH
O
HO
OH
O
O
O
O
O
P
O
OH
O
OH
OH
O
P
O
OH
O
O
O
P
HO
OH
O
400 600 800 1000 1200 1400 1600 1800 2000
RelativeAbundance
PG-GDGT-PGP
[M + H]+
= 1686
1452
1298
897
803
ms2
ms3
(m/z = 1452)
2
RelativeAbundance
2Gly-GDGT-PE
[M + NH4
]+
= 1747
1423
1380
O
O
O
O
O
HO OH
O
O
O
P
O
O
OH
NH2
H
HO
1452
1452(1434)
1378
1298, 897
1423
1380
+NH4
+NH4
+H](https://image.slidesharecdn.com/54c05e1e-ddfa-426e-bc0d-230967ccb1b0-160817130319/75/PhD-thesis_Matthias-Kellermann-122-2048.jpg)
![Page | 105
IPL-SIP / Tetraether biosynthesis
Kellermann (2012)
CHAPTER5
[Chapter V] - IPL-SIP / Tetraether biosynthesis
Stable isotope probing of an anaerobic methane–oxidizing enrichment
provides clues on archaeal tetraether lipid biosynthesis
Matthias Y. Kellermann a
*, Marcos Y. Yoshinagaa
, Gunter Wegenera,b
, Yu–Shih Lina
, Thomas
Hollerb
, Kai–Uwe Hinrichsa
For submission to:
Geochimica et Cosmochimica Acta
a
Organic Geochemistry Group, MARUM Center for Marine Environmental Sciences & Department of
Geosciences, University of Bremen, Leobener Strasse, D–28359 Bremen, Germany
b
Max Planck Institute for Marine Microbiology, Celsiusstr. 1, D–28359 Bremen, Germany
* Corresponding author.
Tel.: +49 421 218 65742; Fax: + 49 421 218 65715
E–mail address: kellermann.matthias@gmail.com
Keywords:
13
C assimilation | Archaea | diether | tetraether | ANME–1 enrichment | IPL-SIP | de novo lipid
biosynthesis | tetraether biosynthesis | 2Gly–GDGTs](https://image.slidesharecdn.com/54c05e1e-ddfa-426e-bc0d-230967ccb1b0-160817130319/75/PhD-thesis_Matthias-Kellermann-125-2048.jpg)
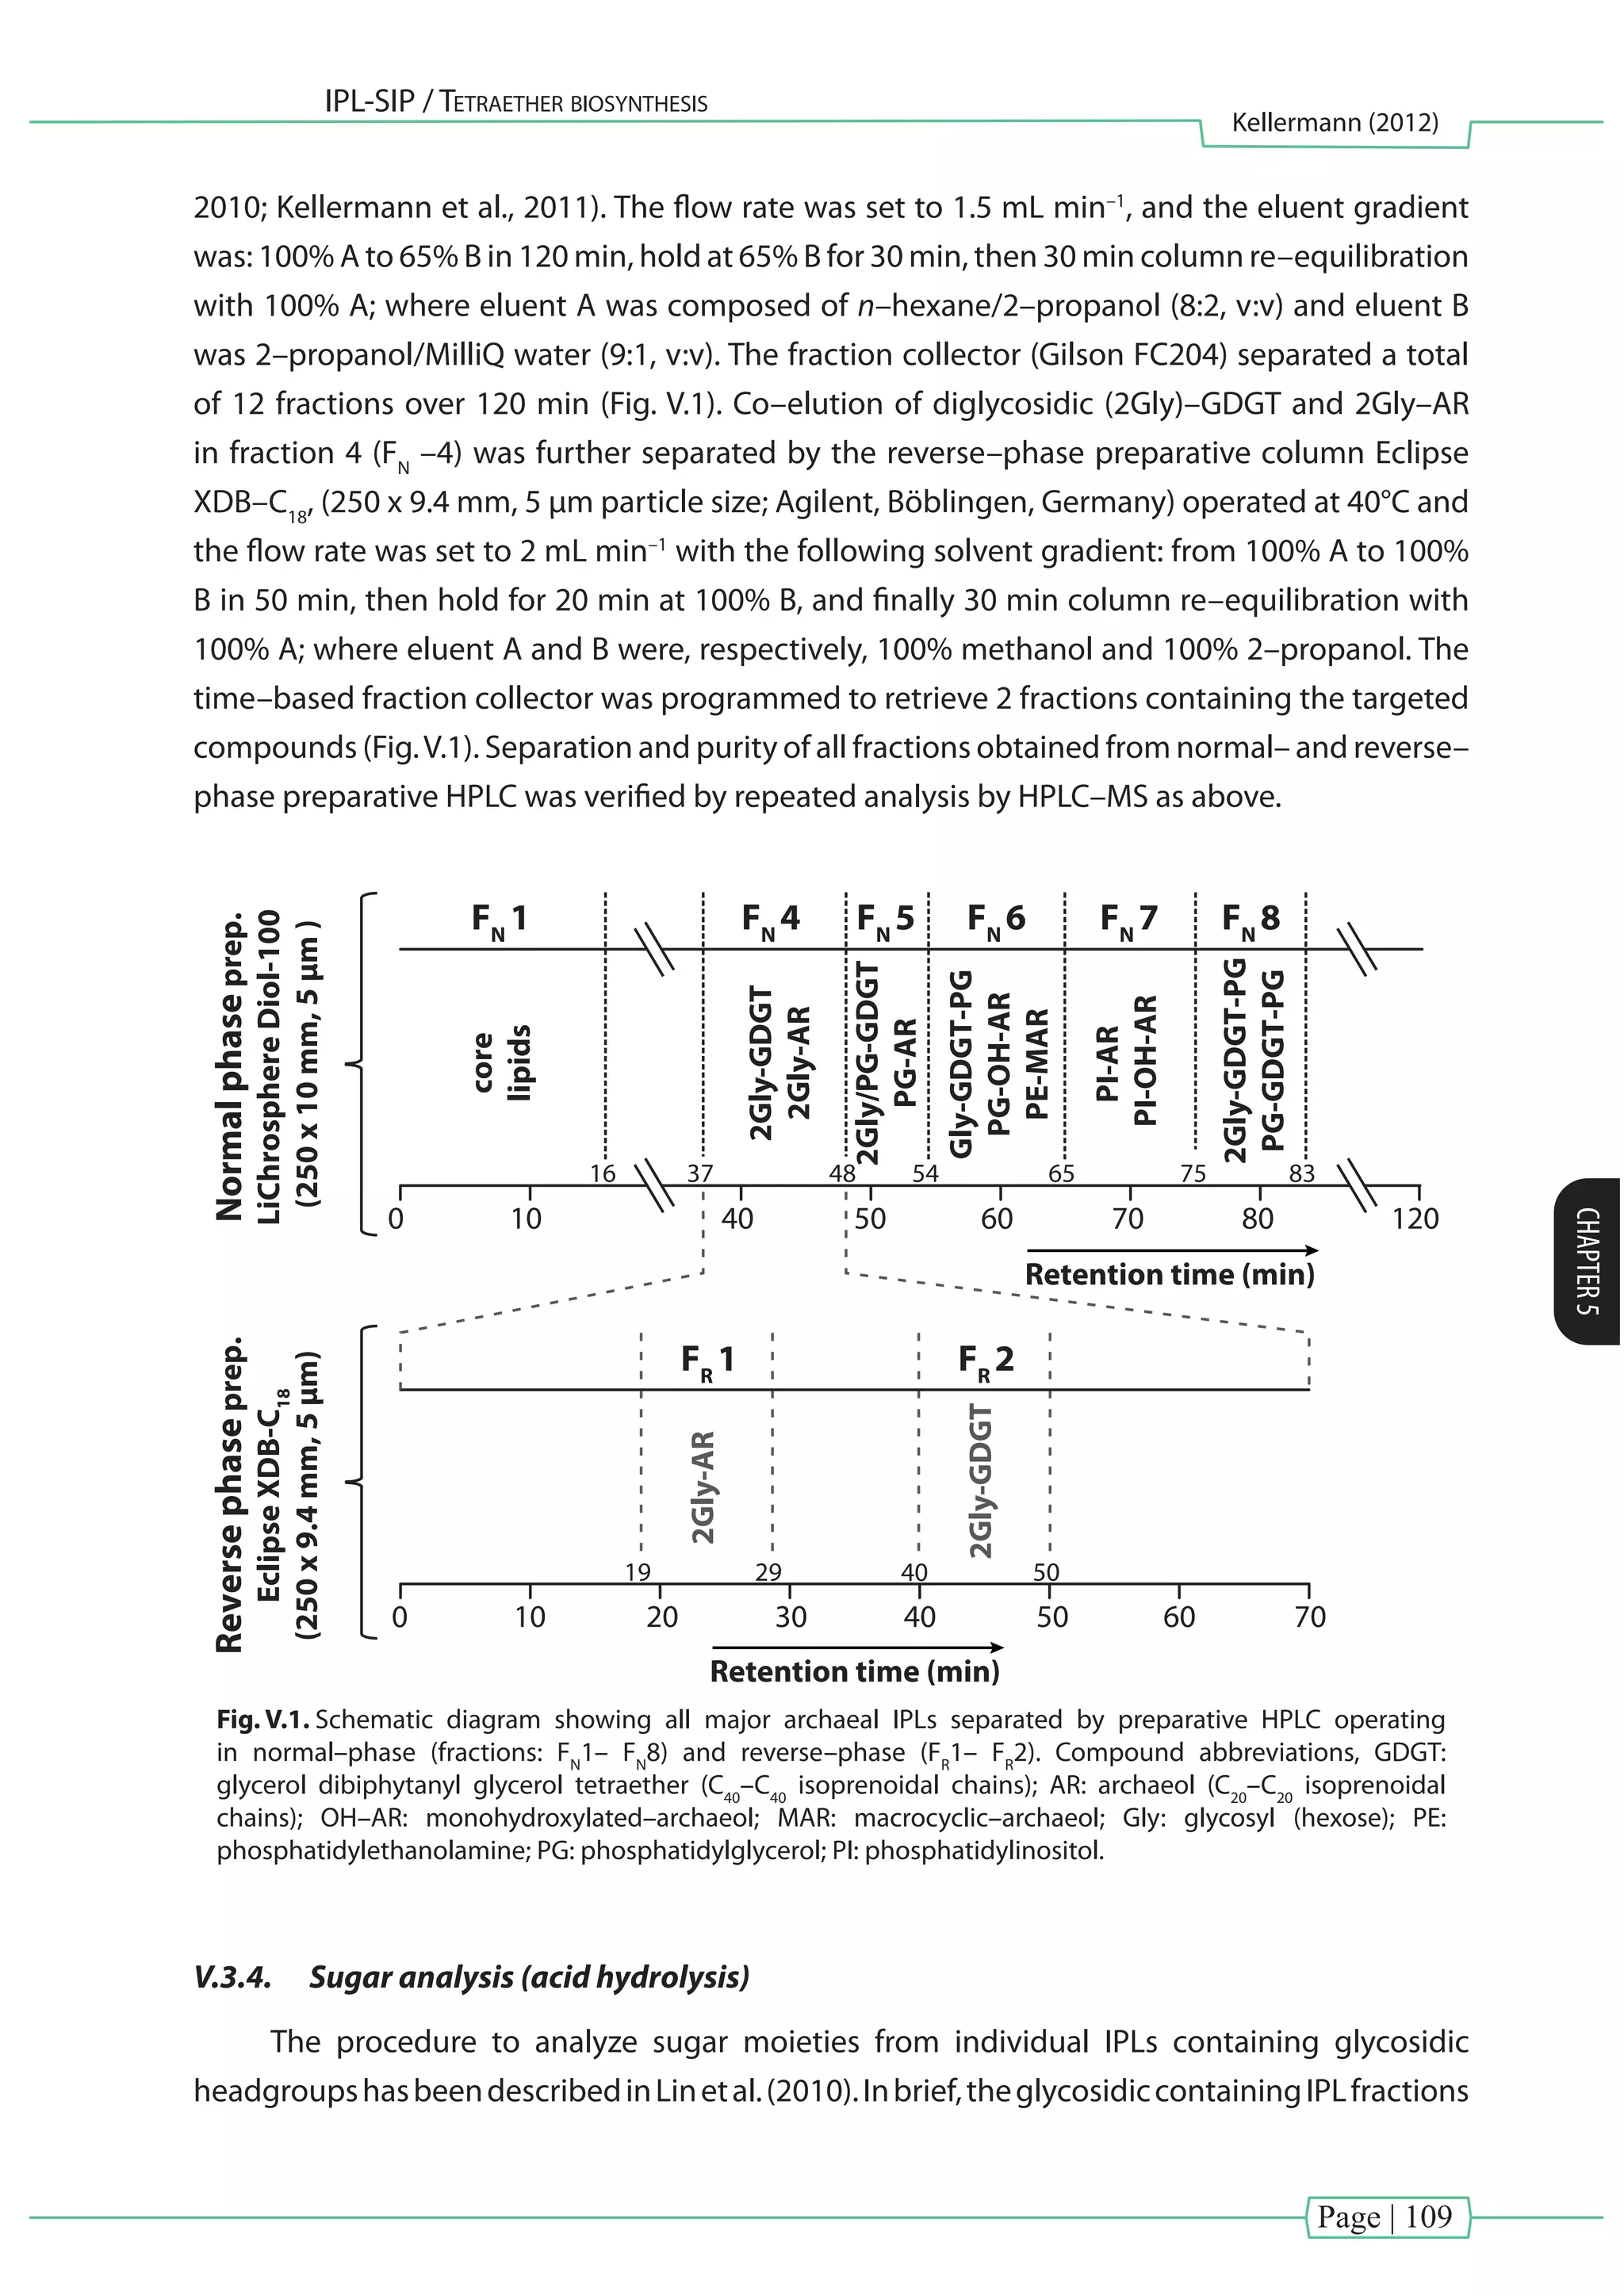
![Page | 112
IPL-SIP / Tetraether biosynthesis
Kellermann (2012)
CHAPTER5
whereas intact GDGTs contributed only 2.3±0.1% relative to the total GDGT pool (Fig. V.2a).
Phy
[21.2±2.3%]
Intact ARs
[1.2±0.1%]
Intact
GDGTs
[1.8±0.1%]
BP (0)
[31.7±5.6%]
BP (1)
[11.4±2.3%]
BP (2)
[21.8±3.6%]
BP (3)
[10.9±1.3%]
(a) (b) Archaeols GDGTs
+500
+1000
+1500
+2000
+2500
+3000
0
IPLsIPLs
TLE
+200
+150
+100
+50
+250
+300
+350
+400
+450
TLE
0
+10
+15
+5
BP(0)
BP(1)
Total
ARs
IntactARs
BP(0)
BP(1)
BP(2)
CoreG
DGTs
Core
ARs
[75.8±3.
2%
]
øΔδ13
C[‰]
Fig. V.2. (a) Relative archaeal lipid composition: core and intact di– and tetraether lipids determined after
ether cleavage, as phytane (derived from diether lipids or ARs) and biphytanes (from tetraether lipids or
GDGTs) relative to an injection standard (squalane) by GC–FID. (b) Total 13
C–bicarbonate uptake, t(24) relative
to t(0) [Δδ13
C], in bulk (TLE) versus IPL derived phytanes and biphytanes. Intact polar di– and tetraether lipids
are displayed as weighted average alteration (ØΔ), taking into account the concentrations and δ13
C values of
IPLs. Compound abbreviations, BP: biphytane; (0 to 3): cyclic rings; Phy: phytane.
The 13
C assimilation into intact ARs was more than 5 times greater compared to the total
ARs pool, while the intact GDGT indicated an even stronger increase of >35 times relative to
total GDGTs (Fig. V.2b). We were able to demonstrate that the 13
C–uptake was highest in intact
acyclic followed by mono– and bicyclic biphytanes, a fact underscored by TLE based analysis
(Fig.V.2c;TableV.1; cf. Blumenberg et al., 2005). In addition, the apolar fraction of the preparative
HPLC (i.e. total fossil pool, FN
1; Fig. V.1) showed a total alteration of 10 and 2‰ in 13
C uptake for
phytane (phy) and acyclic biphytane, respectively (Table V.1). This result likely reflects turnover
of recently produced IPLs. Taken together, our results clearly show an increase in SIP sensitivity
by focusing on the intact archaeal lipid pool, and thus demonstrate that the label uptake of
archaeal communities was largely underestimated by previous TLE–SIP in in vitro AOM studies
(e.g. Blumenberg et al., 2005, Wegener et al., 2008, Kellermann et al., in preparation).](https://image.slidesharecdn.com/54c05e1e-ddfa-426e-bc0d-230967ccb1b0-160817130319/75/PhD-thesis_Matthias-Kellermann-132-2048.jpg)
![Page | 113
IPL-SIP / Tetraether biosynthesis
Kellermann (2012)
CHAPTER5
Table V.1. Absolute concentrations, stable carbon isotopic composition (δ13
C) and 13
C–incorporation of
archaeal bulk (TLE), apolar (FN
–1) and intact di– and tetraether lipid fractions. All lipids were quantified, after
ether cleavage, as phytane (derived from diether lipids or ARs) and biphytanes (from tetraether lipids or
GDGTs) relative to an injection standard (squalane) by GC–FID. Averaged lipid concentrations and standard
deviations for all incubation periods (t= 0 to 24 days) are provided. δ13
C is given for t(0) and total label uptake
relative to t(0) [Δδ13
C] are expressed for days of incubations t(10), t(17) and t(24). All isotopic values are given
in per mil (‰). For compound abbreviations the reader is referred to Fig. V.1 and Fig. V.2.
Page | 26
Absolute concentrations and [δ13
C or Δδ13
C]
(ng isoprenoids gdm
–1
) and [‰]
t(0)
conc. / [δ13
C]
t(10)
conc. / [Δδ13
C]
t(17)
conc. / [Δδ13
C]
t(24)
conc. / [Δδ13
C]
averaged
(ng gdm
–1
)
–TLE–
Phy 6800 [–42] 6500 [+420] 8200 [+454] 7800 [+530] 7300±700
BP(0) 10000 [–27] 9300 [+4] 12000 [+13] 11000 [+12] 11000±1100
BP(1) 3800 [–42] 3300 [±0] 4500 [+5] 4100 [+15] 3900±440
BP(2) 7200 [–41] 5800 [±0] 8400 [±0] 7700 [+2] 7300±940
BP(3) 3500 [–18] 3000 [±0] 4100 [±0] 3700 [±0] 3600±410
–Apolar fraction (FN–1)–
Phy 6000 [–35] 6900 [+5] 6700 [+7] 6600 [+10] 6500±320
BP(0) 7200 [–26] 8000 [±0] 7400 [+1] 7600 [+2] 7500±300
BP(1) 2500 [–43] 2800 [±0] 2700 [±0] 2900 [±0] 2700±130
BP(2) 5100 [–39] 5700 [±0] 5500 [±0] 5600 [±0] 5500±220
BP(3) 2900 [–19] 3200 [±0] 3000 [±0] 3100 [±0] 3100±100
–Intact ARs [Phy]–
2Gly–AR (FR–1) 100 [–78] 120 [+390] 70 [+780] 130 [+880] 100±21
PG–AR (FN–5) 88 [–71] 310 [+4300] 110 [+4600] 260 [+5200] 190±94
PG–OH–AR (FN–6) 87 [–61] 85 [+450] 90 [+700] n.a. [+1100*] 87±2
PI–OH–AR (FN–7) 37 [–64] 17 [+240] 29 [+630] n.a. [+480] 28±8
PE–MAR (FN–6) n.a. n.a. n.a. n.a. [+1100*] n.a.
–Intact GDGTs [BP]–
SUM–2Gly–GDGT (FR–2) 340 [–65] 440 [+1] 270 [±0] 370 [+16] 350±63
BP(0) 89 [–56] 110 [+1] 67 [+1] 110 [+32] 93±17
BP(1) 120 [–66] 150 [+4] 92 [±0] 120 [+8] 120±20
BP(2) 130 [–69] 180 [±0] 110 [±0] 150 [+12] 140±27
SUM–PG(2Gly)–GDGT (FN–5) 110 [–60] 140 [+77] 63 [+150] 95 [+230] 100±28
BP(0) 35 [–52] 43 [+130] 27 [+190] 39 [+330] 36±6
BP(1) 29 [–60] 36 [+91] 19 [+210] 25 [+230] 27±6
BP(2) 43 [–67] 63 [+23] 17 [+63] 31 [+130] 39±17
SUM–Gly–GDGT–PG (FN–6) 90 [–57] 67 [+59] 94 [+140] n.a. 84±12
BP(0) 41 [–49] 33 [+86] 35 [+160] n.a. 36±3
BP(1) 16 [–62] 11 [+67] 15 [+210] n.a. 14±2
BP(2) 33 [–64] 23 [+25] 43 [+87] n.a. 33±8
SUM–PG(2Gly)–GDGT–PG (FN–8) 98 [–65] 70 [+380] 94 [+930] n.a. [+730] 87±12
BP(0) 39 [–60] 32 [+710] 42 [+1500] n.a. [+920] 38±4
BP(1) 29 [–66] 19 [+270] 27 [+890] n.a. [+940] 25±4
BP(2) 30 [–70] 19 [+47] 25 [+200] n.a. [+260] 24±5
(*) δ13
C values of PG–OH–AR and PE–MAR at t(24) analyzed as core lipid OH–AR and MAR as TMS derivate,
respectively, after saponification (e.g., Elvert et al., 2003).
n.a. not analyzed.](https://image.slidesharecdn.com/54c05e1e-ddfa-426e-bc0d-230967ccb1b0-160817130319/75/PhD-thesis_Matthias-Kellermann-133-2048.jpg)
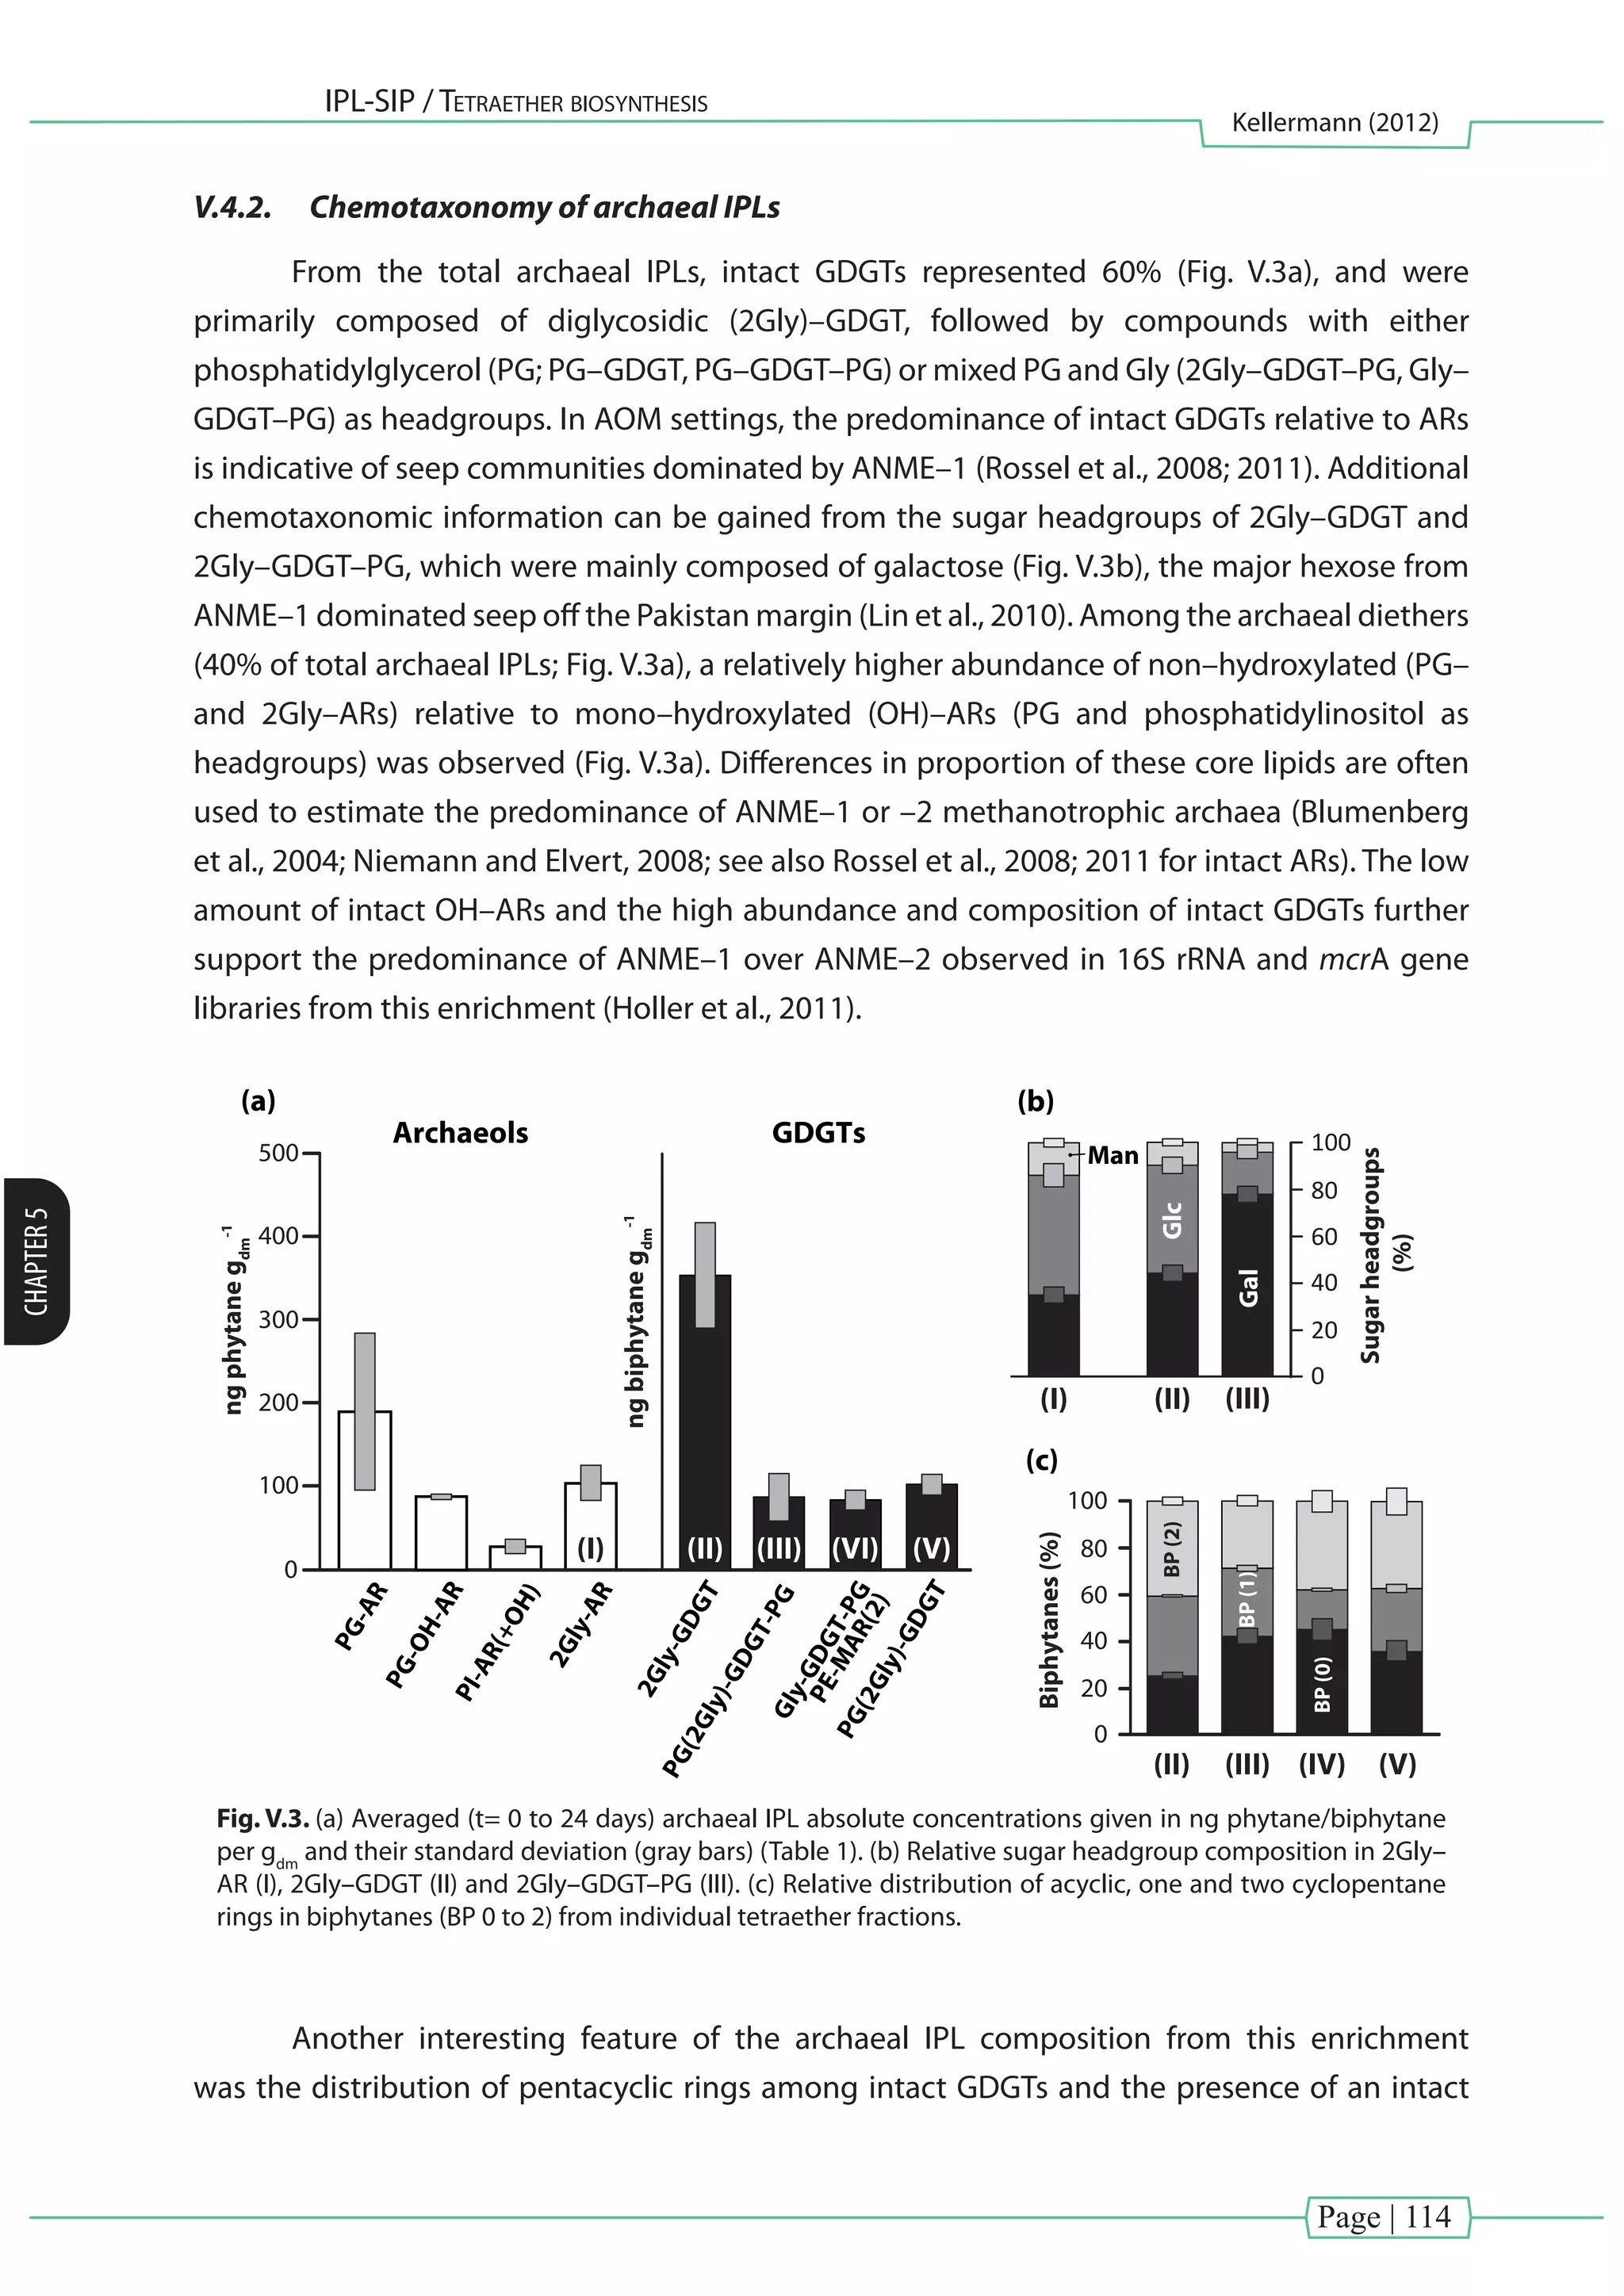
![Page | 116
IPL-SIP / Tetraether biosynthesis
Kellermann (2012)
CHAPTER5
PG(2Gly)-GDGT-PG[FN
-8]2Gly-GDGT[FR
-2]
0
δ13
C(‰)
-40
-80
t(0)t(10)t(17)t(24)
+800
+1000
+3000
+5000
+600
+400
+200
PG-AR[FN
-5]
Glycerol
Glycerol
Phy
BP(0)
BP(1)
BP(0)
BP(2)
PhyPhy
2Gly-AR[FR
-1]
Glc
Gal
Glc
0
δ13
C(‰)
Time(days)
-40
-80
+800
+1000
+3000
+5000
+600
+400
+200
Ino
PI-AR;PI-OH-AR[FN
-7]
Glycerol
Glycerol
Gal
Glc
Gal
otherIPLs
PE-MAR
(SAP)
PG-(OH)-AR
PG(2Gly)-
GDGT*
PG-GDGT-Gly*
PG-OH-AR
(SAP)
Fig.V.4.Inter–andintramolecularanalysisofintactdi–andtetraetherlipidsfor0,10,17and24daysofincubationwith13
C–
labeled–bicarbonate.δ13
C(‰)valuesareshownforhexoseheadgroups(Glc:glucose,Gal:galactose,Ino:myo–inositol),glycerol
backboneandtheisoprenoidalsidechains(Phy,BP0–2).PE–MARandPG–OH–ARatT(24)weremeasuredascorelipidafter
saponification(SAP).(*)displayedasaveragedweight–balancedalterationforbiphytanes.
Incubations with 13
C–labeled bicarbonate in the presence of methane led to variable
alteration of δ values in individual archaeal lipids (Fig. V.4). Although the incubation period
was almost 1/3 of the doubling time for the enrichment (Holler et al., 2011), the archaeal lipid
concentration has not been significantly altered throughout the incubation periods (Fig. V.3a;
Table 1). After 24 days of incubation, the 13
C assimilation into intact diether lipids (Fig. V.4; Table
V.1) was highest in PG–AR (+5200‰), followed by PG–OH–AR (+1100‰), 2Gly–AR (+880‰)
and the mixed fraction of PI–AR and PI–OH–AR (+480‰). PG–AR showed by far the highest 13
C
uptake, exhibiting an asymptotic curve over time, whereas a linear uptake of 13
C was observed](https://image.slidesharecdn.com/54c05e1e-ddfa-426e-bc0d-230967ccb1b0-160817130319/75/PhD-thesis_Matthias-Kellermann-136-2048.jpg)
![Page | 118
IPL-SIP / Tetraether biosynthesis
Kellermann (2012)
CHAPTER5
0200400600800
1000
2000
3000
4000
5000
PG-AR
PG(2Gly)-GDGT-PG
PG(2Gly)-GDGT
Gly-GDGT-PG
2Gly-GDGT
Δδ13
C(‰)
10
20
BP(0)
BP(1)
BP(2)
head-to-headcondensation
O
P
O
OHO
OH
OH
P
O
O
HO
HO
OH
O
O
O
O
O
O
P
O
OHO
OH
OH
O
O
O
HO
P
O
OHO
OH
OH
OH
End-product?
P
O
O
HO
HO
OH
O
O
O
O
O
P
O
O
HO
HO
OH
O
O
OH
O
HO
HO
HO
Precursor
O
OH
O
HO
HO
HO
OH
O
O
O
P
O
O
HO
HO
OH
O
O
O
HO
O
OO
O
OH
O
O
O
OH
HO
HO
HO
HO
HO
n
P
O
OHO
OH
OH
OH
Fig.V.5.Leftpanel:totallabeluptake[Δδ13
C]after24daysofincubationrelativetot(0)forPG–ARandintacttetraetherlipids.Notethatfor2Gly–GDGTadifferent
scalewasused.Rightpanel:ApossiblepathwayfortetraetherbiosynthesisinthermophilicANME–1revealedbystableisotopeprobingofarchaealintactpolarlipids
(modifiedfromNemotoetal.,2003).](https://image.slidesharecdn.com/54c05e1e-ddfa-426e-bc0d-230967ccb1b0-160817130319/75/PhD-thesis_Matthias-Kellermann-138-2048.jpg)
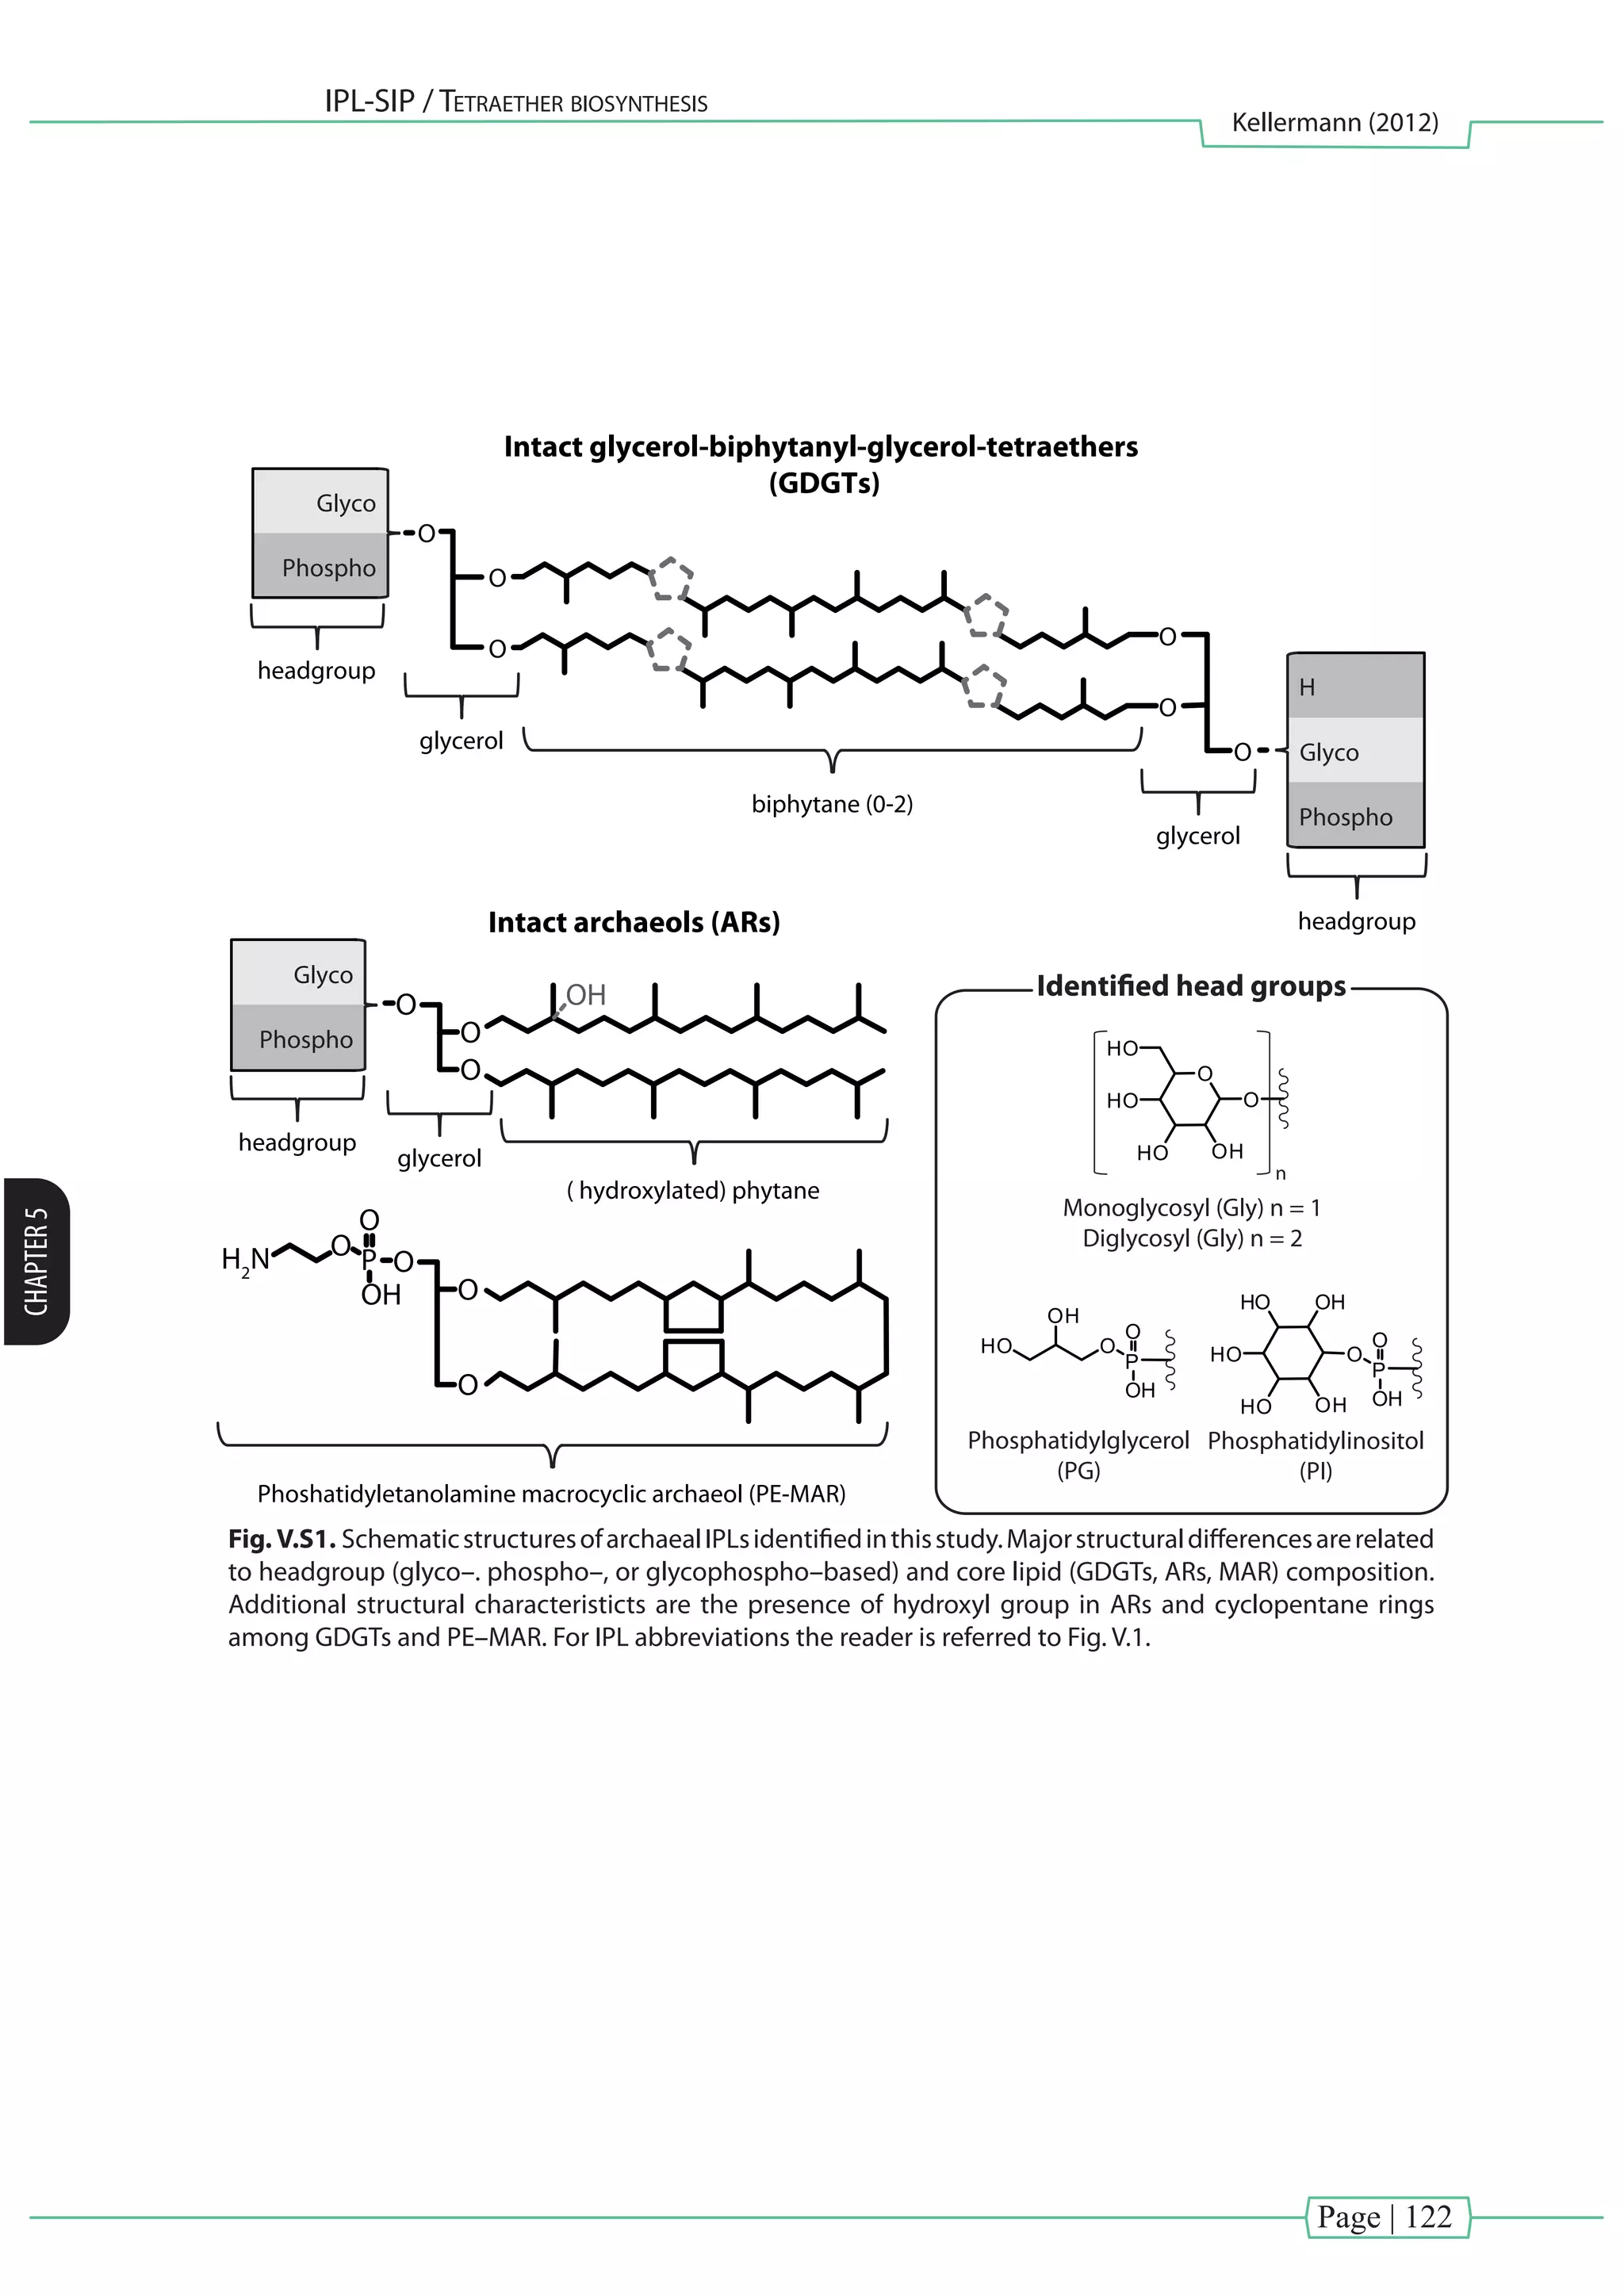
![Page | 123
IPL-SIP / Tetraether biosynthesis
Kellermann (2012)
CHAPTER5
Table V.S1. 13
C stable isotopic composition of hexose containing headgroups
and glycerol backbone of IPLs. All isotopic values are given in per mil (‰). For IPL
abbreviations the reader is referred to Fig. V.1 and Fig. V.3.Appendix Table 1:
t(0) t(1) t(2) t(3)
IPL fraction
δ13
C
[‰]
δ13
C
[‰]
δ13
C
[‰]
δ13
C
[‰]
Hexose containing headgroups
2Gly–AR [FR–1]
Glc –30 +23 +350
n.a.
Gal –26 +76 +270
2Gly–GDGT [FR–2]
Glc –36 –42 –35
n.a.
Gal –34 –36 –35
2Gly–AR/2Gly–GDGT [FN–4]
Glc
n.a. n.a. n.a.
+140
Gal +90
2Gly–GDGT–PG [FN–8] Glc –21 +23 +52 +110
Gal (*) (*) (*) +63
PI–AR (OH) [FN–7] Ino –37 +360 +540 n.d.
Glycerol backbone
PG–AR [FN–5] –30 +300 +150 +190
2Gly–AR [FR–1] n.a. +110 +150 n.a.
2Gly–GDGT [FR–2] n.a. –32 b.d. n.a.
2Gly–AR; 2Gly–GDGT [FN–4] –39 n.a. n.a. +51
PG–GDGT–PG; 2Gly–GDGT–PG [FN–8] b.d. b.d. b.d. +42
(*) – co–elution with contaminant
n.a. – not analyzed
b.d. – below detection](https://image.slidesharecdn.com/54c05e1e-ddfa-426e-bc0d-230967ccb1b0-160817130319/75/PhD-thesis_Matthias-Kellermann-143-2048.jpg)
![Page | 125
Concluding remarks & future perspectives
Kellermann (2012)
CHAPTER6
[Chapter VI] - Concluding remarks & future perspectives](https://image.slidesharecdn.com/54c05e1e-ddfa-426e-bc0d-230967ccb1b0-160817130319/75/PhD-thesis_Matthias-Kellermann-145-2048.jpg)
![Page | 126
Concluding remarks & future perspectives
Kellermann (2012)
CHAPTER6
Summary and Conclusion
This dissertation focused on microbial presence and metabolic activity in two types of
oceanic extreme environments (Fig. VI.1): cold seeps and hot vents. Those two habitats are
characterized by the dominance of microorganisms with chemoautotrophic metabolism. At
these extreme environments microorganisms rely exclusively on reduced compounds (e.g.,
H2
S and CH4
). The active microbial community was examined in field [Chapters II and IV] and
laboratory [Chapters III and V] studies by analyzing the presence and isotopic composition of
lipid biomarkers, particularly of the intact polar lipids (IPLs), which are thought to reflect the
live/active biomass (White et al., 1979; Harvey et al., 1986; Moodley et al., 2000). The taxonomic
information encoded in the IPL molecules in conjunction with its isotopic compositions
(e.g., carbon and hydrogen) enabled to reveal the function of the microorganisms in these
settings. Symbiotic relations between mussels and aerobic bacteria in hot and cold seeps
were successfully investigated [Chapter II]. Lipid analysis in combination with stable isotope
probing experiments (SIP) allowed to identify the major metabolic processes and dominant
microorganisms involved in thermophilic AOM. Here, the dominant carbon fixation pathway
of the AOM methanotrophic consortia was identified [Chapter III] and archaeal strategies to
adapt to chronic energy stress were hypothesized [Chapter V].
Cold
seeps
Hot
seeps Chapter II:
methanotrophic & thiotrophic
symbionts
Chapter III &V:
anaerobic methane oxidation
[CH4+SO4
2-
--> HCO3
-
+HS-
+H20]
SO4
2-
biotic and abiotic
methane production
oxicanoxic
HS-
CH4
Fig. VI.1. Aerobic and anaerobic zones fueled by reduced chemicals at extreme deep-ocean environments.
The production of CH4
in subsurface sediments occurs by either biologically- (by methanogens) or
abiologically-mediated (thermogenesis; Lollar et al., 2002) breakdown of organic matter. Through advection
and/or diffusion reduced compounds (here CH4
) are transported to the overlying sediment layers where
archaea anaerobically oxidize a vast fraction of the CH4
. Finally, excessive CH4
, escaping AOM, is oxidized
aerobically und excess H2
S is utilized by methanotrophic and thiotrophic bacteria, respectively, both of
which sustain diverse benthic communities (e.g., tubeworms and mussels) at hot and cold seeps.](https://image.slidesharecdn.com/54c05e1e-ddfa-426e-bc0d-230967ccb1b0-160817130319/75/PhD-thesis_Matthias-Kellermann-146-2048.jpg)
![Page | 127
Concluding remarks & future perspectives
Kellermann (2012)
CHAPTER6
In the first research manuscript of this thesis [Chapter II] symbiont–host interactions
were studied using a comprehensive lipid biomarker approach. Three different types of
symbiotic associations were chosen: one host species contained methanotrophic symbionts
(Bathymodiolus childressi from the Gulf of Mexico (GOM); Duperron et al., 2007), a second
contained thiotrophic symbionts (B. cf. thermophilus from the Pacific Antarctic Ridge; Petersen
and Dubilier, unpublished data) and a third with both methanotrophic and thiotrophic
symbionts (B. brooksi from the GoM; Duperron et al., 2007). In their gills, Bathymodiolus mussels
host abundant symbiotic bacteria, which are powered by reducing compounds (e.g., CH4
and
H2
S)emergingfromtheinteriorofsediments(Fig.VI.1;VanDover,2000).Priorlipid-basedstudies
of symbiont–host relations focused on derivatives of intact polar lipids (IPL) such as fatty acids
and/or hopanols (e.g., Gillan et al., 1988; Fang et al., 1993; Abrajano et al., 1994; Jahnke et al.,
1995; Pond et al., 1998). Progress in analytical techniques allowed us to target the abundance of
intact bacterial and host IPLs, which significantly improves the quantification and assignment
of bacterial and eukaryotic biomass inside the gill and foot tissue of the mussels. We were
able to distinguish thiotrophic from methanotrophic bacteria based on their IPL composition,
demonstrating the potential of this lipid class as a powerful tool in symbiont research. The
IPL fingerprinting enabled the estimation of the abundance of bacterial symbionts in the host
tissues. In addition, fatty acids (FA), bacteriohopanepolyols (BHP) and selected methyl sterols
were targeted, since they encode specific information about the metabolic function of the
bacteria. In particular we studied their compound-specific stable carbon isotopic composition,
which can be used to determine dominant symbiotic lifestyle of the bacteria living within the
mussel’s tissue. Furthermore, the distribution and δ13
C values of individual FAs, 4-methyl sterols,
monoalkylglycerolethers (MAGE) and BHPs were indicative of the presence of methanotrophic
or thiotrophic symbionts in the host mussels. Lipids of symbionts which utilized methane
showed a stronger 13
C–depletion compared to sulfide-consuming bacteria. Moreover, the lipid
δ13
C imprints of the gills and foot tissues highlighted the importance of chemosynthetic carbon
supply for all three bivalves.
In [Chapter III], we conducted a lipid–based SIP experiment, aiming to investigate
hetero– and autotrophic carbon fixation for anaerobic methanotrophic archaea (ANME)
and sulfate reducing bacteria (SRB). The combination of SIP with gas chromatography–
amenable compounds (e.g., lipids) is a well–established method which requires the lowest
13
C incorporation for detection. Due to very low carbon assimilation rates during AOM in cold
seep settings (Girguis et al., 2003, 2005; Niemann et al., 2006), previous AOM-SIP experiments
performed in microbial mats using 13
CH4
(Blumenberg et al., 2005) and sediments inoculated
with 13
CH4
and 13
CO2
(Wegener et al., 2008) required a long period of incubation in order to
detect significant 13
C-uptake in bacterial and archaeal lipids. However, long–term incubations
might cause bias due to cross-feeding of 13
C–label from primary consumers to other community
members (Dumont and Murrell, 2005). In our study, we performed short–term incubations of
a maximum of 24 days in a hot seep natural enrichment dominated by ANME–1 and SRBs from](https://image.slidesharecdn.com/54c05e1e-ddfa-426e-bc0d-230967ccb1b0-160817130319/75/PhD-thesis_Matthias-Kellermann-147-2048.jpg)
![Page | 128
Concluding remarks & future perspectives
Kellermann (2012)
CHAPTER6
the HotSeep–1 SRB cluster from the Guaymas Basin (Holler et al., 2011). In addition, multiple
carbon sources (13
CDIC
and 13
CH4
) and deuterated water (D2
O) in the presence and absence of
unlabeled CH4
have been used to study the thermophilic AOM carbon fixation. Introduced
by Wegener et al., (in revision), the dual-SIP involves the assimilation of deuterated protons
from water (i.e., total lipid production) in combination with carbon assimilation from DIC
(i.e., autotrophic production) in lipid biosynthesis, thereby allowing an estimation of auto–
and heterotrophic microbial carbon fixation. Dual–SIP experiments unambiguously showed
that ANMEs and SRBs are pure autotrophs, assimilating almost exclusively inorganic carbon.
Furthermore, this thermophilic enrichment revealed a higher lipid production for the Archaea
than for the Bacteria, highlighting their importance in terms of both biomass production and
activity. Thus, direct methane assimilation does not seem to be relevant for lipid biosynthesis.
This result contrasts from previous studies (SIP–studies) with cold seep sediments (Wegener et
al., 2008), in which methane contributed up to 50% to the archaeal lipid carbon assimilation
(Fig. VI.2). In the absence of methane, metabolic rates dropped dramatically, suggesting that
methane is the crucial energy source to sustain the anaerobic communities in the studied
sediments.Asadirectimplicationofourresults,theinterpretationoflipidstablecarbonisotopic
compositions in AOM systems should be revisited as the microbes are expected to fractionate
carbon from DIC rather than from methane for biomass built up. The application of dual–SIP
provided novel insights to lipid formation and metabolism of microbial consortia mediating
the thermophilic AOM (Fig. VI.2).
SMTZ
Depth(cmbsf)
SMTZ
[CH4
]
CH4
& SO4
2-
(mM)
[SO4
2-
]
HO
O
O
OH
Evidence for
methanotrophy
in archaeal lipids
methanogenic
bacteria Archaea Bacteria
sulfate-
reducing
bacteria
CH4
CH4
CO2 CO2
Hinrichsetal.,1999
Hoehleretal.,1994
IversenandJørgensen,
1985
Reeburgh,1969
Boetiusetal.,2000
Wegeneretal.,2008
thisPhDdissertation
First visualization
of ANME–consortia
AOM-SIP study in sediments
13
C-assimilation in archaeal
and bacterial consortia
Dual-SIP revealing
autotrophic carbon
fixation by Archaea
and Bacteria in AOM
2010200019901980
Functioning of AOM
consortium of methanogenic
and sulfate-reducing bacteria
First biogeochemical
evidence of active AOM
simultaneous removal
of CH4 and SO4
2-
Depth(cmbsf)
Rate measurements
CH4 oxidation = SO4
2-
reduction
in the SMTZ
H2
H2
Archaea Bacteria
[δ13
C = –110‰]CH4
oxidation rate
Rates
(nmol cm-3
day-1
)
SO4
2-
reduction rate
present
13
CO2 & 13
CH4
13
CO2
13
CO2
typical marine sediments cold seep sediments
hot seep
enrichment
Fig. VI.2. History of AOM research. Timeline illustrates the key scientific discoveries in the past three decades
and the significant contribution presented in this thesis.](https://image.slidesharecdn.com/54c05e1e-ddfa-426e-bc0d-230967ccb1b0-160817130319/75/PhD-thesis_Matthias-Kellermann-148-2048.jpg)
![Page | 129
Concluding remarks & future perspectives
Kellermann (2012)
CHAPTER6
In the third research project we focused on the identification of diverse intact archaeal
IPLs from environmental samples. [Chapter IV] demonstrated the systematic fragmentation
patterns of archaeal IPLs providing extensive information for a rapid and straightforward
characterization of archaeal IPLs, which can be readily assessed using high performance
liquid chromatography (HPLC) electrospray ionization mass spectrometry. This archaeal lipid
identification guide enabled us to reveal the archaeal lipid composition in environmental
samples such as the complex archaeal IPL diversity of the thermophilic ANME–1 enrichment
(Holler et al., 2011; [Chapters III and V]).
The last research chapter [Chapter V] utilized the identical short–term incubations
described earlier. However, this SIP experiment only focused on the assimilation of 13
C–labeled
bicarbonate, since [Chapter III] already identified the archaeal community as pure autotrophs.
This stable isotope probing (SIP) study aimed at evaluating 13
C assimilation into archaeal intact
polar lipids (IPLs) relative to total lipid extracts (TLE). Thus, in theory, IPL-SIP should reduce the
requirement of 13
C lipid uptake, allowing either a shorter labelling time and/or a reduction of
the label strength. After TLE extraction, extensive preparative HPLC (normal– and reversed–
phase) was used to successively separate the core from the individual intact archaeal lipids.
A substantial increase in sensitivity of SIP was observed with IPLs compared to TLEs. While
diethers experienced a five-fold increase in sensitivity, the strongest increase in label uptake
of archaeal IPLs has been observed in the tetraether fraction (>35 times). These results are in
accordance to recent studies on archaeal tetraether lipid distribution in marine sediments (Lipp
and Hinrichs, 2009; Liu et al., 2010, 2011) showing a range from 84 to 96% of fossil relative to
the total glyceroldialkylglyceroltetraether (GDGT) pool (Lipp and Hinrichs, 2009; Liu et al., 2010;
2011). Thus, our results clearly demonstrate that previous TLE-SIP in in vitro AOM studies (e.g.,
Blumenberg et al., 2005, Wegener et al., 2008; Chapter III) largely underestimated the actual
labeluptakeofarchaealcommunities.ThechemotaxonomicanalysisofthisANME–1dominated
enrichmentresultedinanIPLcompositionclearlyaffectedbyelevatedtemperatures.Inparticular,
the occurrence of macrocyclic archaeol with phosphatidylethanolamine headgroup (PE-MAR)
and the high contribution of cyclopentane rings in intact GDGTs evidenced archaeal membrane
adaption in order to thrive under heat stress. Furthermore, differences in 13
C–label assimilation
of individual archaeal IPLs provided multiple lines of evidence for phosphatidylglycerolarchaeol
(PG-AR) as the precursor of tetraether biosynthesis and diglycosidic GDGTs (2Gly-GDGT) are
the possible end-products in thermophilic ANME-1 (Fig. VI.3). Here we also postulated that
the formation of membrane-spanning tetraether lipids with glycosidic headgroups reduces
proton-permeability and thus protects the integrity of cells at elevated temperatures. Finally,
we hypothesized that the worldwide ubiquity of 2Gly-GDGTs in mesophilic environments may
likely represent an expression of cell-wall adaptation to cope with energy stress.](https://image.slidesharecdn.com/54c05e1e-ddfa-426e-bc0d-230967ccb1b0-160817130319/75/PhD-thesis_Matthias-Kellermann-149-2048.jpg)
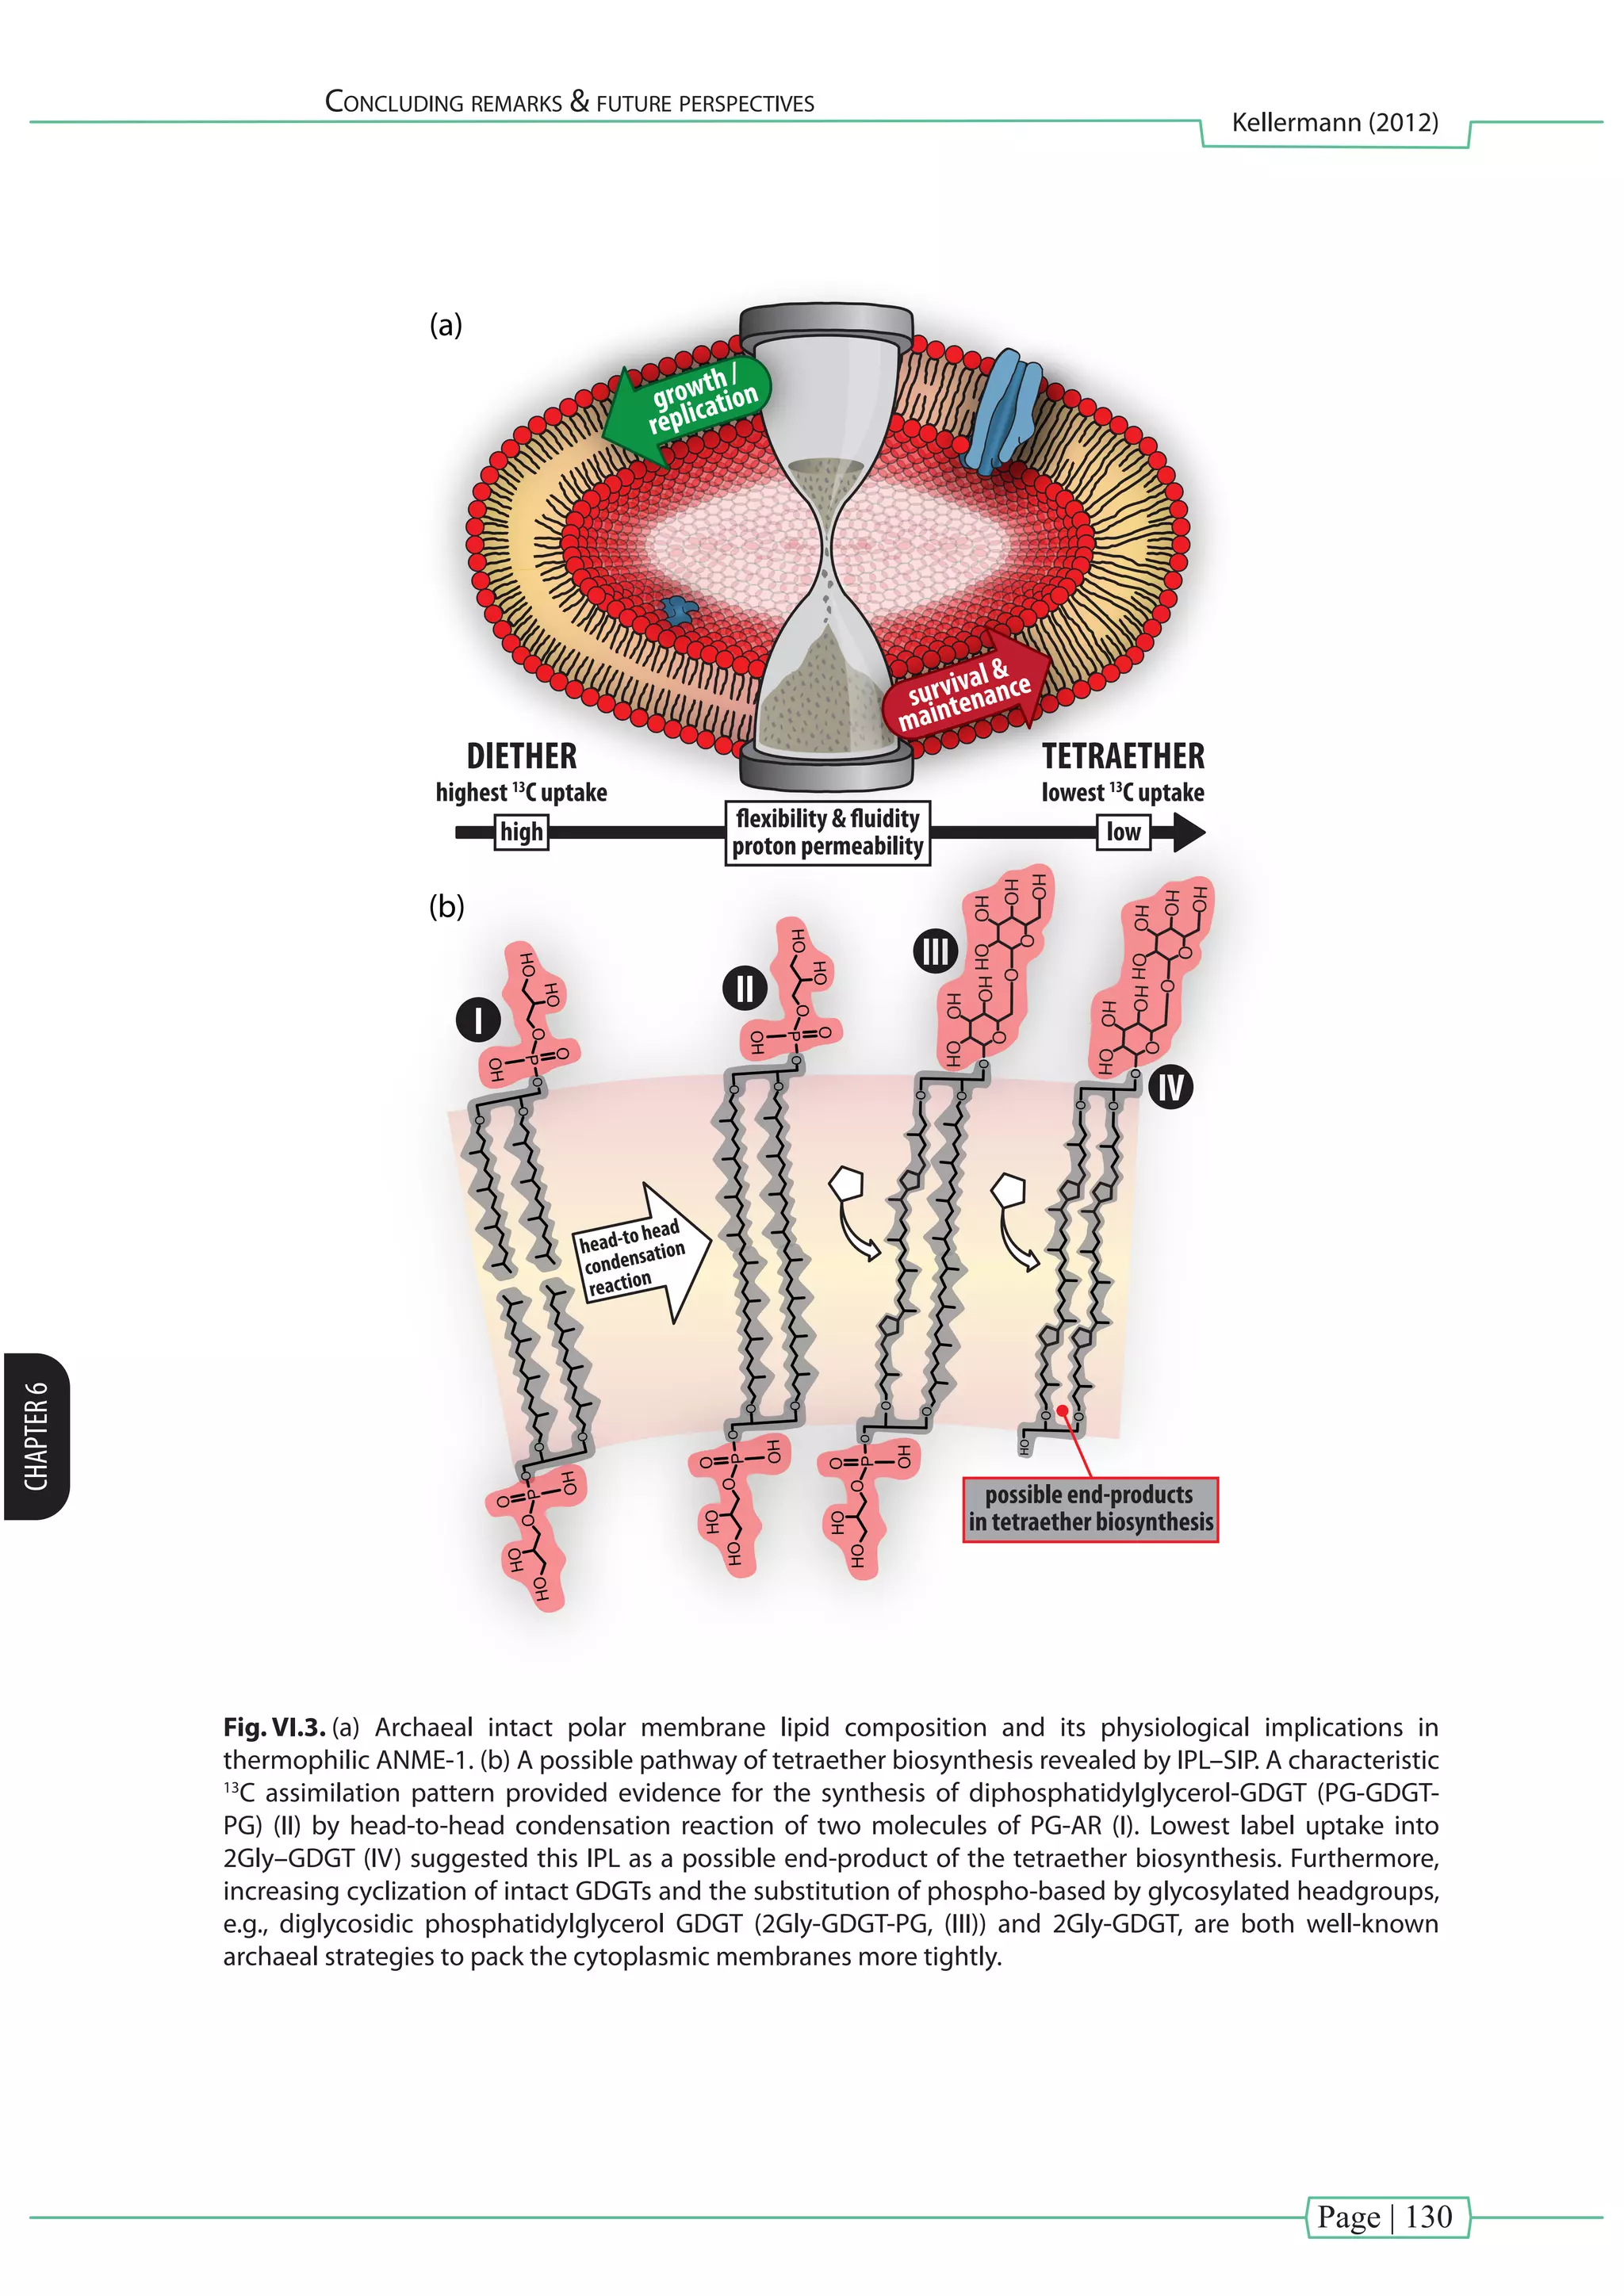
![Page | 131
Concluding remarks & future perspectives
Kellermann (2012)
CHAPTER6
Future perspective
This thesis contributed with novel and valuable scientific information that expands our
current knowledge in organic geochemistry. Nevertheless, new insights into symbiont–host
interaction, autotrophic carbon fixation in thermophilic AOM, and tetraether biosynthetic
pathways have also raised interesting questions for future research:
• Towards precise biomass estimation of symbionts within a eukaryotic host:
Quantifying the proportion of symbionts within a host tissue by IPLs is a promising
new method. However this new technique still needs to be validated to test the
robustness of the IPL-based quantification, preferably in tandem with cell-specific
quantification protocols.
• Putative autotrophy in AOM environments: The autotrophic nature of AOM
microbial communities should also be investigated in cold seep sediments and/or
microbial mats inhabited by different ANME and SRB clades, using the same dual SIP
approach described in [Chapter III]. Although previous AOM-SIP experiments have
shown to be challenging due to limited microbial growth (Blumenberg et al., 2005;
Wegener et al., 2008), the next attempts should exclusively focus on individual IPLs
[Chapter V], thus reducing the requirement of 13
C uptake for detection.
• IPL-SIP in combination with microbial ecology: Future SIP experiments should
examine both IPL-SIP and RNA-SIP in order to combine advantages of both methods
(sensitivity and quantification versus specificity). Although attempted byWebster et
al. (2006) and Singh and Tate (2007), the traditional chromatographic separation of
lipids as PLFAs should be replaced by more extensive preparative HPLC separation
of lipids as shown in [Chapter V].
• SIP experiments in situ: SIP experiments have been mostly performed ex situ in
bottle incubations which are limited to mimic in situ temperatures. Experimental
data has shown that pressure as well as CH4
concentration impacts rates and
pathways of metabolism (de Angelis et al., 1991; Girguis et al., 2003; Kallmeyer and
Boetius, 2004). Future SIP experiments should consider the possibility performing
incubation studies in situ (cf. Takano et al., 2010) in order to exclude biases caused
by changing environmental conditions.](https://image.slidesharecdn.com/54c05e1e-ddfa-426e-bc0d-230967ccb1b0-160817130319/75/PhD-thesis_Matthias-Kellermann-151-2048.jpg)
![Page | 133
Kellermann (2012)
References
[Chapter VII] - References](https://image.slidesharecdn.com/54c05e1e-ddfa-426e-bc0d-230967ccb1b0-160817130319/75/PhD-thesis_Matthias-Kellermann-153-2048.jpg)


![Page | 155
Kellermann (2012)
Appendix
[Chapter VIII] - Appendix](https://image.slidesharecdn.com/54c05e1e-ddfa-426e-bc0d-230967ccb1b0-160817130319/75/PhD-thesis_Matthias-Kellermann-175-2048.jpg)
![Page | 157
Kellermann (2012)
Appendix
Abstract
The isotopic analysis of intact polar lipids (IPLs) is attractive since these are taxonomically
more specific than their apolar derivatives that are commonly subject to isotopic analysis.
Previously, carbon isotope analysis of IPLs was performed after labor-intensive chemical
degradation, a procedure often associated with notoriously low yields. This study adapted
the Finnigan LC IsoLink® interface for the development of a protocol for the determination of
carbon isotopic compositions at natural abundance in IPLs from environmental samples. Using
flow injection analysis of the Finnigan LC IsoLink®, we explored the capability of direct carbon
isotopicmeasurementsofIPLstandards(e.g.,phospholipidssuchasphosphatidylethanolamine
(PE), phosphatidylcholine (PC), phosphatidylglycerol (PG) as well the ether lipid-PC (O–PC)).
In order to prepare these compounds for oxidation in the aqueous state, several preparation
steps have been performed to produce small, unilamellar vesicles via dissolution in organic
solvent, subsequent evaporation of the solvent and addition of aqueous medium. Emulsions of
IPL standards with C equivalents of 60 to 130 ng were analyzed, resulting in reproducible peaks
and precise and mostly accurate determinations of δ13
C. For the IPLs PC, PG, ether lipid-PC and
PG, δ-values determined from ng-quantities via chemical oxidation closely matched those
from off line EA-analyses. However, PE and MGDG (data not shown) exhibited comparatively
smaller peak areas and δ-values differed from those determined by EA by 2 to 4‰. Future work
will extend this approach to a wider range of IPL classes including e.g. archaeal membrane
lipids. Furthermore, additional steps and procedures of liposome preparation will be tested and
evaluated (e.g., variation of temperature, pH, etc.). This new method will help to guide a way to
natural-abundance carbon isotopic determination of IPLs at the ng-scale in combination with
preparative HPLC separation from a wide variety of environmental samples.
ratio45/44
1.15
1.16
1.17
1.18
1.19
m/z44[mV]
0
1000
2000
3000
Time [s]
500 1000 1500 2000 2500 3000 3000
PE
20.2Vs
-32.1‰
(± 0.2‰)
Acetate
40.4Vs
Δ0.3‰
PC
26.4Vs
-31.0‰
(± 0.2‰)
O-PC
27.9Vs
-32.4‰
(± 0.1‰)
PA
42.6Vs
-28.1‰
(± 0.2‰)
PG
36.0Vs
-29.1‰
(± 0.1‰)
Glc
63.7Vs
Δ0.3‰
Acetate
44.6Vs
Δ0.2‰
Glc
62.4Vs
Δ0.1‰
500 1000 1500 2000 2500
-27
-28
-29
-30
-31
-32
-33
-33 -32 -31 -30 -29 -28 -27
ElementalAnalyzer[EA][‰]
LC - IsoLink [‰]
PC
PE
O-PC
PG
PA
0
10
20
30
40
50
PeakArea[Vs]
PE
128ngC
PC
131ngC
PG
122ngC
O-PC
130ngC
PA
130ngC
(a)
(b) (c)
Fig. App.1. (a) Illustration of carbon isotopic analysis of different IPLs using flow injection analysis. 200 ng
of IPLs (equivalent to ~120 ng C) were injected in triplicate, resulting in precise and accurate δ13
C values.
The water soluble acetate and β-D-glucopyranose (Glc) are used as control; Δ indicates the deviation from
the EA value. Rectangular peaks show the reference gas (CO2
). (b) Cross correlation of EA vs. LC–IsoLink IPL
measurements. (c) Peak areas of different IPLs after injection of 122 –131 ng of C.](https://image.slidesharecdn.com/54c05e1e-ddfa-426e-bc0d-230967ccb1b0-160817130319/75/PhD-thesis_Matthias-Kellermann-177-2048.jpg)
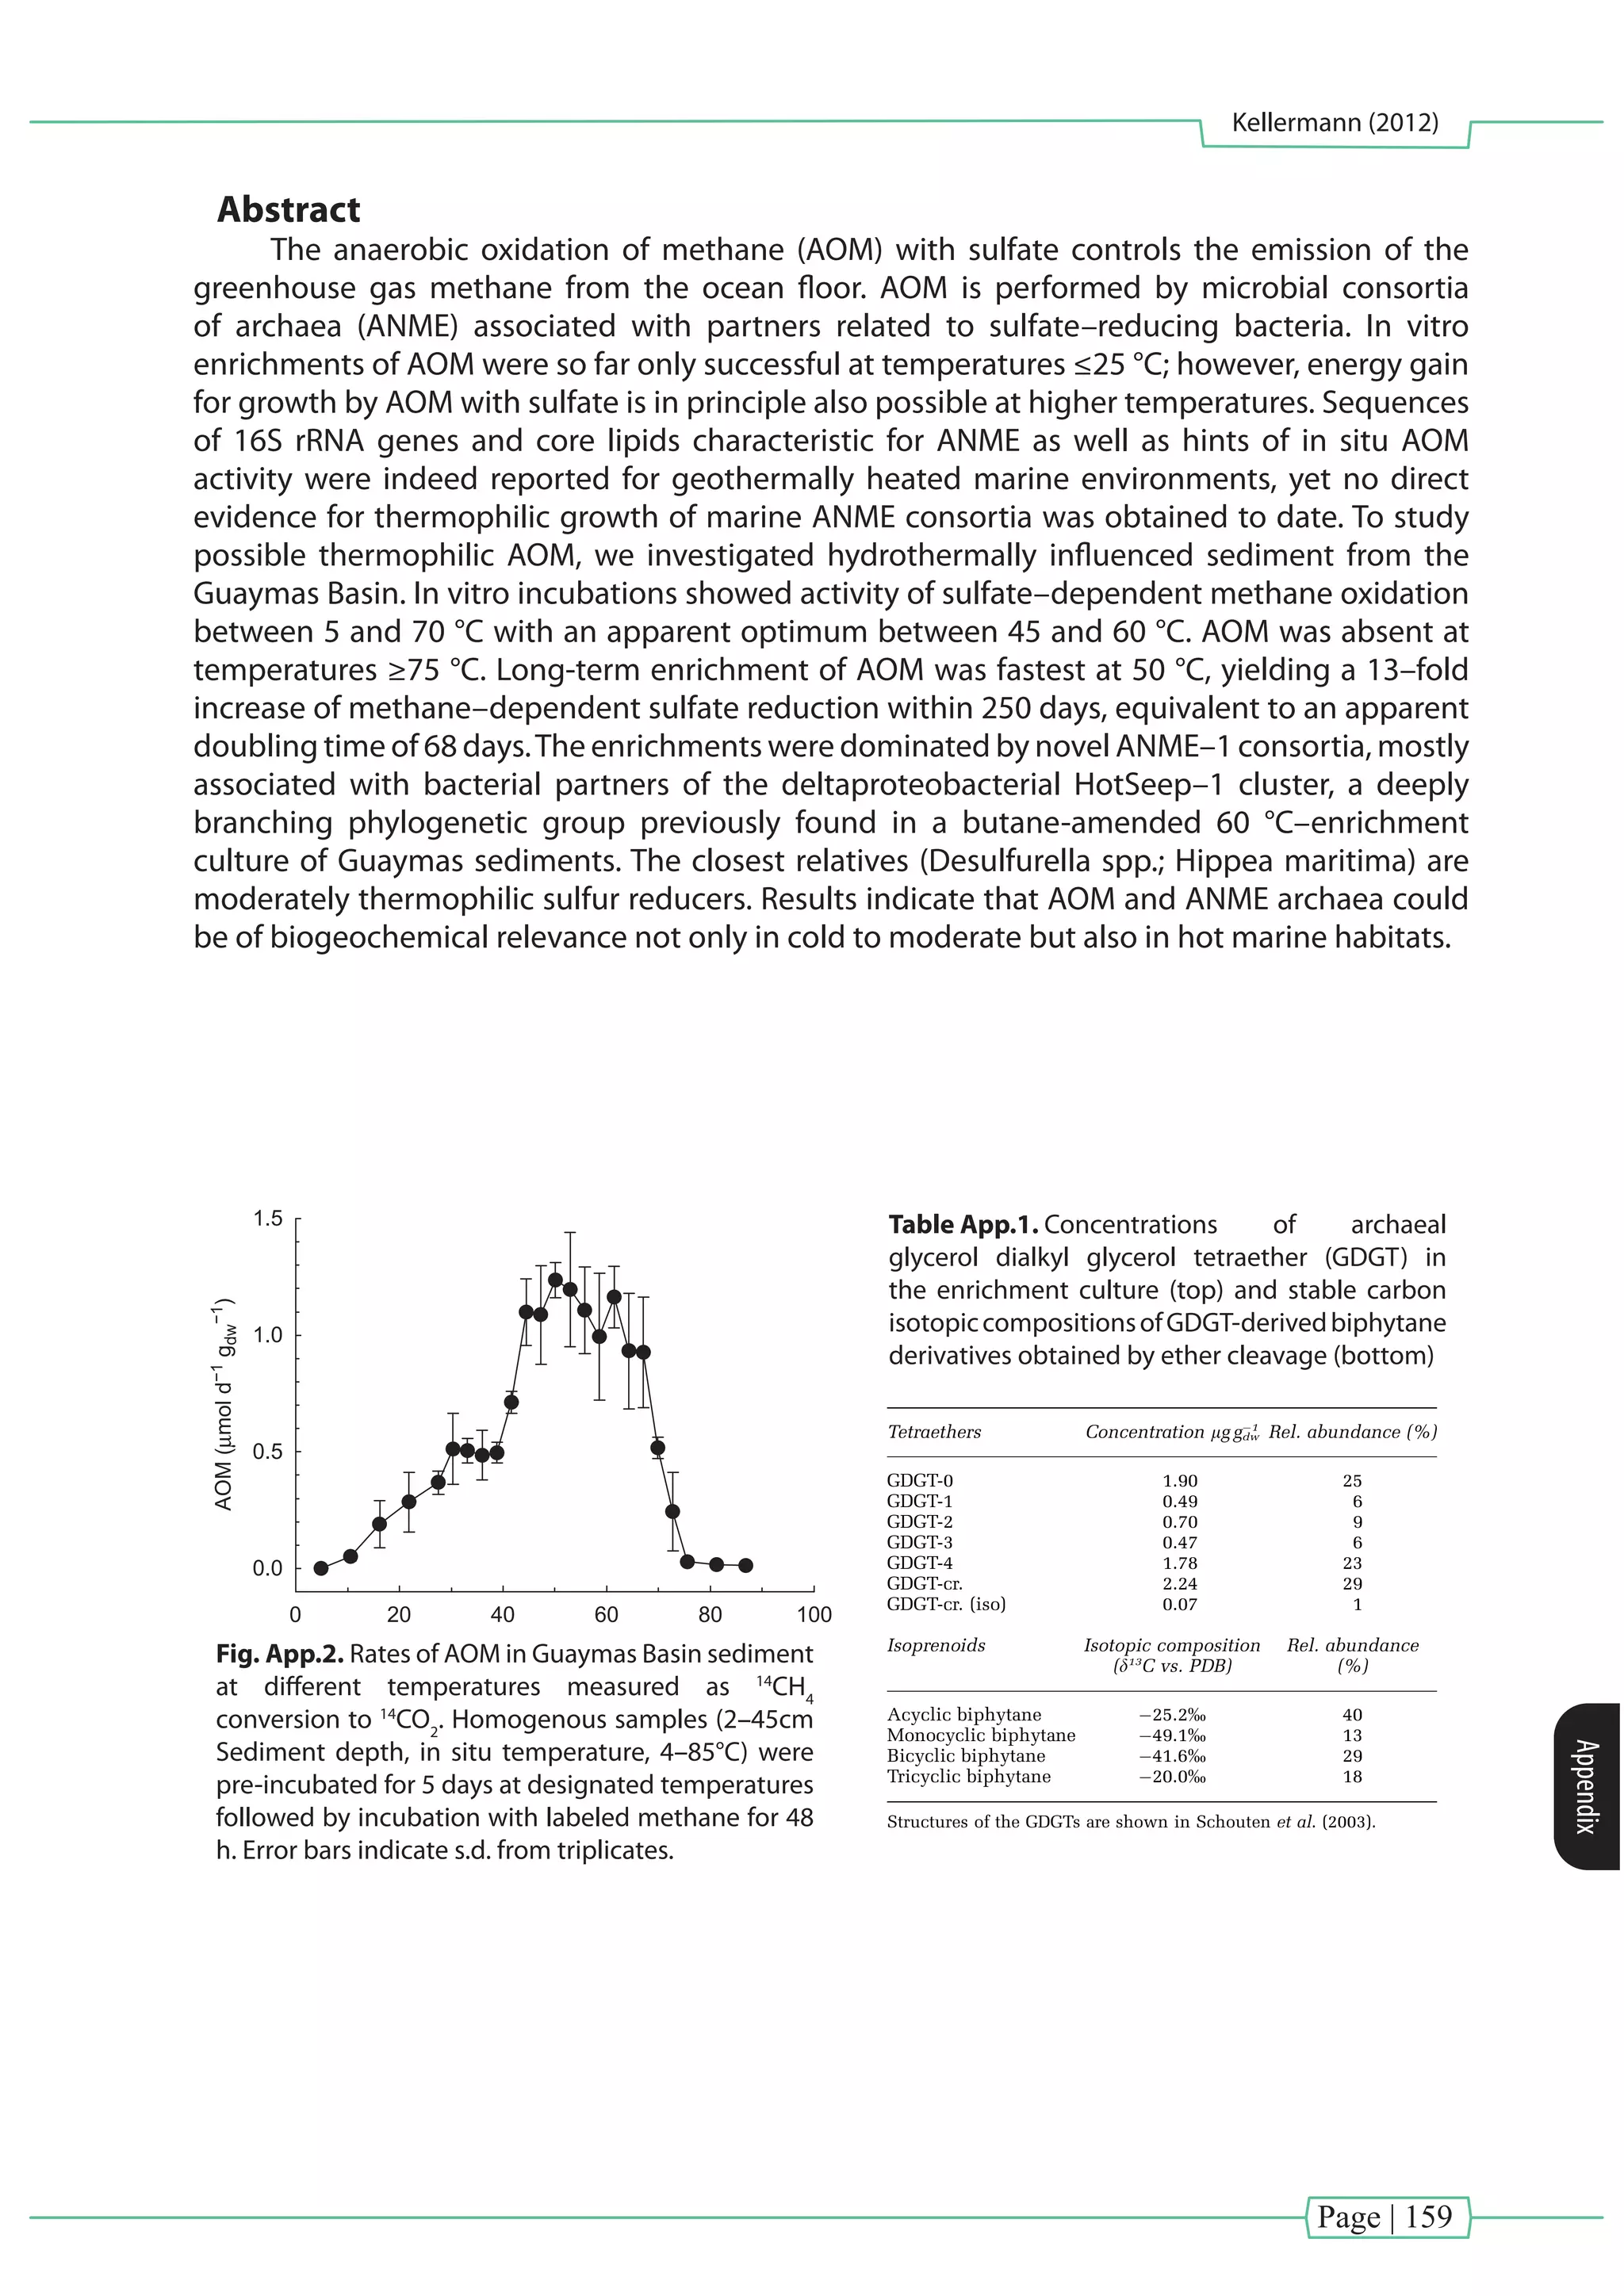
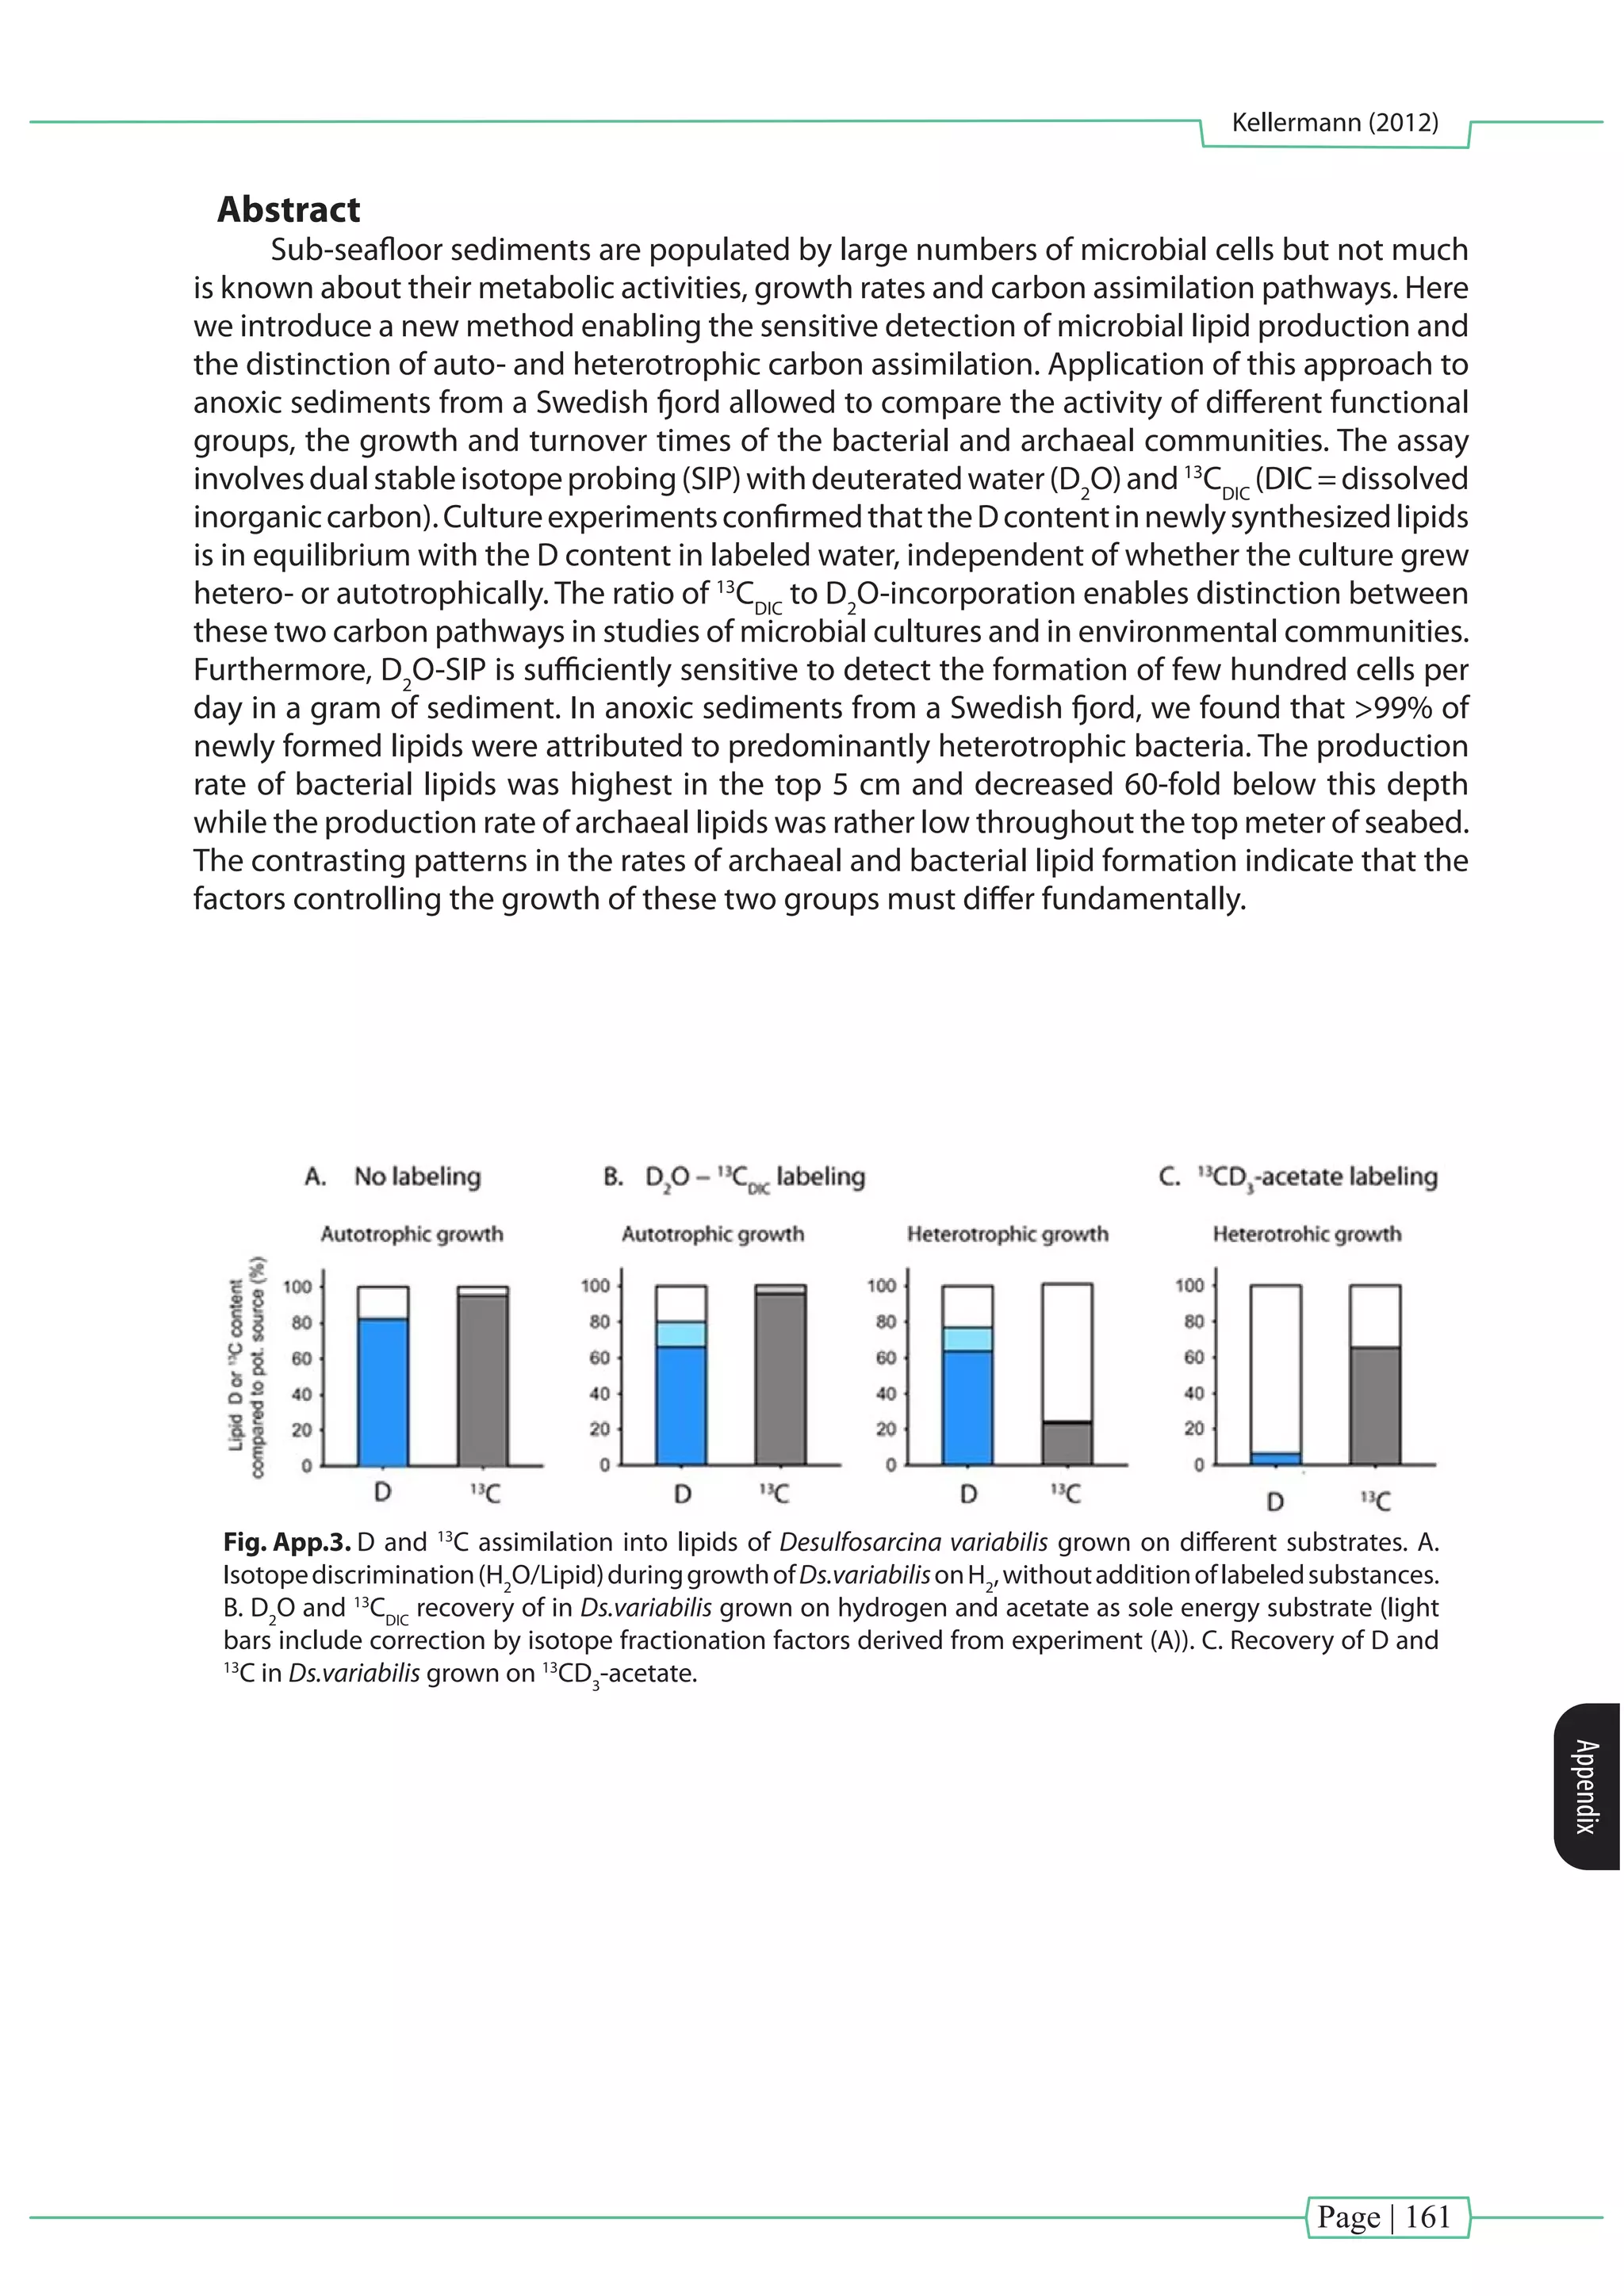
![Page | 163
Kellermann (2012)
Appendix
Abstract
Molecular hydrogen (H2
) is a central metabolite that couples organic matter degradation
andterminalelectron-acceptingprocesses.H2
levelsinnaturalenvironmentsareoftenregulated
bymicrobialsyntrophy;therefore,pore-waterH2
concentrationisausefulparameterforstudying
biogeochemical processes in sediments. However, little is known about H2
concentrations
in marine subsurface sediments. Previous studies applying either a headspace equilibration
technique or an extraction method for the analysis of pore–water H2
in deeply buried sediments
have generated results that sometimes contradict the principles established based on studies
of microbial culture and surface sediments. In this study, we first evaluated and optimized an
extraction method, which was then applied in combination with a headspace equilibration
methodtodetermineconcentrationsofpore-waterH2
insubseafloorsedimentsalongatransect
of five sites of different water depths and geochemical regimes at the continental margin off
Namibia, SE Atlantic.The two methods generated depth profiles with some similarities in curve
shape, but the extraction method yielded higher H2
values than the headspace equilibration
technique. By comparing the two data sets with thermodynamic calculations of potential
terminal electron–accepting processes, we were able to provide a first evaluation of syntrophic
conditions in subseafloor sediment from the perspective of H2
biogeochemistry. We observed
thatinthesulfatereductionzone,theH2
concentrationsarehigherthantheH2
thresholdallowed
for the next most favorable terminal metabolism (methanogenesis), suggesting relaxation of
coupling between H2
–producing and H2
–consuming activities at these depths. In contrast,
the H2
concentrations in the upper methanogenic zone are low enough for methanogens to
outcompete CO2
–reducing acetogens. Our findings suggest the existence of varied extents of
syntrophic H2
coupling in subseafloor sediment.
not, even when the maximal incubation duration was al-
lowed (25 days). In the latter case, we averaged the second
last two measurements to obtain a [H2]INC value. For sam-
ples from Sites GeoB 12811 and GeoB 12815 the time sche-
dule of the cruise only allowed incubation for 5 and 2 days,
respectively, and the resulting data need to be interpreted
with caution.
At the shallow Site GeoB 12802 (Fig. 5), which shows
the highest TOC contents, strongest remineralization and
closest succession of redox zones within the transect,
[H2]INC remains below the thermodynamically predicted
threshold concentrations [H2]TD in the methanogenic zone
but exceeds them in the sulfate reduction zone and in the
near-surface sediment where high Fe2+
concentrations sug-
gest active iron reduction (Fig. 3). An exceptionally high
[H2]INC value of 14.6 nmol LÀ1
, which is above the thresh-
old for acetogenic CO2-reduction (Fig. 4), was observed at
260 cmbsf, close to the upper SMTZ.
At Site GeoB 12803 ($2000 m water depth), where TOC
contents are lower and remineralization less intensive than
at Site GeoB 12802, [H2]INC exceeds [H2]TD throughout
the upper 6 m of the sediment, except for a distinct mini-
mum of [H2]INC at 382 cmbsf. In the iron reduction zone
(2–20 cmbsf), [H2]INC exceeds the [H2]TD for iron reduction
by three orders of magnitude. In the sulfate reduction zone,
0
100
200
300
400
500
600
0 1 2 3 4 5 10 20 30 40
0
50
100
0 0.10
acetogenic
CO2-reduction
methanogenesis
sulfatereduction
iron reduction
[H2]TD (nmol L-1
)
Depth(cmbsf)
LoDm of the
extraction approach
GeoB 12802
Fig. 4. Downcore distribution of [H2]TD values for iron reduction,
sulfate reduction, methanogenesis, and acetogenic CO2-reduction
at GeoB 12802. See text for details of thermodynamic calculation.
The enlarged insert shows the [H2]TD values for iron reduction and
sulfate reduction in the upper sediment column. The methodolog-
ical limit of detection (LoDm) of the extraction approach optimized
in this study is also marked. The range of H2 concentrations at
which a given mode of terminal metabolism maintains its superi-
ority is controlled thermodynamically by this particular reaction
and its next most favorable process.
0 100 200
0
100
200
300
400
500
600
0 100 200 0 100 200 0 100 200 0 100 200
0 1 2 3 4 5
0
100
200
300
400
500
600
0 1 2 3 4 5 0 1 2 3 4 5 0 1 2 3 4 5 0 1 2 3 4 5 14 15
Depth(cmbsf)
[H2
]EXT
(nmol L-1
)
Depth(cmbsf)
Sampled on deck
Sampled in the cold room
[H2
]INC
or [H2
]TD
(nmol L-1
)
25 days23 days5 days11 days2 days
[H2
]TD
for sulfate reduction
[H2
]TD
for methanogenesis
[H2
]INC
or [H2
]TD
(nmol L-1
)
[H2
]INC
or [H2
]TD
(nmol L-1
)
[H2
]INC
or [H2
]TD
(nmol L-1
)
[H2
]INC
or [H2
]TD
(nmol L-1
)
[H2
]EXT
(nmol L-1
) [H2
]EXT
(nmol L-1
) [H2
]EXT
(nmol L-1
) [H2
]EXT
(nmol L-1
)
Redox conditions higher than iron reduction Sulfate reduction
Methanogenesis
EW
increasing water depth
GeoB 12815 GeoB 12808 GeoB 12811 GeoB 12803 GeoB 12802
Iron reduction
Fig. 5. Depth profiles of [H2]INC and [H2]EXT in sediment interstitial waters at five stations, offshore Namibia. The distribution of [H2]TD for
sulfate reduction and methanogenesis is also plotted for comparison. The duration of sediment incubation was listed for individual stations.
The shaded areas mark the methodological limit of detection of the extraction approach.
196 Y.-S. Lin et al. / Geochimica et Cosmochimica Acta 77 (2012) 186–201
Fig. App.4. Depth profiles of [H2
]INC
and [H2
]EXT
in sediment interstitial waters at five stations, offshore Namibia.
The distribution of [H2
]TD
for sulfate reduction and methanogenesis is also plotted for comparison. The
duration of sediment incubation was listed for individual stations.The shaded areas mark the methodological
limit of detection of the extraction approach.](https://image.slidesharecdn.com/54c05e1e-ddfa-426e-bc0d-230967ccb1b0-160817130319/75/PhD-thesis_Matthias-Kellermann-183-2048.jpg)
![Page | 165
Kellermann (2012)
Appendix
Abstract
We studied for the first time the intertidal and subtidal gas seepage system in Mocha
Island off Central Chile. Four main seepage sites were investigated (of which one site included
about 150 bubbling points) that release from 150 to 240 tonnes CH4
into the atmosphere per
year. The total amount of methane emitted into the atmosphere is estimated in the order
of 800 tonnes per year. The gases emanated from the seeps contain 70% methane, and the
stable carbon isotopic composition of methane, δ13
C–CH4
averaged –44.4 ± 1.4‰ which
indicates a major contribution of thermogenic gas. Adjacent to one of the subtidal seeps,
rocky substrates support a diverse community of microbial filaments, macroalgae, and benthic
organisms. While stable carbon isotopic compositions of marine benthic organisms indicate a
dominant photosynthesis–based food web, those of some hard–substrate invertebrates were
in the range –48.8‰ to –36.8‰, suggesting assimilation of methane–derived carbon by some
selected taxa. This work highlights the potential subsidy of the trophic web by CH4
–C, and that
its emission to the atmosphere justifies the need of evaluating the use of methane to support
the energy requirements of the local community.
structural conditions, this coal-bed methane may seep to the surface.
In the present paper, we report the first studies on the extent of
local methane emissions and the potential influence of methane on
the biology of intertidal and shallow subtidal organisms. Flux
variability and the potential transfer of methane through the food
web surrounding gas seepages are particularly addressed.
2. Site description
Mocha Island (381200
S, 731550
W) is located in the western
margin of Central–South Chile at about 35 km from the coast. The
island comprises an area of 52 km2
with a length of ca. 15 km and
an average width of 6 km. The geomorphology of the island is
characterized by a central mountain range (covered with native
forest) parallel to the coast that reaches up to 390 m high, which
is composed of Pliocene marine sequences with Pleistocene
terraces. The mountainous range is surrounded by meadows that
are characterized by a narrow coastal fringe composed of Miocene
and Holocene sequences (Fig. 1).
The island is located at the western margin on the continental
shelf, at ca. 50 km from the tectonic trench that characterizes the
convergence of the Nazca and South American plates. On the
western side of the island there is a series of small islands such as
Quechol, Las Docas, Del Muerto, and Blanca Islands. In particular,
marine Eocene sediments are well exposed in both Del Muerto
and Las Docas Islands (Fig. 1) (Tavera and Veyl, 1958; Nelson and
Manley, 1992; Sa´nchez 2004).
and larger rocks. The intertidal Site A (Fig. 2B) is located on a
sandy beach and contained 150 seeping spots.
Site A was intertidal and located on a sandy beach, whereas Sites
B, C, D, E, F, G, H, and I were rocky subtidal sites. Only Sites A, C, E,
and I were seeps and gas emanation was visible at the surface. Site I
was located ca. 50 m to the north of Del Muerto Island (Fig. 1).
3.2. Sampling
At subtidal Sites C, E, and I, surface water samples were collected
by SCUBA diving above the emanation, and using a carboy in Sites
B, D, F, G, and H. At Site I, additional samples were collected just
above the methane bubbling at 5 m depth. Water samples were
collected in serum bottles, filled, and sealed underwater.
The intertidal Site A (Fig. 2B) is located on a sandy beach with
multiple seeping spots. Overlying water was collected directly on
the seep, and a sediment core of 30 cm long, 70 mm in diameter
was collected by hand. To avoid contamination and facilitate the
seal maneuver, the sand that surrounded the core was removed
with a shovel and immediately sealed with rubber stoppers at
both ends (Fig. 3).
3.3. Assessment of methane concentration in seawater, gas bubbles,
and sediments
Duplicate water samples for gas analyses were immediately
sealed with butyl rubber stoppers in 60 mL serum bottles after
Fig. 2. Subtidal Site C (A), intertidal gas seepage Site A (B), and relict chimney-like structure (C) at Mocha Island.
continental shelf limited in the northwest
iment-filled basins (Nelson and Manley, 1992).
m to be related to subsurface thermogenic hydro-
ons probably trapped within the Cretaceous rock
n Nacional de Energı´a, 2002; Sa´nchez, 2004). The
nd consequent faulting in the Mocha Island area –
Paleocene – could explain this methane seepage.
ource is coal-bed methane, because part of the
m in this area is formed by coal-bearing sediments
n in the Arauco Basin). The respective formation
methane (Mordojovich, 1981), and given proper
ns, this coal-bed methane may seep to the surface.
aper, we report the first studies on the extent of
ssions and the potential influence of methane on
tertidal and shallow subtidal organisms. Flux
potential transfer of methane through the food
as seepages are particularly addressed.
n
(381200
S, 731550
W) is located in the western
–South Chile at about 35 km from the coast. The
n area of 52 km2
with a length of ca. 15 km and
of 6 km. The geomorphology of the island is
a central mountain range (covered with native
the coast that reaches up to 390 m high, which
Pliocene marine sequences with Pleistocene
ntainous range is surrounded by meadows that
by a narrow coastal fringe composed of Miocene
uences (Fig. 1).
cated at the western margin on the continental
from the tectonic trench that characterizes the
he Nazca and South American plates. On the
e island there is a series of small islands such as
s, Del Muerto, and Blanca Islands. In particular,
diments are well exposed in both Del Muerto
nds (Fig. 1) (Tavera and Veyl, 1958; Nelson and
nchez 2004).
3. Methods
3.1. Sampling sites
The study was conducted during four campaigns at the
seepage sites in Mocha Island (Fig. 1) off central Chile (381200
S;
731550
W) in September 2008, and April, June, and November
2009. Subtidal Sites C (Fig. 2A) and E were 1 m deep, whereas Site
I was 5 m deep during low tide. Hard substrate and coarse
sediments, formed mainly by shell fragments, prevail at these
sites, and methane bubbled out through spaces within boulders
and larger rocks. The intertidal Site A (Fig. 2B) is located on a
sandy beach and contained 150 seeping spots.
Site A was intertidal and located on a sandy beach, whereas Sites
B, C, D, E, F, G, H, and I were rocky subtidal sites. Only Sites A, C, E,
and I were seeps and gas emanation was visible at the surface. Site I
was located ca. 50 m to the north of Del Muerto Island (Fig. 1).
3.2. Sampling
At subtidal Sites C, E, and I, surface water samples were collected
by SCUBA diving above the emanation, and using a carboy in Sites
B, D, F, G, and H. At Site I, additional samples were collected just
above the methane bubbling at 5 m depth. Water samples were
collected in serum bottles, filled, and sealed underwater.
The intertidal Site A (Fig. 2B) is located on a sandy beach with
multiple seeping spots. Overlying water was collected directly on
the seep, and a sediment core of 30 cm long, 70 mm in diameter
was collected by hand. To avoid contamination and facilitate the
seal maneuver, the sand that surrounded the core was removed
with a shovel and immediately sealed with rubber stoppers at
both ends (Fig. 3).
3.3. Assessment of methane concentration in seawater, gas bubbles,
and sediments
Duplicate water samples for gas analyses were immediately
sealed with butyl rubber stoppers in 60 mL serum bottles after
Fig. 2. Subtidal Site C (A), intertidal gas seepage Site A (B), and relict chimney-like structure (C) at Mocha Island.
mited in the northwest
elson and Manley, 1992).
urface thermogenic hydro-
within the Cretaceous rock
2002; Sa´nchez, 2004). The
in the Mocha Island area –
lain this methane seepage.
hane, because part of the
by coal-bearing sediments
The respective formation
h, 1981), and given proper
ne may seep to the surface.
st studies on the extent of
l influence of methane on
subtidal organisms. Flux
methane through the food
larly addressed.
located in the western
35 km from the coast. The
a length of ca. 15 km and
rphology of the island is
nge (covered with native
up to 390 m high, which
uences with Pleistocene
ounded by meadows that
nge composed of Miocene
margin on the continental
nch that characterizes the
American plates. On the
s of small islands such as
nca Islands. In particular,
osed in both Del Muerto
d Veyl, 1958; Nelson and
3. Methods
3.1. Sampling sites
The study was conducted during four campaigns at the
seepage sites in Mocha Island (Fig. 1) off central Chile (381200
S;
731550
W) in September 2008, and April, June, and November
2009. Subtidal Sites C (Fig. 2A) and E were 1 m deep, whereas Site
I was 5 m deep during low tide. Hard substrate and coarse
sediments, formed mainly by shell fragments, prevail at these
sites, and methane bubbled out through spaces within boulders
and larger rocks. The intertidal Site A (Fig. 2B) is located on a
sandy beach and contained 150 seeping spots.
Site A was intertidal and located on a sandy beach, whereas Sites
B, C, D, E, F, G, H, and I were rocky subtidal sites. Only Sites A, C, E,
and I were seeps and gas emanation was visible at the surface. Site I
was located ca. 50 m to the north of Del Muerto Island (Fig. 1).
3.2. Sampling
At subtidal Sites C, E, and I, surface water samples were collected
by SCUBA diving above the emanation, and using a carboy in Sites
B, D, F, G, and H. At Site I, additional samples were collected just
above the methane bubbling at 5 m depth. Water samples were
collected in serum bottles, filled, and sealed underwater.
The intertidal Site A (Fig. 2B) is located on a sandy beach with
multiple seeping spots. Overlying water was collected directly on
the seep, and a sediment core of 30 cm long, 70 mm in diameter
was collected by hand. To avoid contamination and facilitate the
seal maneuver, the sand that surrounded the core was removed
with a shovel and immediately sealed with rubber stoppers at
both ends (Fig. 3).
3.3. Assessment of methane concentration in seawater, gas bubbles,
and sediments
Duplicate water samples for gas analyses were immediately
sealed with butyl rubber stoppers in 60 mL serum bottles after
(A), intertidal gas seepage Site A (B), and relict chimney-like structure (C) at Mocha Island.Fig. App.5. Subtidal Site C (A), intertidal
gasseepageSiteA(B),andrelictchimney-
like structure (C) at Mocha Island.
Author's personal copy
collection and poisoned with NaOH (0.5 N final concentration)
until laboratory analysis (within one week after sampling). Part of
the water in each vial was replaced with N2 (499.999%) to
generate a gas headspace and bottles were vigorously shaken for
at least 5 min, and then at 120 rpm for 1 h (Kampbell and
Vandegrift, 1998). Methane was determined on a gas chromato-
graph equipped with a flame ionization detector (Agilent Tech-
nologies, GC 6890N) and a 30 m HP Plot-Q column. The
concentration was calculated using the Bunsen solubility coeffi-
cient at 21 1C (Yamamoto et al., 1976). Precision of the analyses
for our samples was 71% (the average of three samples collected
for each determination), and the detection limit was 0.05 ppm.
The internal volume
and recorded before
rubber septum. Each
and then left to stand
order to transfer mo
the head space (K
methane concentrati
gas concentration us
and whole sediment
the vial headspace
pressure at the time
constant, the temper
porosity.
Gas samples from
funnel connected to
atmospheric air. Th
water by bubbling g
(Dando et al., 1994;
transferred via syrin
bottles prefilled with
the gas was introdu
through a second nee
the incubation conta
4 1C. Additional samp
carbon stable isotop
in a similar way.
3.4. Measurement of
Gas fluxes were
during the sampling
and were estimated u
(Alnor Instruments, U
an inverted plastic fu
device was calibrated
The total gas emission
to Judd et al. (2002). F
at site A is 0.39 m3
h�
between 140 and 16
[0.39� 160] m3
h�1
,
average methane co
6.795� 10�4
metric t
A can be estimated
� 10�4
� 546,624]¼2
3.5. Carbon stable iso
Stable C isotopic c
sedimentary organic
matter, benthic mar
microbial material, a
Sediment sample
sample the top cen
with 1 N HCl to elim
was collected by sie
63 mm mesh to rem
and then filtered on
Fig. 3. Photograph of a sediment core collected from sampling Site A showing the
stratification pattern, and its sediment porewater methane concentration.
G.L. Jessen et al. / Continental Shelf Research 31 (2011) 574–5
Fig. App.6. Photograph of a sediment core
collected from sampling Site A showing the
stratification pattern, and its sediment porewater
methane concentration.](https://image.slidesharecdn.com/54c05e1e-ddfa-426e-bc0d-230967ccb1b0-160817130319/75/PhD-thesis_Matthias-Kellermann-185-2048.jpg)