This PhD thesis experimentally investigates the effect of microsolvation (single solvent molecules) on the absorption properties of ionic chromophores using gas phase spectroscopy techniques. A model system of nitrophenolate ions is used to study the perturbing effects of single solvent molecules, and the results are applied to understand how single water molecules or amino acid residues can impact the absorption of biological chromophores in their natural protein environments. The aim is to reveal intrinsic properties of chromophores and gain insights into environmental effects by comparing bare and microsolvated species.


![2 Chapter 1. Introduction
The study of the bare chromophores extracted from their natu-
ral environment reveals intrinsic properties of the individual chro-
mophores. These studies are enabled by gas-phase spectroscopy
techniques, that allow the study of the bare chromophores as both
ionic and neutral species[1–4]. Isolated chromophores have been
studied in great detail, both experimentally and theoretically[5–18].
In recent years computational power has increased, enabling the
use of high accuracy quantum chemistry calculations on biological
systems[19, 20]. Combining experimental results with quantum
chemical calculations can give previously unknown insights into
the actual mechanisms in play for the different systems. Com-
paring the studies of the unperturbed chromophores to the ones
conducted on the chromophores in solution phase reveal information
about the perturbing nature of the specific solution. Since many
bio chromophores in nature exists in protein pockets[21–23], their
actual natural environment might be some place in between gas
phase and solution phase, where effectively only few interactions
with the environment are of importance. Only a few studies have
investigated the effects of single solvent molecules on the photophys-
ical properties of biochromophores, and these studies has focused
on specific chromophores and not the overall effect of a solvent
molecule[24–28].
The aim of this PhD study has been to experimentally investi-
gate the effect of micro solvation of ionic chromophores by single
solvent molecules on the transition energies of the chromophores.
Knowledge about the perturbing effects of single solvent molecules is
an important piece in understanding the effects of the local environ-
ment on the biochromophore systems, where single water molecules
or amino acid residues might interact with the chromophore in the
protein pocket. More specifically a model system of nitrophenolates
has been studies in order to limit the level of complexity of the
system. The knowledge gained from the model system is then
used to understand the specific perturbing effects of single solvent
molecules on bigger biological chromophores.
Absorption spectroscopy is usually used to reveal the absorption
energies of chromophores in solution. Here the fraction of incident
light absorbed by the solution is used to calculate the absorbance
of the system. This works well for chromophores in solution where](https://image.slidesharecdn.com/683d4131-560b-40b7-aabd-4b72f336e72f-161214213503/85/Phd-thesis-Jorgen-Houmoller-final-16-320.jpg)


![6 Chapter 2. Experimental Setup - sep1
2.1 Overview
sep1 is an accelerator mass spectrometer (Figure 2.1 on the pre-
ceding page)[29–34]. Magnetic and electric fields are utilized to
select and analyse ions and fragment ions. The first section of the
instrument is the ion source. The ion source currently installed
is an electrospray ion source. In the next section of sep1, the
ions are accelerated by en electric field gradient over the distance
of approximately one meter. Normally the ions are accelerated
to a kinetic energy of 50 keV per charge. The ions of interest are
then separated according to their mass over charge ratio by an
electromagnetic field. In the long straight path from the magnet to
the electrostatic analyser (ESA), the ions can interact with a laser
pulse. An electric field is utilized in the ESA for separating ions
based on their kinetic energy to charge ratio. After the analyser, a
channeltron detector is used to count the number of fragment ions.
A new detector-section was added to sep1 in April of 2016. The
new section houses a detector that enables sep1 to monitor the
yield of neutral fragments, which are not effected by the electric
fields in the ESA.
2.2 Ion source
As mentioned before, the ion source at sep1 is an electrospray
ion source[35]. Electrospray ionization was invented in the late
1980s as an effective way of transferring large fragile biomolecules
into the gas phase[36]. A detailed description of the theory behind
electrospray is outside the scope of this thesis, and only the resulting
effects and an overall description will be given in the section below.
A schematic representation of the ion source at sep1 can be found
in Figure 2.2 on the next page.
A syringe pump pushes solution through an electrospray needle
at a constant flow of the order of µl min−1
. A high voltage is applied
to the needle, which ensures that the droplets are highly charged
when leaving the needle. The low pressure in the first chamber and
the potential difference between the needle and the heated capillary,
draws the droplets through the heated capillary, where the solvent](https://image.slidesharecdn.com/683d4131-560b-40b7-aabd-4b72f336e72f-161214213503/85/Phd-thesis-Jorgen-Houmoller-final-20-320.jpg)
![2.2. Ion source 7
Figure 2.2: Illustration of the electrospray ion source. A needle with
a high voltage applied, followed by a heated capillary transfers the ions
into the gas phase. The generated ions are focused through a skimmer
by a tube lens. The ions can be stored in the octopole or in the linear
14-pole ion trap before acceleration. When ions are stored in the linear
ion trap, helium buffer gas i used to cool down the ions.
is evaporated. The surface charge makes the droplets coulomb
explode when sufficient solvent has evaporated. After several cycles
of evaporation and coulomb explosions bare ions are left.[37, 38] The
output of the heated capillary is displaced a bit off center compared
to the skimmer entrance. The off center shift minimizes the number
of neutral solvent molecules entering the octopole. A tube lens
focuses the ions through the skimmer and into an octopole. The
octopole and the first lens package is used to guide the ions into the
14-pole trap. The octopole can additionally be used as a reaction
chamber where ions undergo reactions with solvent molecules. A
small tube is placed around the octopole, and a small nuzzle directs
the solvent vapour into the octopole (Figure 2.3). The ion picks up
solvent molecules through collisions in the octopole. To maximize
the number of ion-molecule reactions, the ions are trapped in the
octopole with the first lens in the lens package acting as an end-
electrode of a trap, effectively transforming the simple octopole into
an ion trap. After passing the octopole and the first lens package,
the ions enter a 14 pole ion trap (Figure 2.4 on the following page).
Through collisions with helium buffer gas, the trap can store and
cool the ions to room temperature. After the ion trap, the ions are
accelerated to kinetic energies of 50 keV and then steered into the
mass over charge selecting magnet.](https://image.slidesharecdn.com/683d4131-560b-40b7-aabd-4b72f336e72f-161214213503/85/Phd-thesis-Jorgen-Houmoller-final-21-320.jpg)


![12 Chapter 2. Experimental Setup - sep1
(a) (b)
Figure 2.7: (a) Illustration of the CEM at sep1. (b) Illustration of
the working principal of the CEM. The grading through the channel
illustrates the cascade of secondary electrons created. The potential
difference over the CEM is 2.5 kV. [Illustrations are based on figures
from the CEM user manual]
Signal
1 µF
Anode
1 M
2.4 kV
10 M
CEM Back
Figure 2.8: Circuit used for potential control and signal extraction
for Detector 1. The 2.4 kV is applied to the back of the CEM, in
addition to −100 V applied to the front (not shown here). This small
negative potential prohibits low kinetic energy electrons from entering
the detector.
transferred to a discriminator, which outputs a NIM or TTL pulse
when triggered. At the end a computer basically counts the number
of output pulses from the discriminator. The signal at all three
stages can be seen in Figure 2.9 on the next page.
There are two main types of discriminators, the leading-edge
discriminator and the constant fraction discriminator (CFD). The
leading edge discriminator is the simplest. It outputs a signal
when the input signal reaches a defined threshold (Figure 2.10(a)
on the facing page). If the height of the input signal varies, the
leading-edge discriminator will introduce a time walk. When using](https://image.slidesharecdn.com/683d4131-560b-40b7-aabd-4b72f336e72f-161214213503/85/Phd-thesis-Jorgen-Houmoller-final-26-320.jpg)

![14 Chapter 2. Experimental Setup - sep1
out at sep1, the CFD is used as a simple leading edge discriminator.
The output from the CFD used at at sep1 is a fast NIM pulse with
a rise time of 2 ns.
2.4.2 Detector 2
It is only possible to monitor the yield of individual charged frag-
ments using the ESA and detector 1. In the special cases where
electron emission is one of the dominant deexcitation channels, one
needs to measure a depletion of the parent ion beam, when using
the ESA and detector 1. Depletion signals are often very difficult
to measure, since the depletion signal is usually on the same order
as the fluctuations in the parent beam. When a singly charged ion
fragments or an anion detaches an electron, a neutral species always
remain. This neutral is not affected by the electrostatic potential
of the ESA, and will pass right through the analyser, with a high
kinetic energy. This high kinetic energy neutral molecule can be
detected by what is called a secondary electron detector (SED).
The SED at sep1 (Figure 2.11 on the facing page)[39] is com-
posed of a glass plate, coated with indium tin oxide. Indium tin
oxide has a work function of approximately 4.5 eV[40], is highly con-
ductive and transparent. These properties make indium tin oxide
a good coating for secondary electron generation for this detector.
The coating needs to be conductive since applying a negative poten-
tial on the glass plate can help in guiding the generated electrons.
The coating furthermore needs to be transparent for laser light to
pass through it. When a particle with high kinetic energy is indent
on the coated glass plate, an electron can be emitted from the
surface. This secondary electron is guided towards a channeltron
detector by the applied electric field. The output pulses of the
channeltron detector are counted as previously described.
In principal this detector can detect the full action spectra (dis-
regarding photo emission) in one go. In the current configuration
however, it is mostly useful for ion-current stability measurements,
and special cases where electron detachment plays a significant role.
Since the detector sits directly in the path of the neutrals from the
parent beam, a fast channeltron is needed for high accuracy mea-
surements. The SED was first tested on the p-benzoquinone anion,](https://image.slidesharecdn.com/683d4131-560b-40b7-aabd-4b72f336e72f-161214213503/85/Phd-thesis-Jorgen-Houmoller-final-28-320.jpg)

![16 Chapter 2. Experimental Setup - sep1
3.2 3.0 2.8 2.6 2.4 2.2 2.0
Energy [eV]
380 430 480 530 580 630
Wavelength [nm]
0
0.5
1 (b)(b)(b)
ActionYield[arb.unit]
0
0.5
1 (a)(a)(a)
Figure 2.12: Action spectra from the first test of the SED on the
p-benzoquinone anion. (a) Depletion measurement. (b) SED measure-
ment. For both measurements the running average is superimposed as
the red solid line.](https://image.slidesharecdn.com/683d4131-560b-40b7-aabd-4b72f336e72f-161214213503/85/Phd-thesis-Jorgen-Houmoller-final-30-320.jpg)
![2.6. Shortcomings of sep1 17
for photon absorption is calculated by the use of
S − B
B · (Plaser · λ)n
, (2.5)
where S is the ”Laser on” signal, B is the ”Laser off” signal, Plaser is
the laser power measured at wavelength λ and n is the photon order
i.e. the number of photons required to be absorbed before the ion
fragments. Equation 2.5 assumes that the absorption cross section
is a constant after absorption of the first photon. This assumption
is clearly only an approximation, which is why two-photon processes
are inherently difficult to analyse.
The full action spectrum is the weighted sum of the action
spectra of the different fragmentation channels. To find the frag-
ments of interest, a scan of the analyser voltage is performed. The
power-dependence (fragmentation as a function of laser power) is
measured for all significant fragments to determine the photon order.
If the yield of fragmentation increases linearly with laser power, the
photon order is one, and so on.
2.6 Shortcomings of sep1
There are two major disadvantages of sep1. The first disadvantage
is the lack of luminescence detection, which we have taken care of
by building a stand-alone luminescence setup luna. The second
disadvantage is time frame for fragmentation detection. The short
µs time frame can lead to what is know as a kinetic shift. Kinetic
shifts occur when the dissociation time changes with wavelength,
and the time window for measurements is too short to measure
all fragmentations illustrated in Figure 2.13 on the following page.
This can be understood on the basis of a fragmentation process with
an activation energy Ea. If the Arrhenius expression is applicable
for calculating the rate constant[41], then the rate constant for
dissociation can be described as:
kn = A · exp(−Ea/kbT∗
n ), (2.6)
where A is a pre-exponential factor and T∗
n is the effective tempera-
ture of the molecule after absorption of n photons. The effective](https://image.slidesharecdn.com/683d4131-560b-40b7-aabd-4b72f336e72f-161214213503/85/Phd-thesis-Jorgen-Houmoller-final-31-320.jpg)
![18 Chapter 2. Experimental Setup - sep1
Time
Signal
Measurement
timeframe
Figure 2.13: Kinetic shift illustrated. This plot shows the dissoci-
ation as a function of time, after absorbing a red photon (long decay
time) and a blue photon (short decay time). The measurement time
frame captures nearly all the dissociation after absorbing a blue photon,
but only detects a fraction of the dissociation after absorbing a red
photon.
temperature is dependent on the absorbed photon energy[42]. Ab-
sorbing a red photon results in a ”cold” ion with a long lifetime
and absorbing a blue photon results in a ”hot” ion with a short
lifetime. At sep1, the dissociation time window is limited to a few
µs, which could result in a discrimination towards high energies, as
absorption of a high-energy photon results in faster dissociation, .
In order to avoid misinterpreting the data due to kinetic shifts, one
could measure the dissociation at a storage ring facility or from a
trap, where the experimental time windows is much longer.](https://image.slidesharecdn.com/683d4131-560b-40b7-aabd-4b72f336e72f-161214213503/85/Phd-thesis-Jorgen-Houmoller-final-32-320.jpg)
![Chapter 3
Experimental Setup - luna
Luminescence is relaxation by light emission. Luminescence is
categorised in two categories: fluorescence and phosphorescence.
Fluorescence is a fast processes, where the deexcitation happens
between two levels of equal multiplicity. Fluorescence happens on
the time scale of 1 ns to 100 ns. Phosphorescence happens when
the levels has different multiplicities e.g. between a singlet and a
triplet state. The classically forbidden transition results in a slow
process on the time scale of milliseconds to multiple seconds. When
a molecule is excited into an Sn state, internal conversion to the S1
state is very fast, few hundred fs to ns. Consequently the excited
molecule has ended up in the first electronically excited state, before
it has hat time to emit a photon. This effect was formulated by
Michael Kasha in 1950 and formally known as Kasha’s rule[43]: The
emitting electronic level of a given multiplicity is the lowest excited
level of that multiplicity, meaning that the emission spectra of a
molecule is independent on the excitation energy. Subsequently,
the emitted photon from luminescence is often shifted to a lower
energy relative to the absorbed photon, this is known as the Stokes
shift.
As described in the last section of the previous chapter, one
of the shortcomings of sep1, is the lack of luminescence detection.
This particular deexcitation pathway has some very interesting
properties in addition to being another piece in the Action-Spectra
puzzle. Since luminescence basically only takes place from the
19](https://image.slidesharecdn.com/683d4131-560b-40b7-aabd-4b72f336e72f-161214213503/85/Phd-thesis-Jorgen-Houmoller-final-33-320.jpg)
![20 Chapter 3. Experimental Setup - luna
lowest electronic excitation, it is possible to study the energy spacing
between three electronic states in one go. This is nicely illustrated
by looking at the potential results from a future experiment done
on chlorophyll dimers.
Chlorophyll is the chromophore responsible for light absorption
by green leafs in the photo synthesis mechanism. The light ab-
sorption and subsequent energy transfer in photosynthesis has a
conversion efficiency of 95 %[44]. This efficiency is clearly much
higher than current state of the art solar cells, which have effi-
ciencies of approximately 40 %[45]. The absorption spectra of bare
chlorophyll ion (ref [46] and paper VI) has been blue shifted al-
most 50 nm compared to cholophyll in a variety of natural protein
complexes[47–50]. It has been argued that the observed blue shift
in transition energy could be an effect of an excitonic coupling
between two or more pigments[51]. An exciton coupling is duo to
the interaction between two or more transition dipole moments.
The interaction results in the formation of two new energy levels,
exemplified by the interaction between two chlorophyll molecules
in Figure 3.1 on the next page, where the two unperturbed levels
ψ1
1ψ0
2 and ψ0
1ψ1
2, corresponding to an excitation to either the first
chlorophyll molecule or the second, are split into two exciton states
labelled Ψ+
and Ψ−
. The exciton coupling results in both a blue
shifted and a red shifted level compared to the unperturbed levels.
The absorption of light by bare chlorophyll molecules and by
clusters of two chlorophyll molecules and a charge tag has been
studied in the papers VI and VII. The resultant action spectra
can be seen in Figure 3.2 on page 22. The data shows that the
chlorophyll dimer is red shifted by 23 nm (0.07 eV) compared to the
monomer. Aside from the shift in transition energy, the double-
maximum character of the monomer spectrum is not present for
the dimer, the origin of this effect is unknown. The second band
in the dimer spectrum, around 610 nm, might originate from the
higher-lying exciton state, but this needs further investigation.
In a flourescence experiment it might be possible to excite
the dimer with a single E + ∆E photon and then monitor the
fluorescence of E −∆E photons. If the system fluoresces at E −∆E
then the presence of an exciton coupling has been established.
Studying the chlorophyll dimer by a fluorescence experiment is a](https://image.slidesharecdn.com/683d4131-560b-40b7-aabd-4b72f336e72f-161214213503/85/Phd-thesis-Jorgen-Houmoller-final-34-320.jpg)
![3.1. Overview 21
Figure 3.1: Simple level diagram illustrating an exciton coupling.
The states on the left are the unpertubed states, and the states on the
right are the shiftet exciton states. The exciton splitting ∆E is shown.
The exciton structure can be probed by flourescence experiments, where
the system is excited by a E +∆E photon adn flourescence is monitored
for E − ∆E photons. For further explanation see text.
long term goal. To reach this goal, a new fluorescence setup has been
built. Since the experimental setup is new, it will be described in
some detail in the following sections. Some experimental results be
will shown, but not discussed in great detail. The details regarding
the individual results can be found in the papers VIII and IX.
3.1 Overview
Even though the fluorescence quantum yields for special laser dye
molecules are near unity[52], it has not been possible to detect
any fluorescent light at sep1. It is nearly impossible to detect
photons emitted by ions that are moving perpendicular to the
photon-detection at kinetic energies of 50 keV. So in order to
study photon emission, it was necessary to build a dedicated setup
for luminescence experiments called LUminescence iNstrument in
Aarhus, in short luna. The overall framework of luna is based
upon the setups described in ref [53] and [54]. The overall setup is
illustrated in Figure 3.3 on page 23. The ion source is in principal
the same as is sep1. The only difference is that instead of a linear
ion trap and an acceleration region as present at sep1, luna utilizes
a simple Paul trap[55] to store the ions. Since the ions need to be](https://image.slidesharecdn.com/683d4131-560b-40b7-aabd-4b72f336e72f-161214213503/85/Phd-thesis-Jorgen-Houmoller-final-35-320.jpg)
![22 Chapter 3. Experimental Setup - luna
2.2 2.1 2.0 1.9
Energy [eV]
0
0.5
1
(a)
550 570 590 610 630 650 670
Wavelength [nm]
0
0.5
1
(b)
Photofragmentyield[arb.unit]
Figure 3.2: Action spectra of Chlorophyll monomers (blue broken
line) and dimers (black points and red running average) for two different
charge tags (a) tetramethylammonium cation, (b) acetylcholine cation.
A clear red shift is seen for both charge tags, but is is difficult to
determin if the shift is a result of an exciton coupling or some other
effect. [papers VI and VII ]](https://image.slidesharecdn.com/683d4131-560b-40b7-aabd-4b72f336e72f-161214213503/85/Phd-thesis-Jorgen-Houmoller-final-36-320.jpg)

![24 Chapter 3. Experimental Setup - luna
12
10
8
6
4
2
0
y[mm]
-10 -5 0 5 10
z [mm]
12
10
8
6
4
2
0
x(ory)[mm]
-10 -5 0 5 10
z [mm]
(a) (b)100 V 100 V 100 V
0 V0 V
Figure 3.4: Shows calculated electric field gradients using an ideal
quadropole field (Dotted lines) and the simplified design (Full lines) for
two different crossectiopns of the trap. The two figures shows the trap
cut in two different planes.
3.2 Ion Trap
As mentioned earlier, the ion trap in this setup is a simplified version
of the Paul trap. In a Paul trap (3D quadrupole), an RF field creates
a rotating saddle point potential, that keeps the ions centred in the
trap. The original Paul trap uses hyperbolic geometries to optimize
the electric field gradients for ion trapping. The simplified version
of the Paul trap used at luna uses a much simpler cylindrical
geometry with planar end caps. This simplification results in minor
changes to the field gradient, but as evidenced by the numerical
calculations shown in Figure 3.4, the effect is only visible close
to the edges of the trap. The simplified design is much easier to
manufacture and the difference in trapping efficiency should be
minimal for our setup, since the ions are entering the trap along z
axis in figure 3.4. In the luna setup, one of the end caps has been
replaced by a wire grid. This grid lets the emitted light be collected
at a much larger solid angle than in other fluorescence setups[56–58].
The solid angle for light detection at luna is approximately ten
percent.](https://image.slidesharecdn.com/683d4131-560b-40b7-aabd-4b72f336e72f-161214213503/85/Phd-thesis-Jorgen-Houmoller-final-38-320.jpg)


![3.4. Mass selection 27
(a) (b)
Figure 3.7: Illustrating the principle behind the spectrometer used
at luna. (a) is a simple illustration of the working principle and (b) is
an overlay of a picture of the actual spectrometer used at luna.
isolated colors are then focused onto a CCD array for detection
by the refocusing mirror. The charge build up on the CCD array
is measured and the intensity of light as a function of placement
on the CCD i.e. the color of the light, can then be extracted.
The angle of the mirrors and the line density of the grating can
be controlled by the control software for the spectrometer, which
makes it possible to control the resolution and optical range for
the measurement. Likewise it is possible to adjust the speed and
method of which charge is read from the CCD in order to maximise
the reading speed, while still keeping the electric readout noise at a
minimum.
3.4 Mass selection
3.4.1 Mathieu stability diagram
The behaviour of ions in a quadrupole ion trap can be described
by the second order linear differential equation know as the Math-
ieu equation [59, 60]. When written for ion motion in an ideal
quadrupole field, the Mathieu equation is given by](https://image.slidesharecdn.com/683d4131-560b-40b7-aabd-4b72f336e72f-161214213503/85/Phd-thesis-Jorgen-Houmoller-final-41-320.jpg)
![28 Chapter 3. Experimental Setup - luna
d2
u
dξ2
+ [au − 2qu cos(2ξ)]u = 0, (3.1)
where, ξ = Ωt/2 is a dimensionless parameter, with Ω being the
radial frequency of the ring electrode potential, u represents the
x, y and z coordinates and a and q are dimensionless trapping
parameters (when cylindrical coordinates are used)
az =
−16qeU0
m(r2 + 2z2
0)Ω2
, (3.2)
qz =
8qeV
m(r2 + 2z2
0)Ω2
, (3.3)
where m and qe are the mass and charge of the ion, Ω and V are the
angular frequency and amplitude of the RF potential, U0 = U −Uend
is the difference between the offset potential on the ring electrode
and the potential on the end cap. The trapping parameters for r is
given by ar = −az/2 and qr = −qz/2
The parameters r0 (the inner radius of the cylinder electrode)
and z0 (the distance from the center of the trap to the end-cap)
are defined for the quadrupole ion trap, with hyperbolic electrodes.
Numerical modelling of the simplified cylindrical geometry of our
trap found effective values of r0 = 9.2 mm and z0 = 8.8 mm to be
appropriate (the physical dimensions of the trap are r1 = 10 mm
and z1 = 9 mm). Using Newton’s law of motion it can be shown
that only ions with certain values of a and q have stable trajectories
inside the trap. Mass selection is achieved by adjusting U and V
such that only ions of the desired m/z have a and q parameters
within the stability region, i.e. at the peak of the stability region.
In Figure 3.8 on the next page a numerical calculation and an
experimentally obtained stability diagram are shown.
To maximise the number of ions stored in the ion trap, ions
are loaded into the trap at a high-acceptance point of the Mathieu
diagram. When all the ions are trapped (at low mass selectivity)
the RF-DC offset is moved into the mass selecting point, this is
illustrated by the green arrow in Figure 3.8(b) on the facing page.
Due to limitations on the RF amplitude two power supplies are
used for mass selection. A 770 kHz RF supply is used for trapping](https://image.slidesharecdn.com/683d4131-560b-40b7-aabd-4b72f336e72f-161214213503/85/Phd-thesis-Jorgen-Houmoller-final-42-320.jpg)


![32 Chapter 3. Experimental Setup - luna
magnitude along the ordinate and
n from Eqns (23) and (24) that a
z
that is, the stability parameters[2q
r
,
ections di†er by a factor of [2.
red in the ion trap provided that their
ble in the r- and z-directions simulta-
ajectory stability is obtained in the
iagram in space for the region of(a
z
, q
z
)
y in both the r- and z-directions near the
dimensional quadrupole ion trap; the iso-b
rhown in the diagram. The intersectsq
z
-axis
at which corresponds to inq
z
¼0.908, q
maxtability mode.
u
u, n
(n ] 1
2
b
u
)), 0 O n O (25)
and
u
u, n
[(n ] 1
2
b
u
)), [O n 0 (26)
where
b
u
B
SAa
u
]
q
u
2
2
B (27)
for and It should be noted that whileq
r
0.2 q
z
0.4.
the fundamental axial secular frequency, is usuallyu
z, 0
,
Figure 8. Trajectory of a trapped ion of m/z 105. The initial posi-
tion was selected randomly from a population with an initial
gaussian distribution (FWHM of 1 mm); zero initialq
z
¼0.3;
velocity. The projection on to the x–y plane illustrates planar
motion in three-dimensional space. The trajectory develops a
shape which resembles a flattened boomerang. Taken from Ref.
14.
y & Sons, Ltd. JOURNAL OF MASS SPECTROMETRY, VOL. 32, 351È369 (1997)
(a)
AN INTRODUCTION TO QUADRUPOLE ION TRAP MA
Figure 9. Pure quadrupole field, or potential surface, for a quad-
rupole ion trap. Note the four poles of the surface and the simi-
larity of the field shape to the trajectory in Fig. 8.
given in units of hertz in the literature and referred to
simply as it should be given in rad s~1. At this time,u
z
,
the higher order frequencies are of little practical signiÐ-
cance.
It should be noted further that the deÐnition of b
z
given in Eqn (27) is only an approximation, known as
the Dehmelt approximation after Hans Dehmelt, who
shared the 1989 Nobel Prize in Physics along with
Norman Ramsey and Wolfgang Paul; is deÐned pre-b
ucisely by a continued fraction expression in terms of a
u
and q
u
:
b
u
2 a
u
]
q
u
2
(b
u
] 2)2 [ a
u
[
q
u
2
(b
u
] 4)4 [ a
u
[
q
u
2
(b
u
] 6)2 [ a
u
[ É É É
]
q
u
2
(b
u
[ 2)2 [ a
u
[
q
u
2
(b
u
[ 4)2 [ a
u
[
q
u
2
(b
u
[ 6)2 [ a
u
[ É É É
(28)
The resemblance of the simulated ion trajectory
shown in Fig. 8 to a roller-coaster ride is due to the
motion of an ion on the potential surface shown in Fig.
9. The oscillatory motion of the ion results from the
undulations of the potential surface which can be envis-
aged as rotation of the potential surface. The simulation
of the ion trajectory was carried out using the ITSIM
simulation program,15 while the potential surface was
generated16 from Eqn (22) by calculating for/
r, zand all of the other coefficients equal to zeroC
2
0 1
for increment steps of 1 mm in both the radial and axial
directions.
RESONANT EXCITATION
As the motion of ions conÐned in a quadrupole ion trap
is characterized by two secular frequencies, axial and
radial, ion motion can be excited upon resonant irradia-
tion at either or both of these frequencies. Such irradia-
tion can be e†ected by applying a small supplementary
oscillating potential of a few hundred millivolts across
the end-cap electrodes, that is, in dipolar mode. Reso-
nant excitation, using the axial secular frequencies of
conÐned ions, has become a powerful technique in
quadrupole i
utilization of
speciÐed freq
nant excitatio
lisionally to
under the inÑ
atoms. This p
ion kinetic e
sponding to
eV. Ion excu
less than 1 mm
Resonant e
ence of a su
axial secular
an amplitude
those ions to
that they ex
process of ion
The ions are
such that the
electronvolts.
Resonant e
To remove u
isolate a nar
case, waveba
end-cap elect
simultaneous
range of ma
trap. (ii) To in
endothermic
ion kinetic e
ions throug
helium atoms
resonant exc
collision-indu
energy so as t
where an im
permits the
measurement
(v) To increa
escape from t
mode can be
ion isolation,
applied frequ
amplitude V
up. This mod
conjunction w
resonance wit
their trajector
low mass/cha
inÑuences of
detected with
the resonant
drive frequen
quencies has
normal mass
CALCULAT
On many oc
ion trap, it b
ion trapping
( 1997 by John Wiley & Sons, Ltd. JOURNAL OF M
(b)
Figure 3.10: (a) Trajectory of a single trapped ion with initial
position randomly selected and with no initial velocity. Taken from ref
[61]. (b) Pure quadrupole potential surface for quadrupole ion trap.
Taken from ref. [60].
where Ω is the RF angular frequency and βu is a number between
0 and 1, and is given by the simple formula
βu = au +
q2
u
2
1/2
, (3.5)
when qr < 0.2 and qz < 0.4. If this is not the case, β has to be
calculated by a continued fraction expansion[60].
β2
u = au+
q2
u
(βu + 2)2 − au −
q2
u
(βu + 4)4 − au −
q2
u
(βu + 6)2 − au − . . .
+
q2
u
(βu − 2)2 − au −
q2
u
(βu − 4)4 − au −
q2
u
(βu − 6)2 − au − . . .
(3.6)
This expansion can be approximated[62] by](https://image.slidesharecdn.com/683d4131-560b-40b7-aabd-4b72f336e72f-161214213503/85/Phd-thesis-Jorgen-Houmoller-final-46-320.jpg)

![34 Chapter 3. Experimental Setup - luna
0 50 100 150
Frequency [kHz]
0
0.5
1
Relativeintensity
Frequencies to excite
0 50 100 150
Frequency [kHz]
0
50
100
150
Phase[π]
Phase modulation
0 50 100 150
Frequency [kHz]
0
0.5
1
Relativeintensity
Magnitude of complex
0 50 100 150
Frequency [kHz]
-2
0
2
Phase[π]
Phase of complex
0 0.2 0.4 0.6 0.8 1 1.2 1.4
Time (ms)
-2
-1
0
1
2
Arbitraryamplitude[V]
Time series - DAC
0 20 40 60 80 100 120 140 160
Frequency (kHz)
0
0.5
1
Relativeintensity
Figure 3.11: Illustration of a calculated SWIFT pulse. For cal-
culation details, see text. First row: Specified frequency magnitude
and phase for which to calculate the inverse fourier transform. Second
row: Corresponding magnitude and phase of the complex frequencies.
Third row: Inverse fourier transform of the frequency spectrum. Here
matlab’s inverse fast fourier transform algorithm has been used. Fourth
row: Fourier transform of time series zero padded on both sides to
represent the actual output pulse. This illustrates the actual frequency
spectrum of the SWIFT pulse.](https://image.slidesharecdn.com/683d4131-560b-40b7-aabd-4b72f336e72f-161214213503/85/Phd-thesis-Jorgen-Houmoller-final-48-320.jpg)
![3.4.4. SWIFT 35
1. Create frequency and time arrays that fit in resolution and
length to the DAC hardware update rate and buffer. In this
case, the onboard buffer of the DAC card (NI USB-6351 from
National Instruments) has a length of l =4095 and an analog
output rate of f =2.86 MS/s. The arrays can maximum be l
long. The time resolution is 1/f and the frequency resolution
is f/l.
2. Next, the frequency structure has to be defined. This can
be done in a number of different ways, in this example, a
smoothed step function has been used. It can be seen that a
specific frequency is missing in this example (Figure 3.11 on
the preceding page), this corresponds to the frequency of the
specific ion that we want isolated in the trap.
3. A phase modulation needs to be applied to the frequency
spectrum to produce a SWIFT pulse that is not a sharp peak
at time zero. Here a simple quadratic phase modulation rela-
tion is used. For a more rigorous investigation of magnitude
smoothing and phase modulation the reader is referred to ref.
[63] and [64].
4. Create a complex array formed by the magnitude array and
phase array. The complex number should be on the form
ae−ib
where a is the magnitude and b is the phase.
5. When the complex frequency spectrum has been obtained,
use you favourite software to calculate the inverse Fourier
transform, which along with the time array generated in step
1, is the potential time series that needs to be applied to the
end caps of the trap.
When a SWIFT pulse is used for excitation with mass spec-
trometry in mind, there are many different smaller corrections to
the simple step-by-step above[65]. But for our use, this simple way
of doing it should work just fine. For an overview of the applica-
tions and calculations of the SWIFT pulses the review article by
Shenhen Guan and Alan G. Marshall is highly recommended[66].](https://image.slidesharecdn.com/683d4131-560b-40b7-aabd-4b72f336e72f-161214213503/85/Phd-thesis-Jorgen-Houmoller-final-49-320.jpg)

![38 Chapter 3. Experimental Setup - luna
40
50
60
70
80
90
SWIFTCenter[kHz]
400 450 500 550 600 650 700
Emission wavelength [nm]
Figure 3.14: A scan of center frequency of a SWIFT pulse (for further
description, see tekst). Projections are made onto the wavelength axis
and center frequency axis.
emission wavelength (518 nm) compared to the bare Rhodamine
6G (504 nm)[67] is 0.07 eV, which is also what is seen when adding
copper to Rhodamine 6G in solution phase[68]. The interpretation
of the experimental results above clearly requires more work before
drawing an actual conclusion, so the simple observations above
should not be taken as from a well conducted scientific experiment,
but more as a curious observation. It is clear that the mass band,
see Figure 3.15 on the next page, is very broad, even when taking
into account the convolution of the width of the SWIFT band center
frequency, the FWHM is still on the order of 80 amu. The mass
resolution can be further enhanced by adjusting the number of
SWIFT pulses, the peak-peak voltage of the SWIFT pulse, and
so on. Overall the SWIFT technique brings some very interesting
options for the luna setup. Unfortunately it has not yet been used
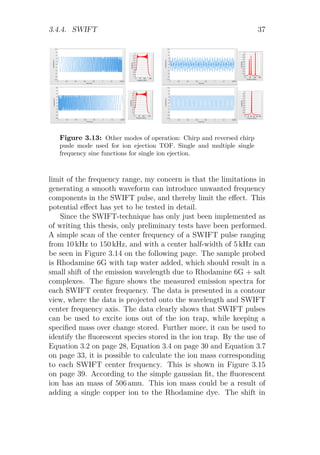
for any real experiments, so the true value of the technique and its](https://image.slidesharecdn.com/683d4131-560b-40b7-aabd-4b72f336e72f-161214213503/85/Phd-thesis-Jorgen-Houmoller-final-52-320.jpg)
![3.5. Data acquisition 39
400 450 500 550 600 650 700
SWIFT Center [amu]
0
50
100
150
200
250
Arb.Signal
Figure 3.15: Showing the data from Figure 3.14 on the preceding
page projected onto the SWIFT center axis, where the SWIFT center
frequency has been transformed to the corresponding ion mass over
charge. For further details, see text.
possibilities for the luna setup has yet to be discovered.
3.5 Data acquisition
As mentioned earlier, one of the greatest advantages of using light
emission to probe the electronic structure of ions, is the simplifi-
cation of the data analysis and interpretation. When analysing
data from sep1, one has to take into account: the PID fragments
and their relative yield - which often can be difficult to determined
correctly; the power dependence for each fragment ion; ion beam
fluctuations, which often are difficult to monitor; the possibility of
having kinetic shifts and the difficulty in modelling non-coherent
multi photon absorption. At luna many of these challenges are
inherently avoided.
Kasha’s rule states that photo emission predominately happens
from the lowest lying electronic state. This means that light emission](https://image.slidesharecdn.com/683d4131-560b-40b7-aabd-4b72f336e72f-161214213503/85/Phd-thesis-Jorgen-Houmoller-final-53-320.jpg)


![3.8. Florescence spectra 43
Figure 3.18: User interface of the trigger software used at luna.
The individual triggers can be enabled, disabled and renamed as needed.
3.8 Florescence spectra
The major downside of luminescence experiments on ions in the
gas phase, is the usually low quantum yield for light emission.
Luminescence has to compete with internal conversion vibrational
relaxation and dissociation which for most ions are much faster than
luminescence. The first fluorescence spectra taken at luna, was of
laser dyes in the Rhodamine family in December 2015 (paper VIII
[69]). The fluorescence yield is close to 100 % for these ions, which
makes them optimal systems for testing purposes. The quality of
the spectra seen in Figure 3.19(a) on page 45 obtained at luna, is
comparable to those reported by others[67], which confirm that the
experimental setup is working.
As of July 2016 the ion with the lowest quantum efficiency
for light emission that we have measured at luna, is Nile Blue
(NB) (paper IX [70]) with a quantum efficiency of maybe approx-
imately 10 %[71, 72]. NB has been used as a bio marker in bio-
logical systems[73, 74], and as a benchmark for quantum chemical
calculations[75, 76]. The colour of NB in solution varies greatly
depending on the solvent used, However, the colour does not have
a simple dependence on the polarity of the solvent[76, 77]. The
NB action spectra and emission spectra measured at sep1 and](https://image.slidesharecdn.com/683d4131-560b-40b7-aabd-4b72f336e72f-161214213503/85/Phd-thesis-Jorgen-Houmoller-final-57-320.jpg)
![44 Chapter 3. Experimental Setup - luna
luna are shown in Figure 3.19 on the facing page. The spectra
clearly show the beauty of the florescence experiment compared to
the photo-dissociation action spectroscopy experiment conducted
at sep1. The emission spectrum is much more smooth than the
absorption spectrum, and much simpler to analyse.
There are a couple of reasons why we are able to acquire emission
spectra of low quantum yield gas phase bio molecular ions. The
first, and perhaps must important, is that the solid angle for light
detection in luna is an order of magnitude higher compared to
other systems[53, 58, 67]. Due to the high detection efficiency at
luna, it is possible to use low repetition rate lasers. Low repetition
rate lasers (Hz to kHz) are often tunable over a large wavelength
region. 20 Hz tunable nanosecond lasers are currently used at luna,
but the setup would work equally good with a high repetition rate
or even a continuous wave laser. The lasers currently used at luna
can output from UV to IR, enabling us to probe excitations over a
broad range. The notch filters used at luna are positioned outside
of the vacuum chamber, making is easy to change the filter to
accommodate the specific experiment. Looking to the future, the
modular design on luna enables the addition of a new cooling
section, which would make it possible to study light absorption of
cold ions. Furthermore, adding a drift tube for ion mobility mass
selection would enable us to study light emission from structure
selected ions.](https://image.slidesharecdn.com/683d4131-560b-40b7-aabd-4b72f336e72f-161214213503/85/Phd-thesis-Jorgen-Houmoller-final-58-320.jpg)


![Chapter 4
Experimental Setup - Light
Sources
Since lasers are an essential part of the current experimental setups
in our lab, the laser systems will be described in some detail here.
In addition to the actual lasers, a description of a sum-frequency
generating laser add-on will be described. Currently two laser
systems are installed in the lab. The two lasers are both EKSPLA
Q-switched nanosecond pulsed lasers, where the laser medium is a
Nd:YAG crystal. Together the two lasers span a wavelength region
from 210 nm (UV) to 2300 nm (IR). The two lasers are shown
schematically in Figure 4.1 on the next page. The full details of
laser operation are outside the scope of this thesis, and therefore
only a brief description of the working principal will be given[78].
4.1 Stimulated emission
The laser medium used for the two lasers is Nd:YAG (neodymium-
doped yttrium aluminium garnet) crystals. A simplified energy
diagram of neodymium is illustrated in Figure 4.2. The neodymium
is an effective four level system, where the transitions from the
pumped E4 level to the E3 level and from the E2 level to the E1
are fast and non-radiative, but the transition from E3 to E2 is
slow in comparison. The difference in the lifetimes of the different
47](https://image.slidesharecdn.com/683d4131-560b-40b7-aabd-4b72f336e72f-161214213503/85/Phd-thesis-Jorgen-Houmoller-final-61-320.jpg)
![48 Chapter 4. Experimental Setup - Light Sources
(a)
(b)
Figure 4.1: (a): Laser 1. (b): Laser 2. Both lasers are Q-switched
nanosecond pulsed lasers. They both utilize an OPO for wavelength
tuning. The main difference between the two lasers is that Laser 1 has
two extra second harmonic generating crystals (SH1 and SH2) used to
generate photons in the UV. [Illustrations copied from laser manual]](https://image.slidesharecdn.com/683d4131-560b-40b7-aabd-4b72f336e72f-161214213503/85/Phd-thesis-Jorgen-Houmoller-final-62-320.jpg)

![50 Chapter 4. Experimental Setup - Light Sources
Figure 4.3: Illustration of the laser cavity in the two lasers at SEP1.
[Illustration copied from laser manual]
the next page. When the quality of the cavity is low, the Pockels
Cell acts as a Quarter-wave plate, and the phase of the linearly
polarized light, is changed by π/2 during one round trip. Since the
polarization of the light is turned ninety degrees, the polariser will
now absorb most of the light, and no lasing is achieved. During the
time of low quality, the gain i.e. population inversion, of the system
increases, only limited by spontaneous emission. This high gain is
transferred into a very intense laser pulse when the cavity quality
is raised. This is done by applying a high voltage (approximately
3 kV) to the Pockels Cell, which then acts as a half wave plate,
switching the polarization of the photons by π per cavity round trip.
A change in polarization of π results in an effectively unchanged
polarization, which is then transmitted through the polariser and
reflected of the end mirror. When the photons stay in the cavity,
a cascade of stimulated emitted photons are created after a few
cavity round trips, and a laser pulse is emitted.
4.2 Laser timing
The laser timing needs to be controllable, for the laser to be of
use in a pulsed experiment. The triggering mechanism, for the
specific lasers at sep1, is illustrated in Figure 4.4 on the facing
page. The input trigger pulse is shown in the top frame. When](https://image.slidesharecdn.com/683d4131-560b-40b7-aabd-4b72f336e72f-161214213503/85/Phd-thesis-Jorgen-Houmoller-final-64-320.jpg)
![4.3. Light manipulation 51
IN pulse
Flash lamp pulse
HV pulse
Optical pulse
50 ns
150-250 µs
2.9-3.6 kV
-1 - 1.25 kV
T T1 2 t
0
0
0
0
t
tt
t
Figure 4.4: Laser timing scheme [Illustration from laser manual].
the input trigger voltage is raised, the power supply capacitors
discharge through the flash lamps and closes the Q-switch. When
the input trigger goes low, the Q-switch is opened and a laser pulse
is generated. The length of the trigger pulse determines the amount
of population inversion reached, and thereby influences the output
laser pulse power. By adjusting the width of the trigger signal, the
laser pulse intensity can be varied, but beyond certain values, the
output of the laser becomes unstable. A typical pump duration is
approximately 300 µs.
4.3 Light manipulation
The Nd:YAG fundamental 1064 nm laser pulse is frequency dou-
bled (1064 nm+1064 nm) and tripled (1064 nm+532 nm) in two
non-linear Deuterated potassium dihydrogen phosphate (KD2PO4,
DKDP) crystals resulting in a 355 nm laser pulse. This pulse pumps
an optical parametric oscillator (OPO)[79] to generate tunable light](https://image.slidesharecdn.com/683d4131-560b-40b7-aabd-4b72f336e72f-161214213503/85/Phd-thesis-Jorgen-Houmoller-final-65-320.jpg)


![54 Chapter 4. Experimental Setup - Light Sources
optic axis. Based on the discussion above, by choosing the right
non-linear crystal and calculating the angle for phase matching, it
is possible to generate light of new frequencies.
As mentioned in the begin of this section, the third harmonic
(355 nm) of the fundamental Nd:YAG 1064 nm light is used to pump
an OPO. The specific design of the OPO is based upon the image-
rotating optical parametric oscillator[80], where a high reflecting
355 nm mirror and a image-rotating 180° prism acts as a cavity
for the pump pulse. This technique has been shown to improve
the overall beam quality of the generated signal. The visible light
is generated in two Barium Borate (BBO) crystals. Besides the
obvious doubling of conversion length by using two crystals, it
also eliminates the spatial walk off of only passing a single angled
crystal. The BBO’s generate the effective reverse of sum-frequency
generation, where a single pump frequency is used to generate
two new frequencies, for historic reasons called the signal and the
idler. The signal and the idler is generated with different resulting
polarisations. The signal beam is horizontally polarised and ranges
from 420 nm to 709 nm and the idler beam is vertically polarised
and ranges from 710 nm to 2300 nm, the wanted output is selected
on the basis of their polarisation by rotating a Rochon prism (named
after its inventor Abbé Alexis Marie Rochon 1741-1817). This prism
consists of two birefringent crystal prisms, where the ordinary and
extraordinary rays remain collinear through the first prism, but
upon entering the second prism the extraordinary rays experience a
change in refractive index and is therefore refracted at the interface.
In order to generate UV photons, the signal or the idler can be
frequency doubled again, to generate UV photons in the range
210 nm to 354 nm and 355 nm to 419 nm. The output power in
the different wavelength regions can be seen in Figure 4.5 on the
next page as the red curve. From this curve it is clear that the
low power around 700 nm is going to translate into even less power
around the frequency doubled 355 nm range, which is also evident
by the dip in output power in the figure. In order to circumvent the
use of doubling the low power idler beam to generate UV photons
sum-frequency generation is used yet again in a home build laser
add on, where the visible light from the OPO signal is mixed with
the fundamental YAG frequency to generate UV photons in the](https://image.slidesharecdn.com/683d4131-560b-40b7-aabd-4b72f336e72f-161214213503/85/Phd-thesis-Jorgen-Houmoller-final-68-320.jpg)
![4.4. Sum frequency generator 55
5 4 3 2
Energy [eV]
300 400 500 600 700 800 900 1000
Wavelength [nm]
0
100
200
300
400
x 2
←
x 2
→
(a) (b) (c) (d)
Power[mW]
Figure 4.5: (a,c,d) Output power of the EKSPLA lasers. The third
harmonic 355 nm of the Nd:YAG laser 1064 nm pumps an OPO to
generate visible (c) signal beam and IR (d) idler beam. (a) The light
from the OPO is frequency doubled to produce light in the UV range.
(b) (Blue) The visible light and the fundamental YAG pumps a BBO
crystal to generate the sum-frequency.
range of 301 nm to 425 nm, depicted as the blue line in Figure 4.5.
4.4 Sum frequency generator
The outline of the sum-frequency add on can be seen in Figure 4.6
on the following page. In this add-on a BBO crystal is used for
sum-frequency generation. When the UV light has been generated,
a Pellin Broca prism[81] separates the tree different wavelengths
in space. The Pellin Broca prism is cut in a way that transmits a
specific wavelength perpendicular to the incoming direction when](https://image.slidesharecdn.com/683d4131-560b-40b7-aabd-4b72f336e72f-161214213503/85/Phd-thesis-Jorgen-Houmoller-final-69-320.jpg)


![60 Chapter 5. Results on Nitrophenolates
(a)
(b)
(c)
(d)
Figure 5.2: Illustrating the likeness between the (a) para-
nitrophenolate and the three bio chromophores (b) oxyluciferin, (c)
Green Fluorescent Protein and (d) Photoactive yellow Protein.
systems for larger biomolecules, such as oxyluciferin[82, 83]; the
luminophore responsible for light emission from fireflies, the Green
Fluorescent Protein (GFP) chromophore [6] and the Photoactive
yellow Protein (PYP) chromophore [84]. These three highly in-
teresting chromophores all share the same phenolate motif as the
nitrophenolate isomers, illustrated in Figure 5.2. The overall goal of
studying the nitrophenolates is to gain a fundamental understand-
ing of the photo physical properties of this simple model system,
and how local perturbations from micro solvation effects these prop-
erties. The knowledge gained from this system can then be used
to understand the photo physical properties of more complex bio
chromophores.
Many biochromophores, e.g. oxyluciferin, undergo charge-trans-
fer (CT) transitions upon excitation. In order for a chromophore
to have a charge-transfer transition, one of its components must
have electron donating properties, and another must have electron](https://image.slidesharecdn.com/683d4131-560b-40b7-aabd-4b72f336e72f-161214213503/85/Phd-thesis-Jorgen-Houmoller-final-74-320.jpg)
![61
donor
acceptor
(a) (b)
donor
acceptor
c1 donor + c2 acceptor
c1 donor - c2 acceptor
Figure 5.3: (a) Energy spacing between two non-interaction molecu-
lar orbitals, (b) Energy spacing between two highly mixed molecular
orbitals
acceptor properties. This results in charge being moved from a
donor-orbital of the chromophore to a acceptor-orbital upon exci-
tation. This type of transition usually has a relative low oscillator
strength due to the separation of the donor and acceptor-orbitals,
and the transition is usually found at lower energies than ”normal”
transitions[7]. This lower transition energy can be illustrated on
the basis of the energy spacing between two coupled orbitals. The
transition energy between two non-interaction molecular orbitals,
i.e. a charge-transfer like transition, is just the energy difference
between the two non-interacting orbitals. As soon as the molecular
orbitals start to mix, the spacing between the two new orbitals
becomes larger. This is illustrated in Figure 5.3.
In order to effectively model the charge-transfer transition of
larger bio molecules by our model system, the spacer between the
hydroxy and nitro groups must act to block mixing. As evident
from the resonance structures and calculated HOMO (highest occu-
pied molecular orbital) and LUMO (lowest unoccupied molecular
orbital) in Figure 5.4 on the following page, the ortho and para-
nitrophenolates exhibit a high degree of coupling, i.e. a high degree
of electron delocalisation, between the donor and acceptor groups
of the ions. For the ortho and para isomers, it does not strictly
make sense to talk about donor and accepter groups since the whole](https://image.slidesharecdn.com/683d4131-560b-40b7-aabd-4b72f336e72f-161214213503/85/Phd-thesis-Jorgen-Houmoller-final-75-320.jpg)

![5.1. Bare nitrophenolate ions 63
30 40 50 60 70 80 90 100 110 120 130
m/z
0
0.5
1
(b)
30 40 50 60 70 80 90 100 110 120 130
m/z
0
0.5
1
(c)
Fragmentyield[arb.unit] 0
0.5
1
(a)
C2
HO-
NO2
-
-CO2
-NO
-CO-NO
-NO2
-NO
Figure 5.5: Fragmentation pattern of (a) ortho-nitrophenolate, (b)
meta-nitrophenolate and (c) para-nitrophenolate, excited at a laser
wavelength of 450 nm, 520 nm and 420 nm, respectively. The fragments
are denoted in the top frame, as either the fragment ion or what neutral
species has been lost from the parent ion.
5.1 Bare nitrophenolate ions
To understand the effects of a perturbation environment, it is cru-
cial to know how the bare system behaves. As described earlier,
a number of different measurements has to be done, in order to
get the action spectra. In this chapter, action spectra refer to the
fragmentation action spectra. One needs to know the fragmentation
pattern of the ion, the action spectra associated with the formation
of each fragment and the number of photons required for fragmen-
tation. In the following, meta-nitrophenolate is used to illustrate
the different aspects of the analysis of the experimental data.
The fragmentation pattern of all the bare nitrophenolate anions
can be seen in Figure 5.5. The fragmentation pattern is quite rich
compared to the small size of the nitrophenolates. To get the total
action spectrum, the action spectra for each fragmentation channel
has to be acquired. In order to do that, the power dependence of](https://image.slidesharecdn.com/683d4131-560b-40b7-aabd-4b72f336e72f-161214213503/85/Phd-thesis-Jorgen-Houmoller-final-77-320.jpg)

![5.2. Micro solvated nitrophenolates 65
0
0.5
1 (a)
0
0.5
1 (b)
0.0 0.2 0.4 0.6 0.8 1.0
Relative laser power [arb. unit]
0
0.5
1 (c)
Photoyield[arb.unit]
Figure 5.6: Power dependence measurements for the three most dom-
inant fragments of meta-nitrophenolate. (a) fragment m/z = 46 amu,
(b) fragment m/z = 80 amu and (c) fragment m/z = 108 amu, measured
at laser wavelengths of 510 nm, 520 nm and 550 nm, respectively.
the para isomer.
As before, with the bare ions, the fist experiment to do is to
look at the fragmentation pattern of the water complexes. The
fragmentation patterns can be seen in Figure 5.10 on page 68. The
fragmentation pattern has been reduced to a single fragment: loss
of the water molecule. This and the linear power dependence seen
in Figure 5.11 on page 69 greatly simplifies the analysis of the
experimental data. The binding energy of the water molecule is
on the order of 0.5 eV so after absorbing a 2.5 eV photon, there is
enough excess energy left to ensure a fast dissociation. The fast
dissociation ensures that no kinetic shift is present in the sep1
data. The resulting action spectra can be seen superimposed on
the action spectra for the bare ion in Figure 5.12 on page 70. It
is clearly seen that a single water molecule shifts the absorption
band for all three isomers, but the direction is not constant. In the](https://image.slidesharecdn.com/683d4131-560b-40b7-aabd-4b72f336e72f-161214213503/85/Phd-thesis-Jorgen-Houmoller-final-79-320.jpg)
![66 Chapter 5. Results on Nitrophenolates
2.8 2.6 2.4 2.2 2.0
Energy [eV]
0
0.5
1 (a)
0
0.5
1 (b)
0
0.5
1 (c)
450 500 550 600 650
Wavelength [nm]
0
0.5
1 (d)
Photofragmentyield[arb.unit]
Figure 5.7: Action spectra for each fragmentation channel of the
bare meta-nitrophenolate anion. (a) m/z = 46 amu, (b) m/z = 80 amu,
(c) m/z = 91 amu and (d) m/z = 108 amu. Gaussian fits (red) are
superimposed to help guide the eye.
meta isomer case, where the transition is a ’pure’ CT transition,
we see a blue shift. The blue shift is due to a simple electrostatic
effect. When the charge is moved from the donor to the acceptor
group, the interaction energy between the dipole of the solvent,
and the charge on the ion is reduced. This now less favourable
interaction increases the transition energy. This electrostatic effect
shifts the absorption band more for stronger binding solvents as
can be seen in paper II and in Figure 5.14 on page 72. In the case
of the ortho and para isomers, a small redshift is seen in the action
spectra. This is due to the fact that binding a single water molecule](https://image.slidesharecdn.com/683d4131-560b-40b7-aabd-4b72f336e72f-161214213503/85/Phd-thesis-Jorgen-Houmoller-final-80-320.jpg)
![5.2. Micro solvated nitrophenolates 67
3.5 3.0 2.5 2.0
Energy [eV]
0
0.5
1
(a)
0
0.5
1
(b)
350 400 450 500 550 600 650
Wavelength [nm]
0
0.5
1
(c)
Photofragmentyield[arb.unit]
Figure 5.8: Action spectra of the bare nitrophenolate an-
ions. (a) orho-nitrophenolate, (b) meta-nitrophenolate and (c) para-
nitrophenolate. The data for ortho and para-nitrophenolate were
obtained at the Elisa storage ring facility in Aarhus[85, 86]. Gaussian
fits are superimposed to help guide the eye.
(a) (b) (c)
Figure 5.9: Calculated structures of the micro solvated nitrophe-
nolate isomers (a) ortho, (b) meta and (c) para. For all isomers, the
water molecule binds to the phenolate group.[87]](https://image.slidesharecdn.com/683d4131-560b-40b7-aabd-4b72f336e72f-161214213503/85/Phd-thesis-Jorgen-Houmoller-final-81-320.jpg)
![68 Chapter 5. Results on Nitrophenolates
30 40 50 60 70 80 90 100 110 120 130 140 150
m/z
0
0.5
1
(b)
30 40 50 60 70 80 90 100 110 120 130 140 150
m/z
0
0.5
1
(c)
Fragmentyield[arb.unit]
0
0.5
1
(a)
-H2
O
Figure 5.10: Fragmentation pattern of (a) ortho-nitrophenolate
water complex, (b) meta-nitrophenolate water complex and (c) para-
nitrophenolate water complex, excited at laser wavelengths of 415 nm,
475 nm and 415 nm, respectively. The only fragmentation channel
available is the loss of the solvent molecule.
pulls the charge towards the water, lowering the conjugation. This
effect is illustrated in Figure 5.13 on page 71. The binding of a
solvent molecule effectively makes the electronic transition more
CT like. The now CT-like transition will, as for the meta isomer,
weaken the interaction between the solvent dipole and the ion charge
upon excitation. This weakening will then result in a blue shift in
the transition energy. The relative small red shifts of 0.10 eV and
0.15 eV for the ortho and para isomers respectively, is a result of
both the red and blue shift in transition energy. A summary of the
experimental data on the nitrophenolates can be seen in Table 5.1
on the next page.](https://image.slidesharecdn.com/683d4131-560b-40b7-aabd-4b72f336e72f-161214213503/85/Phd-thesis-Jorgen-Houmoller-final-82-320.jpg)
![5.2. Micro solvated nitrophenolates 69
0
0.5
1 (a)
0
0.5
1 (b)
0.0 0.2 0.4 0.6 0.8 1.0
Relative laser power [arb. unit]
0
0.5
1 (c)
Photoyield[arb.unit]
Figure 5.11: Power dependence measurements for the three nitro-
phenolate water complexes. (a) ortho-nitrophenolate water complex,
(b) meta-nitrophenolate water complex and (c) para-nitrophenolate
water complex, measured at laser wavelengths of 415 nm, 475 nm and
415 nm respectively. All isomers exhibit one photon dependence on the
loss of water.
Table 5.1: Absorption band maximum in nm and eV, and shifts
from the bare ions in ∆eV. A negative ∆eV value corresponds to a red
shifted absorption.
Bare Solvent
Ion nm eV nm eV ∆eV
o-nitrophenolate 399 3.11 a
412 3.01 -0.10
m-nitrophenolate 530 2.38 a
485 2.56 0.22
- - b
485 2.56 0.22
- - c
505 2.46 0.12
p-nitrophenolate 393 3.15 a
413 3.00 -0.15
a
water, b
methanol, c
acetonitrile](https://image.slidesharecdn.com/683d4131-560b-40b7-aabd-4b72f336e72f-161214213503/85/Phd-thesis-Jorgen-Houmoller-final-83-320.jpg)
![70 Chapter 5. Results on Nitrophenolates
3.5 3.0 2.5 2.0
Energy [eV]
0
0.5
1
(a)
0
0.5
1
(b)
350 400 450 500 550 600 650
Wavelength [nm]
0
0.5
1
(c)
Photofragmentyield[arb.unit]
Figure 5.12: Action spectra for the water complexes (blue hol-
low circles, and broken line) of (a) ortho-nitrophenolate, (b) meta-
nitrophenolate and (c) para-nitrophenolate. The action spectra of the
bare isomers are superimposed (red full circles, full line). Gaussian fits
are likewise superimposed to help guide the eye.](https://image.slidesharecdn.com/683d4131-560b-40b7-aabd-4b72f336e72f-161214213503/85/Phd-thesis-Jorgen-Houmoller-final-84-320.jpg)

![72 Chapter 5. Results on Nitrophenolates
3.5 3.0 2.5 2.0
Energy [eV]
0
0.5
1 (a)
0
0.5
1 (b)
0
0.5
1 (c)
350 400 450 500 550 600 650
Wavelength [nm]
0
0.5
1 (d)
Photofragmentyield[arb.unit]
Figure 5.14: Action spectra for the (a) bare meta-nitrophenolate,
and complexes with a single (b) acetonitrile, (c) water and (d) methanol
molecule. The calculated binding energies increase downward. The
binding energies are 0.50 eV, 0.54 eV and 0.65 eV for the acetonitrile,
water and methanol complexes respectively. Gaussian fits are superim-
posed to help guide the eye.](https://image.slidesharecdn.com/683d4131-560b-40b7-aabd-4b72f336e72f-161214213503/85/Phd-thesis-Jorgen-Houmoller-final-86-320.jpg)
![Chapter 6
Other systems
In this chapter I will use the results from the previous chapter, and
illustrate how these can be used to interpret the experimental results
for other, more complex, systems. The systems that will be covered
are oxyluciferin, permanganate, p-benzoquinone anion, Ru(bipy)3
2+
and protonated adenine, protonated thymine and protonated uracil.
The structures of said ions, and the nitrophenolates, can be seen
in Figure 6.1 on the following page. The details of each individual
study can be found in the corresponding papers cited for each
experiment, and only brief introductions and discussions will be
presented here.
6.1 Oxyluciferin
Oxyluciferin is the luminophore responsible for light emission from
fireflies. Oxyluciferin is furthermore also the luminophore responsi-
ble for light emission from various forms of click beetles and railroad
worms, but here the light emitted is of different colors than seen
in the fireflies. In nature, oxyluciferin is chemically excited[88, 89]
into the first excited state. Light is then emitted by returning
to the ground state. The transition has been calculated to be a
charge-transfer like transition[90, 91]. An interesting question is
how is the color of the emitted light from oxyluciferin tuned? It has
been proposed[92] that a single water molecule inside the luciferase
protein could have a profound effect on the photophysical proper-
73](https://image.slidesharecdn.com/683d4131-560b-40b7-aabd-4b72f336e72f-161214213503/85/Phd-thesis-Jorgen-Houmoller-final-87-320.jpg)

![6.1. Oxyluciferin 75
(a) (b)
Figure 6.2: Structure of (a) oxyluciferin and (b) oxyluciferin-water
complex. The water molecule binds to the phenolate group. Carbon
atoms are grey, oxygen red, sulfur yellow, nitrogen blue and hydrogen
white.[96]
ties of the oxyluciferin chromophore. In order to investigate this
proposal, the effect of the local environment has been the focus of
a few theoretical studies, where micro solvation was found to give
a small red or blue shift, dependent on the solvent location[93–95].
However, the calculated shifts has only been on the order of 5 nm,
which is not nearly enough to explain the diverse colors found in
nature. In order to establish the actual effect of micro solvation,
we have studied the intrinsic light absorbing properties of the bare
oxyluciferin anion and the properties of the oxyluciferin-water com-
plex (paper IV [96]). The calculated structures of both the bare
ion and the solvent complex can be seen in Figure 6.2.
The experimental approach is exactly the same as for the nitro-
phenolate isomers, described in the previous chapter. The action
spectra for the bare ion and water complex can be seen in Figure 6.3
on the following page. A very clear blue shift in the absorption
spectra is seen upon micro solvation. The shift is 0.23 eV, which
is approximately the same shift seen in the meta-nitrophenolate
case, and much the same conclusions can be drawn. The water
molecule binds to the phenolate-group, and when change is moved
away from this group upon excitation, the ion-dipole interaction is
weakened. This weakening of the ion-dipole interaction increased
the transition energy and a blue shift is observed. This strong
shift due to micro solvation indicates that the transition is indeed
a CT-like transition. And that the local environment can have a
huge effect on the transition energies of oxyluciferin.](https://image.slidesharecdn.com/683d4131-560b-40b7-aabd-4b72f336e72f-161214213503/85/Phd-thesis-Jorgen-Houmoller-final-89-320.jpg)
![76 Chapter 6. Other systems
2.9 2.8 2.7 2.6 2.5 2.4 2.3 2.2 2.1 2.0
Energy [eV]
450 500 550 600 650
Wavelength [nm]
0
0.5
1
Photofragmentyield[arb.unit]
Figure 6.3: Action spectra of (red solid) oxyluciferin and (blue
hollow) oxyluciferin-water complex. Gaussian fits are superimposed to
help guide the eye.
The data presented here provide information on the absorption
by the ions, and not light emission which is the actual interesting
property. But given the fact that a single water molecule can
shift the color of the light absorbed by 50 nm, it is clear that
perturbations from the local environment should be able to change
the wavelength of emitted light also. The ideal experiment for
looking at shifts in light emission is clearly to study the actual light
emitted from this ion, but that has not yet been accomplished in
the gas phase.
6.2 Permanganate
Permanganate is not a biomolecule, but it is still an interesting ion
to study, due to its popularity as a oxidising agent. The absorption
spectrum was first measured in detail by Holt and Ballhausen in
1967[97]. Since then permanganate has been used as a benchmark](https://image.slidesharecdn.com/683d4131-560b-40b7-aabd-4b72f336e72f-161214213503/85/Phd-thesis-Jorgen-Houmoller-final-90-320.jpg)
![6.3. p-Benzoquinone 77
system for theoretical models[98–101]. Permanganate is very differ-
ent from the previously mentioned ions, simply due to the fact that
permanganate does not have a dipole moment, it is highly symmet-
rical. One of the interesting properties of the electronic structure
of permanganate, is that upon electronic excitation, the geometry
changes to a lower symmetry due to Jahn-Teller distortion[102, 103].
But what is of most interest for the work presented in this thesis is
the investigation of the effect on the electronic structure of binding
a solvent molecule to a completely symmetrical charge distribution.
It is clear that the electron delocalisation must be greatly affected
by binding a solvent molecule. This is going to localise the charge,
wherever the binding occurs. Drawing upon the conclusions from
the nitrophenolate study, a couple of things can happen. The fact
that the charge is going to be more localised, would result in a
more CT like transition, which would result in a red shift of the
absorption band. The now CT like transition is going to be effected
by the electrostatic cost of moving charge away from the solvent
molecule, which would result in a blue shift in the absorption band.
The question then is, which effect is going to impact the electronic
energy levels the most? The absorption data are shown in Figure 6.4
on the next page. A small blue shift, of 12 meV is observed, which
must be the result of the two perturbing effects almost cancelling
each other. It is very peculiar that, what must be a big effect on
the electronic structure has such a small effect on the electronic
energy spacing.
6.3 p-Benzoquinone
Quinones are a central component of the transfer of charge in
the photosynthesis system [104]. In the photosynthesis system,
the quinones transfer electrons in a near resonant electron trans-
fer transition, it is therefore important that the electronic levels
of the quionone are constant for the transfer to be efficient[105].
p-benzoquinone is a central moiety that accounts for the electron-
accepting part of the quinones found the the photosynthesis-system,
and has therefore been of great interest[106–111]. The effect
of micro solvation was studied by Mark H. Stockett and Steen](https://image.slidesharecdn.com/683d4131-560b-40b7-aabd-4b72f336e72f-161214213503/85/Phd-thesis-Jorgen-Houmoller-final-91-320.jpg)
![78 Chapter 6. Other systems
2.7 2.6 2.5 2.4 2.3 2.2 2.1 2.0
Energy [eV]
0
0.5
1
(a)
0
0.5
1
(b)
450 475 500 525 550 575 600 625 650
Wavelength [nm]
0
0.5
1
(c)
Photofragmentyield[arb.unit]
Figure 6.4: Action spectra of (a) bare permanganate anion, (b)
permanganate-water complex and (c) a replot of the two superimposed
ten point averages, where the red solid line is the bare ion and the
blue broken line is the water complex. The peaks in the action spectra
corresponds to vibrational fine structure due to a vibronic coupling to
the Mn−O stretching mode of 740 cm−1
and 725 cm−1
for the bare ion
and water complex, respectively.](https://image.slidesharecdn.com/683d4131-560b-40b7-aabd-4b72f336e72f-161214213503/85/Phd-thesis-Jorgen-Houmoller-final-92-320.jpg)
![6.3. p-Benzoquinone 79
Brøndsted Nielsen [112], by looking at the action spectra of the
bare p-benzoquinone and the p-benzoquinone-water complex. Like
permanganate, p-benzoquinone has no permanent dipole moment
and has a very high degree of symmetry. Like permanganate,
the symmetry of the electronic conjugation must be lowered by
attaching a water molecule.
Unlike the other ions presented in this thesis, p-benzoquinone
does not fragment after laser excitation. After photo excitation an
electron is emitted, either as direct photodetachment or delayed
thermionic emission from a hot ground state. It is not possible to
measure electrons at sep1, and at the time of the p-benzoquinone
experiment it was only possible to measure charged fragments.
In order to measure the action spectrum of p-benzoquinone, the
depletion signal was monitored as a function of wavelength. This
is done by monitoring the depletion of the parent ion signal after
photo excitation. In the case of the water complex, it was possible
to monitor the water loss channel, but these data are not shown here
since the water loss only corresponds to approximately one percent
of the overall action. The depletion spectra for two transitions in
p-benzoquinone and the water complex can be seen in Figure 6.5
on the following page. After the installation of the new detector
at sep1, it has been possible to measure the neutrals formed after
electron detachment. This has made it possible to measure the
action spectra on the UV side of the lowest transition. These data
are shown in Figure 6.6 on page 81 from 380 nm to 600 nm.
Just as was seen for permanganate, the effect of a single water
molecule on the separation of the electronic levels is minimum. For
p-benzoquinone there actually seems to be no measurable shift
between the absorption spectra of the bare ion and of the water
complex. Again, as for permanganate, the two opposing effects
must cancel each other. The robustness of the transition energies
of p-benzoquinone under perturbations from the local environment
makes the quinone an ideal electron acceptor - which is just what
is needed in the nature.](https://image.slidesharecdn.com/683d4131-560b-40b7-aabd-4b72f336e72f-161214213503/85/Phd-thesis-Jorgen-Houmoller-final-93-320.jpg)
![80 Chapter 6. Other systems
NormalizedAction
0
0.2
0.4
0.6
0.8
1
1.2
Wavelength (nm)
280 300 320 340
Photon Energy (eV)
4.4 4.2 4 3.8
pBQ-
pBQ-
+ H2O
(a)
NormalizedAction
0.0
0.2
0.4
0.6
0.8
1.0
1.2
Wavelength (nm)
450 500 550 600
Photon Energy (eV)
3 2.8 2.6 2.4 2.2
pBQ-
pBQ-
+ H2O
(b)
Figure 6.5: Depletion spectra of p-benzoquinone (open black circles)
and the water complex (filled red squares) for two different transitions.
(a) First transition, solid line is a 5 point moving average, (b) Second
transition, solid line is 3 point moving average. For further details see
text and ref [112].](https://image.slidesharecdn.com/683d4131-560b-40b7-aabd-4b72f336e72f-161214213503/85/Phd-thesis-Jorgen-Houmoller-final-94-320.jpg)
![6.4. Tris(bipyridine)ruthenium(II) 81
4.4 4.2 4.0 3.8 3.6 3.4 3.2 3.0 2.8 2.6 2.4 2.2
Energy [eV]
300 350 400 450 500 550 600
Wavelength [nm]
0
0.5
1
ActionYield[arb.unit]
Figure 6.6: Action spectra of the bare p-benzoquinone anion (red
solid) and p-benzoquinone water complex (blue hollow). The high
energy transition is depletion data from[112], the low energy transition
is new data acquired using the SED detector at sep1. A gaussian fit is
shown for both transitions in the bare ion to help guide the eye. 4 point
moving averages are superimposed on the water complex data. The
two transitions are normalised to the data measured in an Ar matrix
by Piech et al. [113] (not shown).
6.4 Tris(bipyridine)ruthenium(II)
The transition in Tris(bipyridine)ruthenium(II), (Ru(bipy)3
2+
), is
a textbook example of a metal-to-ligand charge transfer transition
[114–116]. The ground state of the dication is a singlet with the
HOMO located on the center rubidium, while the LUMO is located
on the ligands[117]. The transition of the Ru(bipy)3
2+
lies in the
visible range, and has made the ion interesting in regards to light-
harvesting for artificial photosynthesis[118, 119]. In the study by
Mark H. Stockett and Steen Brøndsted Nielsen[120], the shift in
transition energy when going from the bare Ru(bipy)3
2+
ion to the
Ru(bipy)3
2+
+ acetonitrile complex was investigated using action
spectroscopy. Ru(bipy)3
2+
, like permanganate and p-benzoquinone,
is highly symmetrical and has no permanent dipole. The absorp-
tion spectra (Figure 6.7 on the following page) show, just like for
permanganate and p-benzoquinone, no significant shift in transition](https://image.slidesharecdn.com/683d4131-560b-40b7-aabd-4b72f336e72f-161214213503/85/Phd-thesis-Jorgen-Houmoller-final-95-320.jpg)
![82 Chapter 6. Other systems
Figure 6.7: Action spectra of Ru(bipy)3
2+
. The red line is dissocia-
tion action spectra for the bare ion, the open circles and the solid black
line is data and 10-point running average of the acetonitrile complex.
The black arrows indicate maxima in the low energy tail corresponding
to 1250 ± 250 cm−1
. Absorption band maximum measured at the elec-
tronic storage ring Elisa is added as the light gray bar. The blue line
is the absorption by Ru(bipy)3
2+
in bulk acetonitrile solution. Figure
from [120].
energy upon micro solvation. In order to really establish the band
maxima it would be relevant to measure the action below 420 nm.
6.5 Protonated nucleobases
In order for life to have evolved beyond the prebiotic era (4 billion
years ago[121]), where no protective stratosheric ozone layer was
present, the photo stability of DNA and RNA was crucial. It is the
nucleobases (adenine, thymine, cytosine, guanine and uracil) that
are responsible for UV light absorption, so the general interest in
the photo physical properties of the nucleobases is no surprise[122–
129]. In the two papers by Sara Øvad Pedersen et al. [130, 131]
protonated thymine, protonated Adenine and protonated uracil
bare ions and single-water complexes were studied using action](https://image.slidesharecdn.com/683d4131-560b-40b7-aabd-4b72f336e72f-161214213503/85/Phd-thesis-Jorgen-Houmoller-final-96-320.jpg)
![6.5. Protonated nucleobases 83
spectroscopy. The action spectra of protonated adenine (Figure 6.8
on the next page) shows no shift in transition energy upon micro
solvation. This would indicate that the positive charge is delocalised
over the whole ion. Surprisingly, no shift in transition energy is
seen between the bare nucleobase and the fully solvated one either,
which again shows that the transition is not at all affected by the
surrounding micro environment. In the case of protonated thymine
and protonated uracil, the action spectra become a little more
complicated. Based on calculations, two tautomers are present in
the ion beam. For both protonated thymine and protonated uracil,
the two tautomers present are called 138+
and 178+
, where the
nomenclature indicates the protonation on the ring position and
oxygen atom and was first introduced in ref. [132] and kept here for
the sake of consistency. The tautomers can be seen in Figure 6.9
on the following page, along with their calculated percentage in the
ion beam and calculated absorption band maximums. According to
calculations the two tautomers are responsible for light absorption
at two different wavelengths. The 138+
tautomer absorbs light
at approximately 300 nm and the 178+
tautomer absorbs light at
approximately 250 nm.
In the protonated thymine spectrum, Figure 6.10(a) on page 85,
only one absorption band (178+
tautomer) is seen for the bare
nucleobase, which fits nicely with the calculated percentage of the
138+
tautomer of only up to 4 %. This band is not affected by the
addition of a single water molecule, indicating a fully delocalised
charge distribution on this tautomer. By adding a water molecule,
the relative importance of the 138+
tautomer seems to be enhanced,
based on the small absorption band seen for the water complex at
305 nm. It is unfortunately not possible to measure a shift in this
transition due to the low signal for the bare ion at this wavelength.
It would be interesting to go back and do the Thymine experiment
again, this time with focus on measuring the 138+
tautomer signal
for the bare ion.
In protonated uracil, two bands are seen in the absorption spec-
trum, Figure 6.10(b) on page 85. These two bands corresponds
to both tautomers being present in the ion beam. Again, as for
protonated thymine, the addition of a water molecule does not shift
the absorption band for the 178+
tautomer. Again this indicates a](https://image.slidesharecdn.com/683d4131-560b-40b7-aabd-4b72f336e72f-161214213503/85/Phd-thesis-Jorgen-Houmoller-final-97-320.jpg)
![84 Chapter 6. Other systems
Figure 6.8: Action spectra of the protonated adenine (hollow blue
circles) and water complex (full black circles). The absorption spectra
for fully solvated Adenine is superimposed as the solid green line.
Furthermore the action spectra of protonated AMP is added (hollow
red diamonds), but has no interest for the study presented in this thesis.
Figure from [131].
+HN
N
H
OH
O
N
N
H
+
OH
HO
+HN
N
H
OH
O
N
N
H
+
OH
HO
138+
178+
138+
178+
protonated uracilprotonated thymine
Tautomer
Beam% 1 - 23% 77 - 99%0 - 4% 96 - 100%
Abs. Band max 225 nm 271 nm236 nm 283 nm
Figure 6.9: Illustrating the two tautomers of Thymine and Uracil,
and their calculated percentage of the ion beam at sep1 and calculated
mean absorption band maximum. All values from [130].](https://image.slidesharecdn.com/683d4131-560b-40b7-aabd-4b72f336e72f-161214213503/85/Phd-thesis-Jorgen-Houmoller-final-98-320.jpg)
![6.5. Protonated nucleobases 85
ons increased linearly with the
Supporting Information), and
ed to the absorption of one
ons to the electrostatic analyzer
10 μs, which is the maximum
monitor dissociation. The time
one-photon absorption is likely
ions were identified for the
) water complexes correspond-
H3, and H2O and HNCO. Again
ced after the absorption of one
pendence measurements.
esent the results for protonated
Figure 3 shows the photofrag-
n wavelength for ThyH+
. At 260
fragment ions with m/z 56, 84,
%; these were established within
omplications from ion-beam
three spectra are quite similar
the lowest mass ion increases
l three cases, there is clear
about 280 nm. However, very
ove 300 nm as is evident from
s obtained with “laser on” and
(Supporting Information). The
cay of metastable parent ions or
etween parent ions and residual
t that the difference signal is
length of the ion bunch profile
is absorbed.
ctra (Si(λ)) were combined
tance of each fragment ion (i)
at 260 nm (Fi(260 nm)) to give the total action spectrum
(Figure 4),
∑λ λ= S F Stotal spectrum ( ) ( ) (260nm)/ (260nm)
i
i i i
Figure 4. Action spectra of ThyH+
and ThyH+
(H2O) obtained after
summing the yields from all dissociation channels. The absorption
spectrum of thymine in an acidic aqueous solution is also included for
comparison. The bars are TD-DFT-calculated vertical excitation
energies; (□) ThyH+
and (■) ThyH+
(H2O).
dx.doi.org/10.1021/jp504153p | J. Phys. Chem. A 2014, 118, 4256−42654258
(a)
This spectrum is taken to represent the absorption spectrum of
bare ThyH+
. We will return to band assignments after
presenting the theoretical results.
The action spectra for ThyH+
(H2O) are shown in the
Supporting Information for the three dominant fragment ions.
All spectra reveal absorption between 210 and 280 nm, and for
water loss also in the region 280 to 335 nm. This is also evident
from the ThyH+
fragment ion bunch profiles (Supporting
Information), as there are more ion counts when the laser is on
than when it is off in the 300−310 nm region. The importance
of the lowest mass ion increases with excitation energy. At 260
nm the percentages of the three fragment ions are 13.5% (m/z
84), 33% (m/z 110), and 53.5% (m/z 127). Based on these
percentages and the three individual action spectra, we
calculated the total action spectrum (Figure 4). This spectrum
is nearly identical to that of the bare ion in the region from 210
to 280 nm. However, at higher wavelengths the monohydrated
ions show clear absorption.
Next we consider the results for protonated uracil and its
water complexes. The action spectra for the bare ions are
shown in Supporting Information. Absorption between 210 and
265 nm is seen in all four spectra, and absorption at higher
wavelengths for the two high-mass fragment ions. Again the
low-mass fragment ion is formed most easily at the lowest
wavelengths. At 250 nm, the percentages of the fragment ions
are 6% (m/z 18), 13% (m/z 43), 53% (m/z 70), and 28% (m/z
96). The spectra were combined according to these percentages
to give the total action spectrum (Figure 5).
Finally, we present the action spectra for UraH+
(H2O)
(Supporting Information). They are quite different with
absorption spanning over a broad range from 210 to 330 nm.
The percentages at 285 nm are 43.5% (m/z 70), 26.5% (m/z
96), and 30% (m/z 113). Again combining the spectra provides
the total action spectrum (Figure 5).
Theoretical Calculations. Excited state calculations were
carried out at three levels of theory. The excitation energies
obtained by TD-DFT methods closely bracketed those from
the more computationally demand
For example, the dipole allowed S0
thymine had the resonant wavelengt
from B3LYP, M06-2X, and EOM-C
tively. A similar trend in the calcula
the ionic systems (Tables 1−3), ind
expensive TD-DFT methods ca
calculations of electronic excita
nucleobase systems.
Computational results for bare pr
summarized in Table 1 including th
the two most stable tautomers
nomenclature indicating the proton
N-1 and N-3 and oxygen atoms O-7
ref 20 and is kept here for the sake o
ion should be predominantly the th1
with previous work;21
th138 contrib
ent on the theoretical method) to
assuming equilibrium conditions at
assume thermal equilibrium to hav
octopole ion trap in our experime
collisional heating that may occur d
trap and during acceleration to
experimental spectrum shows prac
maximum at ca. 250−265 nm, while
237, 248, and 235 nm (corrected
B3LYP, and M06-2X, respectively)
Very weak absorption was ident
agreement with th138 absorbing to
Theory predicts absorption values of
nm for th138 from the three model
The position of the absorption
wavelength of the resonant vertical tr
basis of a detailed dynamic anal
workers.40
These authors reported a
0.15 eV in the absorption maxima, w
the excitation energies calculated fo
water clusters.
According to the EOM-CCSD c
maximum below 210 nm is ascri
second excited state of a predicted a
nm. While the calculated oscillator st
the TD-DFT calculations gave a val
Calculations of protonated thymin
attached predict several isomers/tau
th178w7 dominating (Table 2). Th
th178w7, w1, and w8 are very sim
water molecule position has only a s
transition wavelength is close to t
experimental absorption spectrum
wavelength isomer th138w8 (calcula
as a weak band at ca. 300−310
spectrum. It is noteworthy that the
tautomer increases after water attach
6% or 2% of the population, from e
which is again in accordance with ex
is clearly evident for the water com
At a gas-phase equilibrium, proton
have a major tautomer (u178) and a
3) in agreement with earlier work.
those found for ThyH+
but with a
Thus, at room temperature, u138 co
population (the range is based on di
Figure 5. Action spectra of UraH+
and UraH+
(H2O) obtained after
summing the yields from all dissociation channels. The absorption
spectrum of uracil in an acidic aqueous solution is also included for
comparison. The bars are TD-DFT-calculated vertical excitation
energies; (□) UraH+
and (■) UraH+
(H2O).
dx.doi.org/10.1021/jp504153p4259
(b)
Figure 6.10: Action spectra of (a) protonated thymine and (b)
protonated uracil bare ions (hollow) and water complexes(solid). The
absorption spectra for fully solvated species are superimposed as the
solid black lines. The bars on top illustrates the TD-DFT calculated
vertical excitation energies. Figures from ref [130].](https://image.slidesharecdn.com/683d4131-560b-40b7-aabd-4b72f336e72f-161214213503/85/Phd-thesis-Jorgen-Houmoller-final-99-320.jpg)

![6.6. Summary of experimental results 87
o-nitrophenolate
m-nitrophenolate
oxyluciferin
p-nitrophenolate
protonatedadenine
protonatedthymine
permanganate
p-benzoquinone
Ru(bipy)3
Permanent dipole No dipoleTransitionenergyshift
2+
protonateduracil138+
protonateduracil178+
full conjugationcharge-transfer
Figure 6.12: Summarising the experimental results of micro sol-
vation experiments. Oxyluciferin, meta-nitrophenolate and the 138+
tautomer of protonated uracil has a transition with a high degree of
charge-transfer, resulting in a blue shift upon micro solvation. or-
tho-nitrophenolate and para-nitrophenolate show a red shift, due to
superposition of a more CT-like transition and hence also electrostatic
effect upon micro solvation. Protonated adenine, protonated thymine
and the 178+
tautomer of protonated uracil show no shift in transition
energy upon micro solvation. No shift is seen for any of the ions with
no permanent dipole: p-benzoquinone or Ru(bipy)3
2+
, and only a very
small blue shift is seen for permanganate.
6.6 Summary of experimental results
All the experimental data currently available on the effect of micro
solvation on the electronic transitions studied at sep1 are sum-
marised in Table 6.1 and Figure 6.12.
Judging from the data, micro solvation has almost no effect
on the highly symmetrical no permanent dipole ions. These ions
have shown to be very robust in terms of electronic transition
energies regardless of perturbations from the local environment.
This category of ions could be used in molecular electronics if
robustness of the electronic transition energy is desired[133], as in
the case of e.g. the quinones in photosynthesis. In contrast, if color
modulation by the perturbations from the local environment is](https://image.slidesharecdn.com/683d4131-560b-40b7-aabd-4b72f336e72f-161214213503/85/Phd-thesis-Jorgen-Houmoller-final-101-320.jpg)


![Chapter 7
Outlook
The data presented in this thesis for the study of the effect on the
transition energy by micro solvation, has come about due to many
different projects on many vastly different ions. In order to pinpoint
e.g. the potential maximum effect of micro solvation on a charge-
transfer transition, or the effect of a much stronger binding solvent
on a fully symmetrical charge distribution, a more rigorous approach
could be taken than the one presented here. The more controlled
approach would be to have some model systems, like the ones shown
in this thesis, and have them subjected to a larger range of solvent
molecules, with varying polarisability and dipole moment. In order
to get any meaningful observations from such a study, the complexes
might need to be cooled down in order to pinpoint the absorption
band maximum with high accuracy[134, 135]. This cooling of the
ion-complexes would enable the detection of much smaller shifts in
transition energy. Cooling of the ions might also make it possible
to study the effect of two or more solvent molecules attached. This
has not previously been possible at sep1, which may be due to the
place of complex formation. At sep1 the solvent complexes are
formed in an octopole. If the complexes were instead formed in
the multipole ion trap, the potential of the trapping field would be
more flat near the center. This flat trapping potential would result
in fewer accelerated collisions, and might lead to formation of larger
solvated ions. This would shed light upon not only the first step
in ion solvation, but also the steps in between bare ion and fully
91](https://image.slidesharecdn.com/683d4131-560b-40b7-aabd-4b72f336e72f-161214213503/85/Phd-thesis-Jorgen-Houmoller-final-105-320.jpg)
![92 Chapter 7. Outlook
solvated. On that note, for the meta-nitrophenolate-acetonitrile
and protonated uracil-water complexes, a single solvent molecule
was seen to shift the absorption almost half the way to the fully
solvated species. This observation naturally raises the question of
how many solvent molecules are actually needed for a species to be
fully solvated? Another curios result presented in this thesis is the
fact that there is no shift in absorption band maximum upon micro
solvation for the symmetrical ions p-benzoquinone and Ru(bipy)3
2+
.
It would be interesting to study this result on a wider variety of
solvent molecules to see, if the two opposing effects always will
result in a zero shift.
In the case of oxyluciferin, it would be very exciting to study
the fluorescence instead of the absorption. This experiment has
already begun by the building of the luna setup. To be able
to see fluorescence from oxyluciferin, the ion needs to be cooled
down in order for fluorescence to compete with internal conversion.
This requires modifications to the current luna setup, as cooling
has not yet been implemented. There are a few ways such a
cooling could be implemented. The simple, fastest and cheapest
way is to modify the current setup and add a small liquid nitrogen
reservoir, which either touch the Paul trap, or cool the helium buffer
gas[136]. This would, if mounted and screened correctly result in
ion temperatures of around 100 K. Another, more expensive but
also more effective cooling mechanism is cryo cooling, where ions
can reach temperatures of a few kelvin[137]. This setup requires
a whole new vacuum section at luna, with multiple turbo pumps
and ion transmission components. No matter which method is used,
the ability to study fluorescence from cold molecular ions would
open up new exciting experiments. These experiments will be based
on luminescence from cold ions, which will remove many of the
experimental uncertainties. In addition to cooling the ions at luna,
the possibility of selecting individual isomers based on their 3D
structure by the use of Ion Mobility Mass Spectrometry[138–140]
would open up whole new world of exciting projects, where we
would have total control over the isomers in the ion beam.
In short, the future seems bright and cold!](https://image.slidesharecdn.com/683d4131-560b-40b7-aabd-4b72f336e72f-161214213503/85/Phd-thesis-Jorgen-Houmoller-final-106-320.jpg)


![Bibliography
[1] V. Yatsyna, D. J. Bakker, P. Salén, R. Feifel, A. M. Rijs, and V. Zhauner-
chyk. Infrared Action Spectroscopy of Low-Temperature Neutral Gas-
Phase Molecules of Arbitrary Structure. Phys. Rev. Lett., 117: 118101
(2016).
[2] M. S. de Vries and P. Hobza. Gas-Phase Spectroscopy of Biomolecular
Building Blocks. Annu. Rev. Phys. Chem., 58: 585–612 (2007).
[3] R. Weinkauf, J.-P. Schermann, M. de Vries, and K. Kleinermanns. Molec-
ular physics of building blocks of life under isolated or defined conditions.
EPJ D, 20: 309–316 (2002).
[4] T. W. Robinson, H. G. Kjaergaard, S.-I. Ishiuchi, M. Shinozaki, and
M. Fujii. Vibrational Overtone Spectroscopy of Jet-Cooled Aminophenols
as a Probe for Rotational Isomers. J. Phys. Chem. A, 108: 4420–4427
(2004).
[5] S. Boye, H. Krogh, I. B. Nielsen, S. Brøndsted Nielsen, S. U. Pedersen,
U. V. Pedersen, L. H. Andersen, A. F. Bell, X. He, and P. J. Tonge.
Vibrationally resolved photoabsorption spectroscopy of red fluorescent
protein chromophore anions. Phys. Rev. Lett., 90: 118103 (2003).
[6] S. Boye, I. B. Nielsen, S. Brøndsted Nielsen, H. Krogh, A. Lapierre, H. B.
Pedersen, S. U. Pedersen, U. V. Pedersen, and L. H. Andersen. Gas-phase
absorption properties of a green fluorescent protein-mutant chromophore:
The W7 clone. J. Chem. Phys., 119: 338–345 (2003).
[7] I. Alata, C. Dedonder, M. Broquier, E. Marceca, and C. Jouvet. Role
of the Charge-Transfer State in the Electronic Absorption of Protonated
Hydrocarbon Molecules. J. Am. Chem. Soc., 132: 17483–17489 (2010).
107](https://image.slidesharecdn.com/683d4131-560b-40b7-aabd-4b72f336e72f-161214213503/85/Phd-thesis-Jorgen-Houmoller-final-121-320.jpg)
![108 Bibliography
[8] K. Lincke, T. Sølling, L. H. Andersen, B. Klærke, D. B. Rahbek, J. Rajput,
C. B. Oehlenschlæger, M. Å. Petersen, and M. Brøndsted Nielsen. On
the absorption of the phenolate chromophore in the green fluorescent
protein-role of individual interactions. Chem. Commun., 46: 734–736
(2010).
[9] M. A. Christensen, E. A. Della Pia, J. Houmøller, S. Thomsen, M. Wanko,
A. D. Bond, A. Rubio, S. Brøndsted Nielsen, and M. Brøndsted Nielsen.
Cross-Conjugation vs. Linear Conjugation in Donor-Bridge-Acceptor
Nitrophenol Chromophores. Eur. J. Org. Chem., 2014: 2044–2052 (2014).
[10] M. W. Forbes and R. A. Jockusch. Deactivation Pathways of an Isolated
Green Fluorescent Protein Model Chromophore Studied by Electronic
Action Spectroscopy. J. Am. Chem. Soc., 131: 17038–17039 (2009).
[11] P. Markush, P. Bolognesi, A. Cartoni, P. Rousseau, S. Maclot, R. De-
launay, A. Domaracka, J. Kocisek, M. C. Castrovilli, B. A. Huber, and
L. Avaldi. The role of the environment in the ion induced fragmentation
of uracil. Phys. Chem. Chem. Phys., 18: 16721–16729 (2016).
[12] K. Chingin, R. M. Balabin, V. Frankevich, K. Barylyuk, R. Nieckarz,
P. Sagulenko, and R. Zenobi. Absorption of the green fluorescent protein
chromophore anion in the gas phase studied by a combination of FTICR
mass spectrometry with laser-induced photodissociation spectroscopy. Int.
J. Mass Spectrom., 306: 241 – 245 (2011).
[13] M. Wanko, P. García-Risueño, and A. Rubio. Excited states of the
green fluorescent protein chromophore: Performance of ab initio and
semi-empirical methods. Phys. Status Solidi B, 249: 392–400 (2012).
[14] L. H. Andersen, I. B. Nielsen, M. B. Kristensen, M. O. A. El Ghazaly,
S. Haacke, M. Brøndsted Nielsen, and M. Å. Petersen. Absorption of
Schiff-Base Retinal Chromophores in Vacuo. J. Am. Chem. Soc., 127:
12347–12350 (2005).
[15] O. Valsson and C. Filippi. Gas-Phase Retinal Spectroscopy: Temperature
Effects Are But a Mirage. J. Phys. Chem. Lett., 3: 908–912 (2012).
[16] M. Goto, J. Matsumoto, H. Shiromaru, Y. Achiba, T. Majima, H. Tanuma,
and T. Azuma. Laser-induced thermal detachment of hot, large molecular
ions under multiphoton-absorption conditions. Phys. Rev. A, 87: 033406
(2013).
[17] E. Epifanovsky, K. Kowalski, P.-D. Fan, M. Valiev, S. Matsika, and A. I.
Krylov. On the electronically excited states of uracil. J. Phys. Chem. A,
112: 9983–9992 (2008).](https://image.slidesharecdn.com/683d4131-560b-40b7-aabd-4b72f336e72f-161214213503/85/Phd-thesis-Jorgen-Houmoller-final-122-320.jpg)
![Bibliography 109
[18] E. Epifanovsky, I. Polyakov, B. Grigorenko, A. Nemukhin, and A. I.
Krylov. Quantum Chemical Benchmark Studies of the Electronic Prop-
erties of the Green Fluorescent Protein Chromophore. 1. Electronically
Excited and Ionized States of the Anionic Chromophore in the Gas Phase.
J. Chem. Theory Comput., 5: 1895–1906 (2009).
[19] Y. Shao, L. F. Molnar, Y. Jung, J. Kussmann, C. Ochsenfeld, S. T. Brown,
A. T. B. Gilbert, L. V. Slipchenko, S. V. Levchenko, D. P. O’Neill, R. A.
DiStasio, Jr., R. C. Lochan, T. Wang, G. J. O. Beran, N. A. Besley,
J. M. Herbert, C. Y. Lin, T. Van Voorhis, S. H. Chien, A. Sodt, R. P.
Steele, V. A. Rassolov, P. E. Maslen, P. P. Korambath, R. D. Adamson,
B. Austin, J. Baker, E. F. C. Byrd, H. Dachsel, R. J. Doerksen, A. Dreuw,
B. D. Dunietz, A. D. Dutoi, T. R. Furlani, S. R. Gwaltney, A. Heyden,
S. Hirata, C.-P. Hsu, G. Kedziora, R. Z. Khalliulin, P. Klunzinger, A. M.
Lee, M. S. Lee, W. Liang, I. Lotan, N. Nair, B. Peters, E. I. Proynov,
P. A. Pieniazek, Y. M. Rhee, J. Ritchie, E. Rosta, C. D. Sherrill, A. C.
Simmonett, J. E. Subotnik, H. L. Woodcock, III, W. Zhang, A. T. Bell,
A. K. Chakraborty, D. M. Chipman, F. J. Keil, A. Warshel, W. J. Hehre,
H. F. Schaefer, III, J. Kong, A. I. Krylov, P. M. W. Gill, and M. Head-
Gordon. Advances in methods and algorithms in a modern quantum
chemistry program package. Phys. Chem. Chem. Phys., 8: 3172–3191
(2006).
[20] C. M. Oana and A. I. Krylov. Cross sections and photoelectron angular
distributions in photodetachment from negative ions using equation-of-
motion coupled-cluster Dyson orbitals. J. Chem. Phys., 131 (2009).
[21] F. Yang, L. G. Moss, and G. N. Phillips. The molecular structure of
green fluorescent protein. Nat. Biotechnol., 10: 1246–1251 (1996).
[22] J. Petersen, P. G. Wilmann, T. Beddoe, A. J. Oakley, R. J. Devenish,
M. Prescott, and J. Rossjohn. The 2.0-Å Crystal Structure of eqFP611,
a Far Red Fluorescent Protein from the Sea Anemone Entacmaea quadri-
color. J. Biol. Chem., 278: 44626–44631 (2003).
[23] I. Nielsen, S. Boyé-Péronne, M. El Ghazaly, M. Kristensen, S. Brønd-
sted Nielsen, and L. Andersen. Absorption Spectra of Photoactive Yellow
Protein Chromophores in Vacuum. Biophys. J., 89: 2597 – 2604 (2005).
[24] D. Zuev, K. B. Bravaya, M. V. Makarova, and A. I. Krylov. Effect of
microhydration on the electronic structure of the chromophores of the
photoactive yellow and green fluorescent proteins. J. Chem. Phys., 135:
194304 (2011).
[25] A. Sinicropi, T. Andruniow, N. Ferré, R. Basosi, and M. Olivucci. Prop-
erties of the Emitting State of the Green Fluorescent Protein Resolved
at the CASPT2//CASSCF/CHARMM Level. J. Am. Chem. Soc., 127:
11534–11535 (2005).](https://image.slidesharecdn.com/683d4131-560b-40b7-aabd-4b72f336e72f-161214213503/85/Phd-thesis-Jorgen-Houmoller-final-123-320.jpg)
![110 Bibliography
[26] K. B. Bravaya, M. G. Khrenova, B. L. Grigorenko, A. V. Nemukhin, and
A. I. Krylov. Effect of Protein Environment on Electronically Excited
and Ionized States of the Green Fluorescent Protein Chromophore. J.
Phys. Chem. B, 115: 8296–8303 (2011).
[27] A. R. Milosavljević, V. Z. Cerovski, F. Canon, M. L. Ranković, N. Škoro,
L. Nahon, and A. Giuliani. Energy-Dependent UV Photodissociation of
Gas-Phase Adenosine Monophosphate Nucleotide Ions: The Role of a
Single Solvent Molecule. J. Phys. Chem. Lett., 5: 1994–1999 (2014).
[28] E. G. Buchanan, J. R. Gord, and T. S. Zwier. Solvent Effects on Vibronic
Coupling in a Flexible Bichromophore: Electronic Localization and Energy
Transfer induced by a Single Water Molecule. J. Phys. Chem. Lett., 4:
1644–1648 (2013).
[29] M.-B. S. Kirketerp, T. Ryhding, K. Støchkel, M. Brøndsted Nielsen,
and S. Brøndsted Nielsen. Role of Nearby Charges on the Electronic
Structure of π-Conjugated Molecules: Symmetric versus Asymmetric
Charge Distributions in Oligo(p-phenyleneethynylene). J. Phys. Chem. A,
115: 1222–1227 (2011).
[30] K. Støchkel, B. F. Milne, and S. Brøndsted Nielsen. Absorption Spectrum
of the Firefly Luciferin Anion Isolated in Vacuo. J. Phys. Chem. A, 115:
2155–2159 (2011).
[31] J. A. Wyer and S. Brøndsted Nielsen. Absorption by Isolated Ferric Heme
Nitrosyl Cations In Vacuo. Angew. Chem. Int. Ed., 51: 10256–10260
(2012).
[32] S. Tomita, J. Forster, P. Hvelplund, A. Jensen, and S. Brøndsted Nielsen.
High energy collisions of protonated water clusters. EPJ D, 16: 119–122
(2001).
[33] H. Shen, P. Hvelplund, D. Mathur, A. Barany, H. Cederquist, N. Sel-
berg, and D. Lorents. Fullerene-fullerene collisions - fragmentation and
electron-capture. Phys. Rev. A, 52: 3847–3851 (1995).
[34] P. Hvelplund, L. Andersen, C. Brink, D. Yu, D. Lorents, and R. Ruoff.
Charge-transfer in collisions involving multiply-charged c-60 molecules.
Z. Phys. D, 30: 323–326 (1994).
[35] O. Boltalina, P. Hvelplund, T. Jorgensen, M. Larsen, M. Larsson, and
D. Sharoitchenko. Electron capture by fluorinated fullerene anions in
collisions with Xe atoms. Phys. Rev. A, 62: 023202 (2000).
[36] J. B. Fenn, M. Mann, C. K. Meng, S. F. Wong, and C. M. Whitehouse.
Electrospray ionization for mass spectrometry of large biomolecules. Sci-
ence, 246: 64–71 (1989).](https://image.slidesharecdn.com/683d4131-560b-40b7-aabd-4b72f336e72f-161214213503/85/Phd-thesis-Jorgen-Houmoller-final-124-320.jpg)
![Bibliography 111
[37] S. Nguyen and J. B. Fenn. Gas-phase ions of solute species from charged
droplets of solutions. Proc. Natl. Acad. Sci. U.S.A., 104: 1111–1117
(2007).
[38] J. Fernandez de la Mora. Electrospray ionization of large multiply charged
species proceeds via Dole’s charged residue mechanism. Anal. Chim. Acta,
406: 93 – 104 (2000).
[39] J. Sandström, P. Andersson, K. Fritioff, D. Hanstorp, R. Thomas, D. Pegg,
and K. Wendt. Laser photodetachment mass spectrometry. Nucl. Instr.
Meth. Phys. Res. B, 217: 513 – 520 (2004).
[40] Y. Park, V. Choong, Y. Gao, B. R. Hsieh, and C. W. Tang. Work function
of indium tin oxide transparent conductor measured by photoelectron
spectroscopy. Appl. Phys. Lett., 68: 2699–2701 (1996).
[41] J. U. Andersen, E. Bonderup, and K. Hansen. On the concept of tem-
perature for a small isolated system. J. Chem. Phys., 114: 6518–6525
(2001).
[42] L. H. Andersen, H. Bluhme, S. Boye, T. J. D. Jørgensen, H. Krogh, I. B.
Nielsen, S. Brøndsted Nielsen, and A. Svendsen. Experimental studies
of the photophysics of gas-phase fluorescent protein chromophores. Phys.
Chem. Chem. Phys., 6: 2617–2627 (2004).
[43] M. Kasha. Characterization of electronic transitions in complex molecules.
Discuss. Faraday Soc., 9: 14–19 (1950).
[44] Y.-C. Cheng and G. R. Fleming. Dynamics of Light Harvesting in
Photosynthesis. Annu. Rev. Phys. Chem., 60: 241–262 (2009).
[45] M. A. Green, K. Emery, Y. Hishikawa, W. Warta, and E. D. Dunlop.
Solar cell efficiency tables (Version 45). Prog. photovolt., 23: 1–9 (2015).
[46] B. F. Milne, Y. Toker, A. Rubio, and S. Brøndsted Nielsen. Unraveling the
Intrinsic Color of Chlorophyll. Angew. Chem., 127: 2198–2201 (2015).
[47] E. L. Smith. The Chlorophyll-protein Compound Of The Green Leaf. J.
Gen. Physiol., 24: 565–582 (1941).
[48] N. W. Withers, R. S. Alberte, R. A. Lewin, J. P. Thornber, G. Britton,
and T. W. Goodwin. Photosynthetic unit size, carotenoids, and chloro-
phyll—protein composition of Prochloron sp., a prokaryotic green alga.
Proc. Natl. Acad. Sci. U.S.A., 75: 2301–2305 (1978).
[49] J. A. Guikema and L. A. Sherman. Chlorophyll-protein organization of
membranes from the cyanobacterium Anacystis nidulans. Arch. Biochem.
Biophys., 220: 155 – 166 (1983).](https://image.slidesharecdn.com/683d4131-560b-40b7-aabd-4b72f336e72f-161214213503/85/Phd-thesis-Jorgen-Houmoller-final-125-320.jpg)
![112 Bibliography
[50] J. C. Waldron and J. M. Anderson. Chlorophyll-Protein Complexes from
Thylakoids of a Mutant Barley Lacking Chlorophyll b. Eur. J. Biochem.,
102: 357–362 (1979).
[51] B. F. Milne, C. Kjær, J. Houmøller, M. H. Stockett, Y. Toker, A. Ru-
bio, and S. Brøndsted Nielsen. On the Exciton Coupling between Two
Chlorophyll Pigments in the Absence of a Protein Environment: Intrinsic
Effects Revealed by Theory and Experiment. Angew. Chem. Int. Ed., 55:
6248–6251 (2016).
[52] R. Kubin and A. Fletcher. Fluorescence quantum yields of some rho-
damine dyes. J. Lumin., 27: 455 – 462 (1983).
[53] J. T. Khoury, S. E. Rodriguez-Cruz, and J. H. Parks. Pulsed fluorescence
measurements of trapped molecular ions with zero background detection.
J. Am. Soc. Mass Spectrom., 13: 696 – 708 (2002).
[54] J. Mitchell Wells, E. R. Badman, and R. Graham Cooks. A Quadrupole
Ion Trap with Cylindrical Geometry Operated in the Mass-Selective In-
stability Mode. Anal. Chem., 70: 438–444 (1998).
[55] W. Paul and H. Steinwedel. Ein neues Massenspektrometer ohne Mag-
netfeld. Z. Naturforsch. A, 8: 448–450 (1953).
[56] Q. Bian, M. W. Forbes, F. O. Talbot, and R. A. Jockusch. Gas-phase
fluorescence excitation and emission spectroscopy of mass-selected trapped
molecular ions. Phys. Chem. Chem. Phys., 12: 2590–2598 (2010).
[57] M. Kordel, D. Schooss, C. Neiss, L. Walter, and M. M. Kappes. Laser-
Induced Fluorescence of Rhodamine 6G Cations in the Gas Phase: A
Lower Bound to the Lifetime of the First Triplet State. J. Phys. Chem.
A, 114: 5509–5514 (2010).
[58] K. Chingin, H. Chen, G. Gamez, and R. Zenobi. Exploring Fluores-
cence and Fragmentation of Ions Produced by Electrospray Ionization in
Ultrahigh Vacuum. J. Am. Soc. Mass Spectrom., 20: 1731 – 1738 (2009).
[59] E. Mathieu. Mémoire sur le mouvement vibratoire d’une membrane de
forme elliptique. J. Math. Pures Appl., 13: 137–203 (1868).
[60] R. E. March. An Introduction to Quadrupole Ion Trap Mass Spectrometry.
J. Mass Spectrom., 32: 351–369 (1997).
[61] M. Nappi, C. Weil, C. Cleven, L. Horn, H. Wollnik, and R. Graham Cooks.
Visual representations of simulated three-dimensional ion trajectories in
an ion trap mass spectrometer. Int. J. Mass Spectrom. Ion Processes,
161: 77 – 85 (1997).](https://image.slidesharecdn.com/683d4131-560b-40b7-aabd-4b72f336e72f-161214213503/85/Phd-thesis-Jorgen-Houmoller-final-126-320.jpg)
![Bibliography 113
[62] R. March, R. Hughes, and J. Todd. Quadrupole Storage Mass Spectrom-
etry. A Wiley-Interscience publication. Wiley (1989). Pp. 200.
[63] S. Guan and R. T. McIver. Optimal phase modulation in stored wave
form inverse Fourier transform excitation for Fourier transform mass
spectrometry. I. Basic algorithm. J. Chem. Phys., 92: 5841–5846 (1990).
[64] S. Guan. Optimal phase modulation in stored waveform inverse Fourier
transform excitation for Fourier transform mass spectrometry. II. Magni-
tude spectrum smoothing. J. Chem. Phys., 93: 8442–8445 (1990).
[65] L. Jing, C. Li, R. L. Wong, D. A. Kaplan, and I. J. Amster. Improved
Mass Accuracy for Higher Mass Peptides by Using SWIFT Excitation
for MALDI-FTICR Mass Spectrometry. J. Am. Soc. Mass Spectrom.,
19: 76 – 81 (2008).
[66] S. Guan and A. G. Marshall. Stored waveform inverse Fourier transform
(SWIFT) ion excitation in trapped-ion mass spectometry: Theory and
applications. Int. J. Mass Spectrom. Ion Processes, 157: 5 – 37 (1996).
[67] M. W. Forbes and R. A. Jockusch. Gas-Phase Fluorescence Excitation
and Emission Spectroscopy of Three Xanthene Dyes (Rhodamine 575,
Rhodamine 590 and Rhodamine 6G) in a Quadrupole Ion Trap Mass
Spectrometer. J. Am. Soc. Mass Spectrom., 22: 93–109 (2011).
[68] M. Zhao, X.-F. Yang, S. He, and L. Wang. A rhodamine-based chro-
mogenic and fluorescent chemosensor for copper ion in aqueous media.
Sens. Actuators, B, 135: 625 – 631 (2009).
[69] M. H. Stockett, J. Houmøller, K. Støchkel, A. Svendsen, and S. Brønd-
sted Nielsen. A cylindrical quadrupole ion trap in combination with
an electrospray ion source for gas-phase luminescence and absorption
spectroscopy. Rev. Sci. Instrum., 87: 053103 (2016).
[70] M. H. Stockett, J. Houmøller, and S. Brøndsted Nielsen. Nile blue shows
its true colors in gas-phase absorption and luminescence ion spectroscopy.
J. Chem. Phys., 145: 104303 (2016).
[71] H. Oliveira, A. Camargo, L. Macedo, M. Gehlen, and A. da Silva. Syn-
thesis, structure, electronic and vibrational spectra of 9-(Diethylamino)-
benzo(a)phenoxazin-7-ium-5-N-methacrylamide. Spectrochim. Acta, Part
A, 58: 3103 – 3111 (2002).
[72] R. Sens and K. H. Drexhage. Fluorescence quantum yield of oxazine and
carbazine laser dyes. Journal of Luminescence, 24: 709 – 712 (1981).
[73] C. W. Lin, J. R. Shulok, S. D. Kirley, L. Cincotta, and J. W. Foley. Lyso-
somal localization and mechanism of uptake of nile blue photosensitizers
in tumor-cells. Cancer Res., 51: 2710–2719 (1991).](https://image.slidesharecdn.com/683d4131-560b-40b7-aabd-4b72f336e72f-161214213503/85/Phd-thesis-Jorgen-Houmoller-final-127-320.jpg)
![114 Bibliography
[74] H. J. Van Staveren, O. C. Speelman, M. J. H. Witjes, L. Cincotta, and
W. M. Star. Fluorescence Imaging and Spectroscopy of Ethyl Nile Blue
A in Animal Models of (Pre)malignancies. Photochem. Photobiol., 73:
32–38 (2001).
[75] M. Marazzi, H. Gattuso, and A. Monari. Nile blue and Nile red opti-
cal properties predicted by TD-DFT and CASPT2 methods: static and
dynamic solvent effects. Theor. Chem. Acc., 135: 1–11 (2016).
[76] S. Fleming, A. Mills, and T. Tuttle. Predicting the UV–vis spectra of
oxazine dyes. Beilstein J. Org. Chem., 7: 432–441 (2011).
[77] A. G. Gilani, S. Hosseini, M. Moghadam, and E. Alizadeh. Excited state
electric dipole moment of nile blue and brilliant cresyl blue: A comparative
study. Spectrochim. Acta, Part A, 89: 231 – 237 (2012).
[78] P. W. Milloni and J. H. Eberly. Lasers. Wiley-Interscience (1988).
[79] J. A. Giordmaine and R. C. Miller. Tunable Coherent Parametric Oscil-
lation in LiNbO3 at Optical Frequencies. Phys. Rev. Lett., 14: 973–976
(1965).
[80] A. V. Smith and M. S. Bowers. Image-rotating cavity designs for improved
beam quality in nanosecond optical parametric oscillators. J. Opt. Soc.
Am. B, 18: 706–713 (2001).
[81] P. Pellin and A. Broca. A Spectroscope of Fixed Deviation. Astrophys.
J., 10: 337 (1899).
[82] K. Gomi and N. Kajiyama. Oxyluciferin, a Luminescence Product of
Firefly Luciferase, Is Enzymatically Regenerated into Luciferin. J. Biol.
Chem., 276: 36508–36513 (2001).
[83] L. Zhong-wei, A. min Ren, J. fu Guo, T. Yang, J. D. Goddard, and J. kang
Feng. Color-Tuning Mechanism in Firefly Luminescence: Theoretical
Studies on Fluorescence of Oxyluciferin in Aqueous Solution Using Time
Dependent Density Functional Theory. J. Phys. Chem. A, 112: 9796–9800
(2008).
[84] W. L. Ryan, D. J. Gordon, and D. H. Levy. Gas-Phase Photochemistry
of the Photoactive Yellow Protein Chromophore trans-p-Coumaric Acid.
J. Am. Chem. Soc., 124: 6194–6201 (2002).
[85] J. U. Andersen, P. Hvelplund, S. Brøndsted Nielsen, S. Tomita,
H. Wahlgreen, S. P. Møller, U. V. Pedersen, J. S. Forster, and T. J. D. Jør-
gensen. The combination of an electrospray ion source and an electrostatic
storage ring for lifetime and spectroscopy experiments on biomolecules.
Rev. Sci. Instrum., 73: 1284–1287 (2002).](https://image.slidesharecdn.com/683d4131-560b-40b7-aabd-4b72f336e72f-161214213503/85/Phd-thesis-Jorgen-Houmoller-final-128-320.jpg)
![Bibliography 115
[86] S. P. Møller. ELISA, and electrostatic storage ring for atomic physics.
Nucl. Instr. Meth. Phys. Res. A, 394: 281 – 286 (1997).
[87] M. Wanko, J. Houmøller, K. Støchkel, M.-B. Suhr Kirketerp, M. Å.
Petersen, M. Brøndsted Nielsen, S. Brøndsted Nielsen, and A. Rubio.
Substitution effects on the absorption spectra of nitrophenolate isomers.
Phys. Chem. Chem. Phys., 14: 12905–12911 (2012).
[88] F. Liu, Y. Liu, L. D. Vico, and R. Lindh. Theoretical Study of the
Chemiluminescent Decomposition of Dioxetanone. J. Am. Chem. Soc.,
131: 6181–6188 (2009).
[89] Y. Ando, K. Niwa, N. Yamada, T. Enomoto, T. Irie, H. Kubota,
Y. Ohmiya, and H. Akiyama. Firefly bioluminescence quantum yield
and colour change by pH-sensitive green emission. Nat. Photonics, 2:
1749–4885 (2008).
[90] I. Navizet, Y.-J. Liu, N. Ferré, H.-Y. Xiao, W.-H. Fang, and R. Lindh.
Color-Tuning Mechanism of Firefly Investigated by Multi-Configurational
Perturbation Method. J. Am. Chem. Soc., 132: 706–712 (2010).
[91] D. Cai, M. A. L. Marques, B. F. Milne, and F. Nogueira. Bioheterojunc-
tion Effect on Fluorescence Origin and Efficiency Improvement of Firefly
Chromophores. J. Phys. Chem. Lett., 1: 2781–2787 (2010).
[92] P. Naumov, Y. Ozawa, K. Ohkubo, and S. Fukuzumi. Structure and Spec-
troscopy of Oxyluciferin, the Light Emitter of the Firefly Bioluminescence.
J. Am. Chem. Soc., 131: 11590–11605 (2009).
[93] G. Orlova, J. D. Goddard, and L. Y. Brovko. Theoretical Study of the
Amazing Firefly Bioluminescence: The Formation and Structures of the
Light Emitters. J. Am. Chem. Soc., 125: 6962–6971 (2003).
[94] N. Nakatani, J.-y. Hasegawa, and H. Nakatsuji. Red Light in Chemilu-
minescence and Yellow-Green Light in Bioluminescence: Color-Tuning
Mechanism of Firefly, Photinus pyralis, Studied by the Symmetry-Adapted
Cluster-Configuration Interaction Method. J. Am. Chem. Soc., 129: 8756–
8765 (2007).
[95] C.-I. Song and Y. M. Rhee. Development of force field parameters for
oxyluciferin on its electronic ground and excited states. Int. J. Quantum
Chem., 111: 4091–4105 (2011).
[96] K. Støchkel, C. N. Hansen, J. Houmøller, L. M. Nielsen, K. Anggara,
M. Linares, P. Norman, F. Nogueira, O. V. Maltsev, L. Hintermann,
S. Brøndsted Nielsen, P. Naumov, and B. F. Milne. On the Influence of
Water on the Electronic Structure of Firefly Oxyluciferin Anions from](https://image.slidesharecdn.com/683d4131-560b-40b7-aabd-4b72f336e72f-161214213503/85/Phd-thesis-Jorgen-Houmoller-final-129-320.jpg)
![116 Bibliography
Absorption Spectroscopy of Bare and Monohydrated Ions in Vacuo. J.
Am. Chem. Soc., 135: 6485–6493 (2013).
[97] S. L. Holt and C. J. Ballhausen. Low temperature absorption spectra of
KMnO4 in KClO4. Theor. Chim. Acta, 7: 313–320 (1967).
[98] H. Hsu, C. Peterson, and R. M. Pitzer. Calculations on the permanganate
ion in the ground and excited states. J. Chem. Phys., 64: 791–795 (1976).
[99] M. Nooijen. Combining coupled cluster and perturbation theory. J. Chem.
Phys., 111: 10815–10826 (1999).
[100] R. M. Dickson and T. Ziegler. A density functional study of the electronic
spectrum of permanganate. Int. J. Quantum Chem., 58: 681–687 (1996).
[101] M. Seth, T. Ziegler, A. Banerjee, J. Autschbach, S. J. A. van Gisbergen,
and E. J. Baerends. Calculation of the A term of magnetic circular dichro-
ism based on time dependent-density functional theory I. Formulation
and implementation. J. Chem. Phys., 120: 10942–10954 (2004).
[102] L. Jose, M. Seth, and T. Ziegler. Molecular and Vibrational Structure of
Tetroxo d0 Metal Complexes in their Excited States. A Study Based on
Time-Dependent Density Functional Calculations and Franck–Condon
Theory. J. Phys. Chem. A, 116: 1864–1876 (2012).
[103] J. Neugebauer, E. J. Baerends, and M. Nooijen. Vibronic Structure of
the Permanganate Absorption Spectrum from Time-Dependent Density
Functional Calculations. J. Phys. Chem. A, 109: 1168–1179 (2005).
[104] J. M. Berg, J. L. Tymoczko, and L. Stryer. Biochemistry. New York: W
H Freeman, 6 edition (2006). Chapter 19.
[105] G. L. Closs and J. R. Miller. Intramolecular Long-Distance Electron
Transfer in Organic Molecules. Science, 240: 440–447 (1988).
[106] M. Marianski, A. Oliva, and J. J. Dannenberg. A Reinvestigation of the
Dimer of para-Benzoquinone and Pyrimidine with MP2, CCSD(T), and
DFT Using Functionals Including Those Designed to Describe Dispersion.
J. Phys. Chem. A, 116: 8100–8105 (2012).
[107] M. Zamadar, A. R. Cook, A. Lewandowska-Andralojc, R. Holroyd,
Y. Jiang, J. Bikalis, and J. R. Miller. Electron Transfer by Excited
Benzoquinone Anions: Slow Rates for Two-Electron Transitions. J. Phys.
Chem. A, 117: 8360–8367 (2013).
[108] V. Barone, R. Improta, G. Morelli, and F. Santoro. UV-vis spectra of
p-benzoquinone anion radical in solution by a TD-DFT/PCM approach.
Theor. Chem. Acc., 118: 143–148 (2007).](https://image.slidesharecdn.com/683d4131-560b-40b7-aabd-4b72f336e72f-161214213503/85/Phd-thesis-Jorgen-Houmoller-final-130-320.jpg)
![Bibliography 117
[109] D. A. Horke, Q. Li, L. Blancafort, and J. R. R. Verlet. Ultrafast above-
threshold dynamics of the radical anion of a prototypical quinone electron-
acceptor. Nat. Chem., 5: 711–717 (2013).
[110] R. Lahtinen, D. J. Fermin, K. Kontturi, and H. H. Girault. Artificial
photosynthesis at liquid | liquid interfaces: photoreduction of benzoquinone
by water soluble porphyrin species. J. Electroanal. Chem., 483: 81 – 87
(2000).
[111] A. M. Weyers, R. Chatterjee, S. Milikisiyants, and K. V. Lakshmi. Struc-
ture and Function of Quinones in Biological Solar Energy Transduction:
A Differential Pulse Voltammetry, EPR, and Hyperfine Sublevel Correla-
tion (HYSCORE) Spectroscopy Study of Model Benzoquinones. J. Phys.
Chem. B, 113: 15409–15418 (2009).
[112] M. H. Stockett and S. Brøndsted Nielsen. Transition energies of ben-
zoquinone anions are immune to symmetry breaking by a single water
molecule. Phys. Chem. Chem. Phys., 18: 6996–7000 (2016).
[113] K. Piech, T. Bally, T. Ichino, and J. Stanton. Vibronic spectra of
the p-benzoquinone radical anion and cation: a matrix isolation and
computational study. Phys. Chem. Chem. Phys., 16: 2011–2019 (2014).
[114] A. Juris, V. Balzani, F. Barigelletti, S. Campagna, P. Belser, and A. von
Zelewsky. Ru(II) polypyridine complexes: photophysics, photochemistry,
eletrochemistry, and chemiluminescence. Coord. Chem. Rev., 84: 85 –
277 (1988).
[115] N. H. Damrauer, G. Cerullo, A. Yeh, T. R. Boussie, C. V. Shank, and
J. K. McCusker. Femtosecond Dynamics of Excited-State Evolution in
Ru(bpy)3
2+
. Science, 275: 54–57 (1997).
[116] K. Kalyanasundaram. Photophysics, photochemistry and solar energy
conversion with tris(bipyridyl)ruthenium(II) and its analogues. Coord.
Chem. Rev., 46: 159 – 244 (1982).
[117] S. R. Stoyanov, J. M. Villegas, and D. P. Rillema. Density Functional
Theory Calculations of Selected Ru(II) Two Ring Diimine Complex Dica-
tions. Inorg. Chem., 41: 2941–2945 (2002).
[118] J. H. Alstrum-Acevedo, M. K. Brennaman, and T. J. Meyer. Chemical
approaches to artificial photosynthesis. 2. Inorg. Chem., 44: 6802–6827
(2005).
[119] B. D. Koivisto, K. C. D. Robson, and C. P. Berlinguette. Systematic
Manipulation of the Light-Harvesting Properties for Tridentate Cyclomet-
alated Ruthenium(II) Complexes. Inorg. Chem., 48: 9644–9652 (2009).](https://image.slidesharecdn.com/683d4131-560b-40b7-aabd-4b72f336e72f-161214213503/85/Phd-thesis-Jorgen-Houmoller-final-131-320.jpg)
![118 Bibliography
[120] M. H. Stockett and S. Brøndsted Nielsen. Does a single CH3CN molecule
attached to Ru(bipy)3
2+
affect its absorption spectrum? J. Chem. Phys.,
142 (2015).
[121] E. A. Bell, P. Boehnke, T. M. Harrison, and W. L. Mao. Potentially
biogenic carbon preserved in a 4.1 billion-year-old zircon. Proc. Natl.
Acad. Sci. U.S.A., 112: 14518–14521 (2015).
[122] A. S. Chatterley, C. W. West, G. M. Roberts, V. G. Stavros, and J. R. R.
Verlet. Mapping the Ultrafast Dynamics of Adenine onto Its Nucleotide
and Oligonucleotides by Time-Resolved Photoelectron Imaging. J. Phys.
Chem. Lett., 5: 843–848 (2014).
[123] R. Improta, F. Santoro, and L. Blancafort. Quantum Mechanical Stud-
ies on the Photophysics and the Photochemistry of Nucleic Acids and
Nucleobases. Chem. Rev., 116: 3540–3593 (2016).
[124] D. Ghosh, D. Kosenkov, V. Vanovschi, C. F. Williams, J. M. Herbert, M. S.
Gordon, M. W. Schmidt, L. V. Slipchenko, and A. I. Krylov. Noncovalent
Interactions in Extended Systems Described by the Effective Fragment
Potential Method: Theory and Application to Nucleobase Oligomers. J.
Phys. Chem. A, 114: 12739–12754 (2010).
[125] K. B. Bravaya, O. Kostko, M. Ahmed, and A. I. Krylov. The effect of
π-stacking, H-bonding, and electrostatic interactions on the ionization
energies of nucleic acid bases: adenine-adenine, thymine-thymine and
adenine-thymine dimers. Phys. Chem. Chem. Phys., 12: 2292–2307
(2010).
[126] L. M. Nielsen, S. V. Hoffmann, and S. Brøndsted Nielsen. Electronic cou-
pling between photo-excited stacked bases in DNA and RNA strands with
emphasis on the bright states initially populated. Photochem. Photobiol.
Sci., 12: 1273–1285 (2013).
[127] J. C. Marcum, A. Halevi, and J. M. Weber. Photodamage to isolated
mononucleotides-photodissociation spectra and fragment channels. Phys.
Chem. Chem. Phys., 11: 1740–1751 (2009).
[128] C. E. Crespo-Hernández, B. Cohen, P. M. Hare, and B. Kohler. Ultrafast
Excited-State Dynamics in Nucleic Acids. Chem. Rev., 104: 1977–2020
(2004).
[129] M. Barbatti, A. J. A. Aquino, and H. Lischka. The UV absorption of
nucleobases: semi-classical ab initio spectra simulations. Phys. Chem.
Chem. Phys., 12: 4959–4967 (2010).](https://image.slidesharecdn.com/683d4131-560b-40b7-aabd-4b72f336e72f-161214213503/85/Phd-thesis-Jorgen-Houmoller-final-132-320.jpg)
![Bibliography 119
[130] S. Ø. Pedersen, C. S. Byskov, F. Turecek, and S. Brøndsted Nielsen.
Structures of protonated thymine and uracil and their monohydrated
gas-phase ions from ultraviolet action spectroscopy and theory. J. Phys.
Chem. A, 118: 4256–4265 (2014).
[131] S. Ø. Pedersen, K. Støchkel, C. S. Byskov, L. M. Nielsen, and S. Brønd-
sted Nielsen. Gas-phase spectroscopy of protonated adenine, adenosine
5’-monophosphate and monohydrated ions. Phys. Chem. Chem. Phys.,
15: 19748–19752 (2013).
[132] J. K. Wolken and F. Turecek. Proton affinity of uracil. A computational
study of protonation sites. J. Am. Soc. Mass Spectrom., 11: 1065 – 1071
(2000).
[133] P. Petrangolini, A. Alessandrini, and P. Facci. Hydroquinone-
Benzoquinone Redox Couple as a Versatile Element for Molecular Elec-
tronics. J. Phys. Chem. C, 117: 17451–17461 (2013).
[134] O. V. Boyarkin, S. R. Mercier, A. Kamariotis, and T. R. Rizzo. Electronic
Spectroscopy of Cold, Protonated Tryptophan and Tyrosine. J. Am. Chem.
Soc., 128: 2816–2817 (2006).
[135] S. R. Mercier, O. V. Boyarkin, A. Kamariotis, M. Guglielmi, I. Tavernelli,
M. Cascella, U. Rothlisberger, and T. R. Rizzo. Microsolvation Effects
on the Excited-State Dynamics of Protonated Tryptophan. J. Am. Chem.
Soc., 128: 16938–16943 (2006).
[136] D. Gerlich. Ion-neutral collisions in a 22-pole trap at very-low energies.
Phys. Scr., T59: 256–263 (1995).
[137] X.-B. Wang and L.-S. Wang. Development of a low-temperature photo-
electron spectroscopy instrument using an electrospray ion source and a
cryogenically controlled ion trap. Rev. Sci. Instrum., 79: 073108 (2008).
[138] A. B. Kanu, P. Dwivedi, M. Tam, L. Matz, and H. H. Hill. Ion mobil-
ity–mass spectrometry. J. Mass Spectrom., 43: 1–22 (2008).
[139] B. D. Adamson, N. J. A. Coughlan, R. E. Continetti, and E. J. Bieske.
Changing the shape of molecular ions: photoisomerization action spec-
troscopy in the gas phase. Phys. Chem. Chem. Phys., 15: 9540–9548
(2013).
[140] B. D. Adamson, N. J. A. Coughlan, G. da Silva, and E. J. Bieske.
Photoisomerization Action Spectroscopy of the Carbocyanine Dye DTC+
in the Gas Phase. J. Phys. Chem. A, 117: 13319–13325 (2013).](https://image.slidesharecdn.com/683d4131-560b-40b7-aabd-4b72f336e72f-161214213503/85/Phd-thesis-Jorgen-Houmoller-final-133-320.jpg)


![the valence orbitals in Figure 1). For the ortho and para isomers,
there exists an important resonance structure in which the
negative charge is moved from the phenolate oxygen to the nitro
group, and as a result of this strong coupling between the donor
and acceptor states, the absorption is shifted much further to the
blue than for the isolated meta ion, as recently reported.11
Hence,
m−
is an excellent and well-defined model system for testing the
importance of microsolvation on the CT transition energy. Also
the ion is small enough to allow for high-level quantum-chemical
calculations and a benchmarking of these by comparison to
experimental results. Here we report the results from a joint
spectroscopic and theoretical characterization of m-nitro-
phenolate with a single water, methanol, or acetonitrile molecule
attached. Water and methanol can make hydrogen bonds to the
phenolate oxygen, while acetonitrile binds more as a dipole.
We note that gas-phase electronic absorption spectroscopy has
earlier been done on several microsolvated protonated molecules
such as amino acids, crystal violet, and polycyclic aromatic
hydrocarbons12
as well as metal cations and metal-ion
complexes.13
Also the cross sections for photodetachment as
functions of wavelength have been measured for anion
complexes,14
as have photodestruction spectra of hydrated
electron clusters.15
Action spectroscopy experiments were done in the present
work with a home-built mass spectrometer.16
m-Nitrophenolate
was purchased from Sigma-Aldrich, and ions were formed by
electrospray ionization of the sample dissolved in acetonitrile.
They were passed through an octopole transmission guide
surrounded by a chamber with a gas inlet, where they were
allowed to undergo ion−molecule reactions. The chamber was
filled with water, methanol, or acetonitrile at a pressure of at least
0.01 mbar. All ions were collected in a 14-pole ion trap filled with
helium buffer gas at room temperature. The trap was emptied
with a repetition rate of 40 Hz, and the ion bunches were
accelerated to kinetic energies of 50 keV. Those of interest
according to m/z ratio were selected by a bending magnet, and
every second ion bunch was photoexcited by light from an
EKSPLA laser system operated at 20 Hz. In this laser system, the
1064 nm fundamental of an Nd:YAG laser was frequency-tripled
to give 355 nm light, which was used to pump an optical
parametric oscillator to produce visible light. Photofragment ions
were selected by a hemispherical electrostatic analyzer (ESA)
and counted by a channeltron detector. As the binding energies
of the complexes are less than 1 eV (vide infra), the dissociation is
expected to be complete before arrival at the analyzer (travel time
of a couple of microseconds), avoiding kinetic shifts for which
corrections must be made in cases where the dissociation time
constant is long. Thus, even though the yield of complexes is low,
the experiment benefits from complete photodissociation. We
measured a low yield of fragment ions when the laser was off,
which was due to collisions with residual gas in the beamline.
This signal was proportional to the parent ion beam current but
was too low to correct for ion-beam fluctuations. The experiment
was therefore repeated several times to average out these
fluctuations. The “laser-off” signal was, however, subtracted from
the “laser-on” signal to obtain a pure photoinduced yield of
fragment ions. The laser wavelength was scanned from 420 to
700 nm. At each wavelength, the number of injections was at least
500.
Photodissociation of the bare m−
ion led to several fragment
ions (Figure 2a) that were formed after the absorption of two
photons. The dominant fragment ions were NO2
−
(m/z 46) and
ions formed by the loss of NO (m/z 108), NO2 (m/z 92), or CO
and NO (m/z 80). Photodissociation mass spectra of the
complexes of m−
with a solvent molecule [denoted as
m−
(solvent)] were also recorded to identify the fragment ions.
The most dominant fragment was the bare ion (m/z 138) formed
by evaporation of the solvent molecule [e.g., for m−
(CH3CN),
see Figure 2b]. Its yield increased linearly with laser power [see
the Supporting Information (SI)], and one photon was therefore
sufficient for the dissociation. This indicates that the dissociation
energies are less than the photon energies (>2 eV). Indeed, the
solvent binding energies calculated using DFT (PBE0 functional,
aug-cc-pVDZ basis set; see Table S1 in the SI) were 0.64, 0.71,
and 0.55 eV for water, methanol, and acetonitrile, respectively.
These calculations were performed with TURBOMOLE.17
Similar binding energies were predicted by Zuev et al.6
for
complexes of water with the PYP and green fluorescent protein
(GFP) anions in their phenolate forms. When zero-point
vibrational energy and corrections for the basis-set superposition
error were included,18
we obtained binding energies of 0.54, 0.65,
and 0.50eV, respectively. For a simple dissociation process in
which one bond is cleaved, the barrier for the reverse reaction is
low or zero. Hence, the dissociation energy is similar to the
activation energy, and the excess energy after photoexcitation is
at least 1 eV (photon energy minus dissociation energy). It can
therefore be assumed that all of the photoexcited ions dissociated
within the experimental time window of a few microseconds. The
action spectra of the complexes are therefore good representa-
tions of the corresponding gas-phase absorption spectra.
Photoexcitation of m−
(CH3OH) at high laser power also led to
OH loss and dissociation of the nitrophenolate ion via two-
photon processes.
The action spectra of the complexes are shown in Figure 3
together with the previously reported spectrum for the bare
ion.11
The band maxima and shifts relative to the bare ion are
summarized in Table 1. The bare ion absorbs maximally at 2.34
eV (530 nm), and it is clearly evident that a single solvent
molecule causes a blue shift in the absorption. It is worth
Figure 1. (a) Structure of the m-nitrophenolate anion. (b) Frontier
natural orbitals from the state-averaged (S0 and S1) MR-DDCI2 density
matrix (data from ref 11).
Figure 2. Photodissociation mass spectra of (a) bare m−
and (b)
m−
(CH3CN) obtained with 510 and 500 nm light, respectively.
Journal of the American Chemical Society Communication
dx.doi.org/10.1021/ja4025275 | J. Am. Chem. Soc. 2013, 135, 6818−68216819
II](https://image.slidesharecdn.com/683d4131-560b-40b7-aabd-4b72f336e72f-161214213503/85/Phd-thesis-Jorgen-Houmoller-final-144-320.jpg)
![emphasizing that the band shapes of the bare ion and the
complexes are very similar and can be approximated by
Gaussians with band widths of ∼0.4 eV.
The shifts for water and methanol are the same [0.22 eV (45
nm)], and that for acetonitrile is about a factor of 2 smaller [0.12
eV (25 nm)]. In all three cases, the solvatochromic shift is merely
a fraction of the solvent binding energy, with that of acetonitrile
being the smallest (24%). Obviously, the strong hydrogen bonds
formed with water and methanol (Figure 4) cause a stronger
perturbation of the electronic structure of the chromophore than
the interaction with acetonitrile. The latter still achieves a
comparable binding energy, as it has the largest dipole moment
and polarizability. Water has a slightly larger dipole moment than
methanol, whereas methanol has a larger polarizability and forms
a slightly stronger hydrogen bond (Figure 4), but the shifts are
similar.
We also calculated vertical excitation energies at the CC2 level
of theory using the optimized structures shown in Figure 4 (see
Table 1). For the bare ion as well as the three complexes, the
obtained values are ∼0.1 eV higher in energy than the
experimental absorption maxima, but the solvation shifts agree
rather well (0.25, 0.26, and 0.17 eV for water, methanol, and
acetonitrile, respectively). This result is satisfactory; the
deviation of 0.1 eV is within the typical error of the CC2
method.19
Moreover, an inhomogeneous line broadening can be
expected because of the orientational flexibility of the solvent
molecule at room temperature, which is not taken into account
by the calculations. We note that in the case of water binding to
the PYP anion, Krylov and co-workers6
predicted a blue shift of
0.06 eV for the phenolate (electron donor) site and a red shift of
0.07 eV when water binds to the carboxyl group. When we placed
the solvent molecule at the nitro group of m−
, we obtained red
shifts of 0.27 and 0.25 eV for methanol and acetonitrile,
respectively, demonstrating the strong CT character of the
electronic transition in m−
compared with that in the PYP anion.
Figure S4 in the SI shows that the density changes upon
excitation are essentially localized on the phenolate oxygen and
the nitro group. This is consistent with the observed strong
perturbation due to hydrogen bonds.
In bulk acetonitrile solution, the absorption band maximum is
at 2.62 eV (473 nm), which represents a blue shift of 0.28 eV
relative to the bare ion. Interestingly, almost half of this shift is
caused by a single solvent molecule, which clearly demonstrates
the importance of the nearby environment on the electronic
structure of the ions. In the protic solvents water and methanol,
the band maxima are at 3.18 eV (390 nm) and 3.20 eV (387 nm),
respectively. Hence, full completion of the solvation shell in these
two solvents induces a larger blue shift than in acetonitrile. This is
most likely linked to the fact that the phenolate oxygen can
hydrogen-bond to two or three water or methanol molecules,
rendering a CT excitation less favorable.
Finally, we did measurements on the bare m−
ion at another
setup, the electrostatic ion storage ring in Aarhus (ELISA), where
neutrals were measured instead of ionic fragments.20
Ion
bunches were stored in the ring for 24 ms before being irradiated
with laser light. Neutrals produced within ∼10 μs were counted
by a secondary emission detector (SED). The obtained yield of
photoneutrals as a function of wavelength is shown in Figure 5
together with the spectrum from Figure 3. The spectra follow
each other nicely on the low-energy side from ∼2.3 eV and down.
In the 2.4−2.7 eV region, the yield of photoneutrals decreases
with energy, but the relative yield is higher than in the
photofragment ion experiment. At higher energies, the yield
increases. A power dependence study at 2.95 eV (420 nm)
revealed that the signal is mainly due to the absorption of two
photons, though some contribution from one-photon absorption
cannot be excluded (see the SI). We calculated the vertical
detachment energy to be 2.98 eV, and we assign the signal to
electron photodetachment of hot m−
anions, as this would
account for the asymmetry of the absorption band and a skewing
toward the blue. The band maximum from this experiment is at
∼2.4 eV. Taken together, we estimate the experimental
uncertainty in the band maximum to be 0.05 eV.
In conclusion, we have shown that the attachment of single
solvent molecules of water, methanol, and acetonitrile causes
Figure 3. Action spectra of (a) bare m−
, (b) m−
(H2O), (c)
m−
(CH3OH), and (d) m−
(CH3CN). Gaussian curves are included to
guide the eye. The red sticks show CC2-calculated values. The blue
dashed curve in (d) is the spectrum in bulk acetonitrile solution.
Table 1. Absorption Band Maxima (λmax) and Shifts from the
Bare Ion (Δ)
ion λmax (nm)a
λmax (eV)a
Δ (eV)a
λmax (eV)b
Δ (eV)b
m−
530 2.34 2.41
m−
(H2O) 485 2.56 0.22 2.65 0.25
m−
(CH3OH) 485 2.56 0.22 2.67 0.26
m−
(CH3CN) 505 2.46 0.12 2.58 0.17
a
From experiment (Figure 3). b
CC2-calculated.
Figure 4. Minimum-energy structures of m−
(H2O), m−
(CH3OH), and
m−
(CH3CN) calculated at the MP2 level using the TZVPP basis set.
Hydrogen-bond distances in Å are given.
Journal of the American Chemical Society Communication
dx.doi.org/10.1021/ja4025275 | J. Am. Chem. Soc. 2013, 135, 6818−68216820
II](https://image.slidesharecdn.com/683d4131-560b-40b7-aabd-4b72f336e72f-161214213503/85/Phd-thesis-Jorgen-Houmoller-final-145-320.jpg)


![Action spectra of the complexes are shown in Figure 5. These
were obtained as laser-on signal minus laser-off signal followed
by a linear correction for the number of photons at each
wavelength. The band maximum is at 3.01 eV (412 nm) for o·
H2O (Figure 5a) and at 3.00 eV (413 nm) for p·H2O (Figure
5b).
It is evident that the water complexes absorb further to the
red than the bare chromophores. The redshift for the para
isomer [0.13 eV (17 nm)] is greater than that for the ortho
isomer [0.10 eV (13 nm)]. The fact that a redshift is seen can
be explained by the lesser degree of coupling between the
donor and acceptor orbitals in the complexes. Judged by the
calculated ground-state geometries (Figure 4), it is clear that
the overall perturbing effect of the water molecule for the ortho
isomer must be less than that for the para case because both the
donor and acceptor groups are in close proximity to the water;
this is in accordance with the measured redshifts.
For o·H2O and p·H2O, we calculated vertical detachment
energies of 3.75 and 3.83 eV, respectively, which is ca. 0.5 eV
higher than those reported for the bare anions.7
Importantly,
these detachment energies are well above the absorption band
maxima by more than 0.7 eV, and electron detachment is
therefore not expected to be an important channel close to the
band maxima.
In aqueous solution, the absorption band maxima of o and p
are at 3.00 eV (415 nm, Figure 5a) and 3.11 eV (399 nm,
Figure 5b), respectively. Interestingly, for p the shift by one
single water molecule is larger than that after full hydration.
Indeed, the absorption by the bare ion and p(aq) is very similar;
full hydration redshifts the band by only 0.03 eV (4 nm). This
can easily be rationalized: in the fully hydrated ion, there are
water molecules both at the phenolate oxygen and the nitro
group, and the donor and acceptor orbitals are therefore
coupled, as they are in the bare ion. Interestingly, for the ortho
isomer, the shift corresponding to bulk solution can be ascribed
mainly to the effect from binding a single water molecule.
Furthermore, fully hydrated o absorbs to the red of p(aq). A
polarization effect can account for this: in general, an excited
state is more polarizable than a ground state, and movement of
electron density toward the water dipoles would bring down
the excited-state energy of o(aq) (the dipoles at the phenolate
oxygen and the nitrogen group point in similar direction). A
movement of electron density in the para isomer would be
beneficial for some water molecules but not for others; the
water dipole moments are pointing in different directions at the
phenolate oxygen end and the nitro group end.
To see if theory can account for the observed hydration
effects, we performed a series of quantum chemical calculations
at various levels of theory. On the basis of the minimum-energy
geometries, representing the anions and their microhydrated
complexes at the 0 K limit (Figure 4), we calculated VEEs with
the CC2, ADC(2), SORCI, and NEVPT2 methods (summar-
ized in Table 1). The first three methods provide excitation
energies that maximally differ by 0.25 eV compared to
experimental values, while the deviation is as much as 0.5 eV
for NEVPT2. All methods consistently predict a small blueshift
of both complexes compared to the solute in vacuo.
Nevertheless, this shift is much smaller than that earlier
reported for the meta isomer: 0.05 eV for ortho, 0.24 eV for
meta, and 0.06 eV for para (CC2 method). Hence, theory is in
accordance with a decoupling of donor and acceptor orbitals in
ortho and para isomers upon water attachment, accounting for a
shift that is smaller than that seen for the meta isomer. The
relative importance between decoupling (giving a redshift) and
loss of complex binding energy upon photoexcitation (electro-
static effect giving a blueshift) is, however, not correctly
predicted.
Krylov and co-workers12
reported on the effect of attachment
of a single water molecule to the isolated chromophore anions
of GFP and PYP proteins. They used as model systems
deprotonated 4-hydroxybenzylidene-2,3-dimethylimidazolinone
(HBDI) and deprotonated para-coumaric acid (pCA) to
represent the chromophores in GFP and PYP, respectively.
SOS-CIS(D)/cc-pVTZ-calculated VEEs for the HBDI anion
and EOM-EE-CCSD/6-31+G(d,p) ones for the pCA anion
revealed small blueshifts of 0.03 and 0.06 eV, respectively, due
to the water (in both cases phenolate form of chromophore).
These shifts are similar to what we calculate for o and p.
We also modeled the fully hydrated solute (see Computa-
tional Details). Full hydration yields a redshift relative to the
bare ion, which varies with the quantum chemistry method, but
in all cases is larger for p than for o (Table 1). As seen
Figure 5. Action spectra of (a) o·H2O and (b) p·H2O. To help guide
the eye, a five-point average curve (gray) is superimposed on the data.
The blue curves are the absorbance spectra obtained in alkaline
aqueous solution (pH 10) (the pKa of both o-nitrophenol and p-
nitrophenol is 7.2). The thick red vertical lines in the bottom of the
spectra mark the CC2-calculated band maxima; the full lines are for
the water complexes; and the broken lines are for the bare
chromophores. The band maxima for the bare chromophores are
marked by the broken vertical lines that span the whole height of the
figures.
Table 1. Summary of Experimental Band Maxima and
Calculated Vertical Excitation Energies (in Electronvolts)
experimental λmax CC2 ADC(2) SORCI NEVPT2
o 3.11 3.15 3.02 3.00 3.24
o·H2O 3.01 3.20 3.06 3.05 3.29
o(aq) 3.00 2.76 2.96 3.16
p 3.16 3.27 3.10 3.11 3.38
p·H2O 3.00 3.33 3.16 3.23 3.50
p(aq) 3.11 2.77 2.98 3.25
The Journal of Physical Chemistry A Article
DOI: 10.1021/acs.jpca.5b08634
J. Phys. Chem. A 2015, 119, 11498−11503
11501
III](https://image.slidesharecdn.com/683d4131-560b-40b7-aabd-4b72f336e72f-161214213503/85/Phd-thesis-Jorgen-Houmoller-final-150-320.jpg)

![(2) Brøndsted Nielsen, S.; Brøndsted Nielsen, M.; Rubio, A.
Spectroscopy of Nitrophenolates in Vacuo: Effect of Spacer,
Configuration, and Microsolvation on the Charge-Transfer Excitation
Energy. Acc. Chem. Res. 2014, 47, 1417−1425.
(3) Alata, I.; Broquier, M.; Dedonder-Lardeux, C.; Jouvet, C.; Kim,
M.; Sohn, W. Y.; Kim, S.; Kang, H.; Schütz, M.; Patzer, A.; Dopfer, O.
Microhydration Effects on the Electronic Spectra of Protonated
Polycyclic Aromatic Hydrocarbons: [Naphthalene-(H2O)n=1,2]H+
. J.
Chem. Phys. 2011, 134, 074307.
(4) Dopfer, O.; Patzer, A.; Chakraborty, S.; Alata, I.; Omidyan, R.;
Broquier, M.; Dedonder, C.; Jouvet, C. Electronic and Vibrational
Spectra of Protonated Benzaldehyde-Water Clusters, [BZ-(H2O)(n≤5)]
H+
: Evidence for Ground-State Proton Transfer to Solvent for n ≥ 3. J.
Chem. Phys. 2014, 140, 124314.
(5) Niwa, H.; Inouye, S.; Hirano, T.; Matsuno, T.; Kojima, S.;
Kubota, M.; Ohashi, M.; Tsuji, F. I. Chemical Nature of the Light
Emitter of the Aequorea Green Fluorescent Protein. Proc. Natl. Acad.
Sci. U. S. A. 1996, 93, 13617−13622.
(6) Nielsen, S. B.; Lapierre, A.; Andersen, J. U.; Pedersen, U. V.;
Tomita, S.; Andersen, L. H. Absorption Spectrum of the Green
Fluorescent Protein Chromophore Anion in Vacuo. Phys. Rev. Lett.
2001, 87, 228102.
(7) Sinicropi, A.; Andruniow, T.; Ferre, N.; Basosi, R.; Olivucci, M.
Properties of the Emitting State of the Green Fluorescent Protein
Resolved at the CASPT2//CASSCF/CHARMM Level. J. Am. Chem.
Soc. 2005, 127, 11534−11535.
(8) Bravaya, K.; Khrenova, M. G.; Grigorenko, B. L.; Nemukhin, A.
V.; Krylov, A. I. Effect of Protein Environment on Electronically
Excited and Ionized States of the Green Fluorescent Protein
Chromophore. J. Phys. Chem. B 2011, 125, 8296−8303.
(9) Gromov, E. V.; Burghardt, I.; Köppel, H.; Cederbaum, L. S.
Electronic Structure of the PYP Chromophore in its Native Protein
Environment. J. Am. Chem. Soc. 2007, 129, 6798−6806.
(10) Gromov, E. V.; Burghardt, I.; Köppel, H.; Cederbaum, L. S.
Native Hydrogen Bonding Network of the Photoactive Yellow Protein
(PYP) Chromophore: Impact on the Electronic Structure and
Photoinduced Isomerization. J. Photochem. Photobiol., A 2012, 234,
123−134.
(11) de Groot, M.; Gromov, E. V.; Köppel, H.; Buma, W. J. High-
Resolution Spectroscopy of Methyl 4-Hydroxycinnamate and its
Hydrogen-Bonded Water Complex. J. Phys. Chem. B 2008, 112, 4427−
4434.
(12) Zuev, D.; Bravaya, K. B.; Makarova, M. V.; Krylov, A. I. Effect of
Microhydration on the Electronic Structure of the Chromophores of
the Photoactive Yellow and Green Fluorescent Proteins. J. Chem. Phys.
2011, 135, 194304.
(13) Philip, A.; Eisenman, K.; Papadantonakis; Hoff, W. Functional
Tuning of Photoactive Yellow Protein by Active Site Residue 46.
Biochemistry 2008, 47, 13800−13810.
(14) Navizet, I.; Liu, Y. J.; Ferré, N.; Xiao, H. Y.; Fang, W. H.; Lindh,
R. Color-Tuning Mechanism of Firefly Investigated by Multi-
Configurational Perturbation Method. J. Am. Chem. Soc. 2010, 132,
706−712.
(15) Cai, D.; Marques, M. A. L.; Milne, B. F.; Nogueira, F.
Bioheterojunction Effect on Fluorescence Origin and Efficiency
Improvement of Firefly Chromophores. J. Phys. Chem. Lett. 2010, 1,
2781−2787.
(16) Støchkel, K.; Hansen, C. N.; Houmøller, J.; Nielsen, L. M.;
Anggara, K.; Linares, M.; Norman, P.; Nogueira, F.; Maltsev, O. V.;
Hintermann, L.; Brøndsted Nielsen, S.; Naumov, P.; Milne, B. F. On
the Influence of Water on the Electronic Structure of Firefly
Oxyluciferin Anions from Absorption Spectroscopy of Bare and
Monohydrated Ions in Vacuo. J. Am. Chem. Soc. 2013, 135, 6485−
6493.
(17) Wanko, M.; Houmøller, J.; Støchkel, K.; Kirketerp, M.-B. S.;
Petersen, M. Å.; Brøndsted Nielsen, M.; Brøndsted Nielsen, S.; Rubio,
A. Substitution Effects on the Absorption Spectra of Nitrophenolate
Isomers. Phys. Chem. Chem. Phys. 2012, 14, 12905−12911.
(18) Houmøller, J.; Wanko, M.; Støchkel, K.; Rubio, A.; Brøndsted
Nielsen, S. On the Effect of a Single Solvent Molecule on the Charge-
Transfer Band of a Donor-Acceptor Anion. J. Am. Chem. Soc. 2013,
135, 6818−6821.
(19) Støchkel, K.; Milne, B. F.; Brøndsted Nielsen, S. Absorption
Spectrum of the Firefly Luciferin Anion Isolated in Vacuo. J. Phys.
Chem. A 2011, 115, 2155−2159.
(20) Wyer, J. A.; Brøndsted Nielsen, S. Absorption by Isolated Ferric
Heme Nitrosyl Cations In Vacuo. Angew. Chem., Int. Ed. 2012, 51,
10256−10260.
(21) TURBOMOLE V7.0 2015, a development of University of
Karlsruhe and Forschungszentrum Karlsruhe GmbH, 1989−2007;
TURBOMOLE GmbH: Karlsruhe, Germany; since 2007.
(22) Christiansen, O.; Koch, H.; Jørgensen, P. The 2nd-Order
Approximate Coupled-Cluster Singles and Doubles Model CC2.
Chem. Phys. Lett. 1995, 243, 409−418.
(23) Schirmer, J. Beyond the Random-Phase Approximation - A New
Approximation Scheme for the Polarization Propagator. Phys. Rev. A:
At., Mol., Opt. Phys. 1982, 26, 2395−2416.
(24) Neese, F. A Spectroscopy Oriented Configuration Interaction
Procedure. J. Chem. Phys. 2003, 119, 9428−9443.
(25) Angeli, C.; Cimiraglia, R.; Evangelisti, S.; Leininger, T.; Malrieu,
J. P. Introduction of n-Electron Valence States for Multireference
Perturbation Theory. J. Chem. Phys. 2001, 114, 10252−10264.
(26) Neese, F. The ORCA program system. WIREs Comput. Mol. Sci.
2012, 2, 73−78.
The Journal of Physical Chemistry A Article
DOI: 10.1021/acs.jpca.5b08634
J. Phys. Chem. A 2015, 119, 11498−11503
11503
III](https://image.slidesharecdn.com/683d4131-560b-40b7-aabd-4b72f336e72f-161214213503/85/Phd-thesis-Jorgen-Houmoller-final-152-320.jpg)

![that remains synthetically inaccessible. Under controlled
conditions, the lumophore (OxyLH2) can be stabilized in the
ground state for a reasonably long time, but the ground-state
structure does not provide direct insight into the excited-state
dynamics.13−15
A large number of theoretical studies have also
been performed with the aim of elucidating details of the
factors controlling BL (for recent reviews, see Navizet (2011),16
Hosseinkhani (2011),17
and da Silva (2011)18
). These studies
have increased in complexity since initial gas-phase calculations
and now routinely include solvent effects, either implicitly
through the use of continuum dielectric models, or by explicit
inclusion of solvent molecules19,20
(the results of Min et al.20
relate directly to the excited state of oxyluciferin) and even
reduced models of the luciferase microenvironment;21−24
the
spectrochemistry of OxyLH2 has been experimentally estab-
lished only in neat solutions.14,15
Most theoretical consid-
erations of the effects of the luciferase framework are limited to
the relevant amino acid residues from the crystal structures of
luciferases from Luciola cruciata25
or Photinus pyralis.26
Recent
results, however, suggest significant reorganization of the
microenvironment during the lumophore deexcitation, thus
questioning some earlier mechanistic inferences based on the
ground-state structure of the luciferase−oxyluciferin complex,
[(Luc)(OxyLH2)].24
Unlike fireflies (Lampyridae), which communicate the
characteristic bursts of yellow-green light, and despite the fact
that they utilize identical lumophore, some species of click
beetles (Elateridae) emit orange light, while certain railroad
worm species (Phengodidae) luminesce in the red region.
These shifts in the emission color were successfully mimicked
by deliberate point mutations in the Lampyridae luciferase
family, and the wavelength of emission can be artificially tuned
to values between 530 and 640 nm. As many as six mechanisms
have been advanced to explain the molecular origin of this
phenomenon, although without a consensus on its origin. The
suggested mechanisms include keto−enol tautomerization,
molecular twisting in excited state, effects of microenvironment
(including deprotonation of the phenol functionality) and
tautomerization/deprotonation of the hydroxythiazole frag-
ment, stabilization by charge resonance, conformational
changes in the active pocket, and concomitant modulation of
polarity and covalency of an emitter−cation ion-pair.
Experimental and theoretical contra-arguments have been
subsequently advanced that discredit each of these mechanisms.
Despite the numerous attempts and various experimental and
theoretical approaches, due to lack of photophysical data on the
excited lumophore free from environment effects, this conun-
drum remains unresolved.
A direct experimental spectrochemical benchmark of a single
excited molecule (OxyLH2)* in vacuo could end the long-term
dispute. Indeed, the spectrochemical effects from the environ-
ment exerted by the amino acid residues or water molecules in
the luciferase active pocket could be directly assessed against
the spectral fingerprint of the bare ion if the latter were to be
isolated in the absence of intermolecular interactions. This
approach represents a simple, yet critically important starting
point to understand the true reasons behind the color tuning
and is the one we have taken here to shed light on this problem.
Computational studies have previously highlighted the
importance of water molecules in the firefly oxyluciferin
system,23,27,28
and it was recently proposed14
that a single
water molecule in the protein cavity could have a profound
effect on the photophysical properties of the emitter and its
dynamics. Theoretical investigations of interactions between
oxyluciferin and components of the luciferase active site in
available crystal structures support the importance of water
molecules in terms of their energetic effect on the emitter.18,27
To verify this hypothesis, using a special experimental setup, we
utilize here action spectroscopy of the ionized firefly emitter
OxyLH−
and its ion-complex [(OxyLH)(H2O)]−
to elucidate
the spectrochemical consequences of a single water molecule
on the isolated ion in vacuo. The 5,5-dimethyloxyluciferin
anion (DMOxyL−
) was also included to provide a color-shift
standard free of the potential variability of the gas phase
[(OxyLH)(H2O)]−
complex. Finally, we note that recent
theoretical work by Navizet et al.29
supports the use of the
isolated oxyluciferinate anion as a model for the firefly
lumophore because their results indicate that the light emitter
is the same after chemical decomposition of firefly dioxetanone
(either in vacuo or within the protein) to that obtained after
photoexcitation of oxyluciferin.
In our experiment, we probe absorption and not light
emission because the ion density is too low to result in enough
emitted photons for detection. Indeed, the ion density is also
insufficient for conventional light transmission experiments that
are normally used to obtain absorption spectra, and this
constitutes a significant barrier to the measurement of
absorption by ions in vacuo. Instead, gas-phase ion spectros-
copy relies on ionic dissociation driven by light absorption. In
our setup, such action spectroscopy on macromolecular ions is
realized by combining an electrospray ion source, electrostatic
ion storage ring, and pulsed lasers. The setup has already
provided valuable information on the light absorption by
several chromophore ions, ionic GFP chromophore, protonated
retinal Schiff bases, heme, porphyrin, and peptides,30−35
and the
bioluminescence precursor, the D-(−)-luciferinate anion,
LH−
.36
Recently, we have also modified an accelerator mass
spectrometer (sector instrument) to perform gas-phase spec-
troscopy experiments. While delayed dissociation on time scales
of hundreds of microseconds to tens of milliseconds is
monitored in the ring experiment, fast dissociation occurring
within a few microseconds is probed by the accelerator mass
spectrometer. These complementary techniques were em-
ployed here to record the action spectra of isolated anions of
OxyLH2 and its complex with a single water molecule. These
ground-state absorption data are indispensable direct bench-
marks against which the theoretical models commonly used in
studies of the excited-state structure of the firefly emitter can be
assessed for the first time free from interferences by the
complex structure of the luciferase active site. If such models
can correctly predict the absorption by oxyluciferin and the
influence of a microenvironment, they are likely also capable of
providing useful information regarding microenvironmental
effects in the emission spectra.
■ RESULTS AND DISCUSSION
Isolated OxyLH−
and DMOxyL−
Anions. First, we
present the results from the storage ring experiments, where
neutrals produced as a result of dissociation are monitored as a
function of time. Time spectra obtained after photoexcitation in
the ring of the OxyLH−
ion (m/z = 249) at 490, 530, and 580
nm, shown in Figure 1, confirm that the photoinduced
dissociation is nearly complete after 400 μs. This time is
much shorter than the storage time in the ring (∼0.3 s). The
revolution time of the ions is 64 μs. The neutrals that gave rise
to the count rate were produced ∼19 μs after the photo-
Journal of the American Chemical Society Article
dx.doi.org/10.1021/ja311400t | J. Am. Chem. Soc. 2013, 135, 6485−64936486
IV](https://image.slidesharecdn.com/683d4131-560b-40b7-aabd-4b72f336e72f-161214213503/85/Phd-thesis-Jorgen-Houmoller-final-154-320.jpg)
![excitation in the first instance (first point in the time spectrum),
and then after successive rotations in the ring. According to a
power dependence study, the first point is due to neutrals
formed from ions that have either absorbed one or two
photons, whereas the following points are due to one-photon
absorption. The contribution of the two-photon absorption to
the first point increases with wavelength because lower
excitation energies allow more ions to survive the travel from
the laser-irradiated region to the opposite side of the ring where
their decay is sampled. At high laser powers, the photoyield of
neutrals saturates. To avoid such saturation effects and to
minimize two-photon absorption, the power was attenuated
during wavelength scans, and the first point was not included in
the analysis. The subsequent five points were summed
excluding the background of neutrals formed as a result of
collisions with residual gas in the ring (see Figure 1a). The yield
of photoneutrals was then divided by the background count to
correct for variations in the ion beam intensity and the number
of photons in the laser pulse. This action signal is taken to
represent the relative absorption cross section. Figure 2a shows
the cross sections versus wavelength. The spectrum displays a
broad band with λmax between 535 and 555 nm with fwhm (full
width at half maximum) of 95 nm.
Next, we consider the results from the single-pass experi-
ments with the accelerator mass spectrometer. Here, ionic
fragments formed up to 3 μs after photoexcitation were
sampled, in contrast to the storage ring experiment where
delayed dissociation was monitored on a much longer time
scale. Photoexcitation leads to one dominant fragment anion at
m/z = 175 and a minor one at m/z = 206 that correspond to
loss of C2H2SO (mass 74) and C2H3O (mass 43), respectively.
These are both formed as a result of two-photon absorption, in
agreement with the time-spectra discussed above (the one-
photon absorption is excluded in this experiment based on the
narrow temporal window for dissociation). We assign the m/z
= 175 fragment to deprotonated 2-cyano-6-hydroxybenzothia-
zole. Interestingly, this molecule is a breakdown product in the
reactions between the oxyluciferin and water within the enzyme
cavity required for repetitive flashing of the firefly emission.37
The yields of each of the two fragment ions were measured
as a function of the wavelength to give action spectra after
correcting for ion beam fluctuations and number of photons in
the laser pulses. The action spectrum based on the m/z = 175
fragment ion (Figure 2b) is similar to that obtained from the
ring experiment: It displays a broad band with λmax between 540
and 560 nm (Figure 2a). The spectrum based on the m/z = 206
ion (not shown) is similar but of worse quality due to much
lower ion yields. Taken together, the results show that the bare
oxyluciferinate anion OxyLH−
absorbs maximally at 548 ± 10
nm, and that the absorption spectrum is broad (fwhm of 95
nm). We note that the absorption band of OxyLH−
is only
slightly red-shifted as compared to that of LH−
(532 nm)
reported earlier36
despite the greater electron delocalization
expected in the former. The excess electron density in OxyLH−
can be located at either oxygen (two limiting resonance
structures), while the carboxylate group in LH−
is not
conjugated with the ring π-electrons.
According to our calculations, the dominant tautomer of the
oxyluciferinate ions isolated in our ion beam at room
temperature is the keto form. As discussed later, the agreement
between the predicted and the measured absorption bands is in
strong support of this assignment. To ascertain the tautomer
identity, the measurements were repeated with the 5,5-
dimethylated oxyluciferinate anion (DMOxyL−
m/z = 277)
where the molecule is locked as the keto tautomer by
substitution. The action spectrum obtained based on the m/z
= 175 fragment ion has a λmax = 540−570 nm (Figure 2d),
while the ring experiment provides λmax = 560−580 nm (Figure
2c). Our estimate of the band maximum is 565 ± 10 nm. The
red-shift of about 17 nm relative to OxyLH−
is in accordance
with the substitution effects observed in solution.14
The
calculated spectra described below confirm that this spectral
shift is due to substitution effects.
[(OxyLH)(H2O)]−
Complex Anion. The impact of a single
water molecule on the electronic structure of oxyluciferinate
anions was measured with the accelerator mass spectrometer.
While the photoinduced dissociation mass spectrum of bare
OxyLH−
was rather simple with two important fragment ions,
Figure 1. Time spectra of oxyluciferinate anions without laser
irradiation (a), and after photoexcitation at 490 nm (b), 530 nm
(c), and 580 nm (d). The spectrum in panel (a) is due to neutrals
formed after collisions between the ions and the residual gas in the
ring.
Journal of the American Chemical Society Article
dx.doi.org/10.1021/ja311400t | J. Am. Chem. Soc. 2013, 135, 6485−64936487
IV](https://image.slidesharecdn.com/683d4131-560b-40b7-aabd-4b72f336e72f-161214213503/85/Phd-thesis-Jorgen-Houmoller-final-155-320.jpg)
![many more dissociation channels are available for the
[(OxyLH)(H2O)]−
complex, including water loss, dissociation
of the bridge between the two heterocycles, and decomposition
of one of the rings. The water molecule remained bound to
several fragment ions. The dominant fragment ion had m/z =
150 and is ascribed to separation of the two heterocyclic rings.
The action spectra of each of the fragment ions are shown in
Figure 3 (insufficient background counts from collision-induced
dissociations prevented us from applying spectral corrections
for ion beam fluctuations). The count rates of the photo-
induced fragment ions were typically 1 s−1
, which placed a
practical burden on this experiment. Nevertheless, the spectra
are quite similar with λmax = 480−530 nm. The minor
differences may be related to the different structures of the
oxyluciferinate−water complexes in the ion beam that could
result in different dissociation pathways. Regardless of these
small differences, the spectra are conclusive that a water
molecule blue-shifts the absorption of the ion.
Theoretical Results. The optimized ground-state geo-
metries used in all calculations are shown in Figure 4. Details of
the optimization strategies and relative energies for different
conformational and configurational properties are dealt with in
the Methods section. These geometries were used for the
evaluation of several common methods for the calculation of
vertical electronic excitation energies.
The results of single-point EOM-CCSD and TDDFT
electronic absorption calculations are given in Table 1. With
the EOM-CCSD/Def2-TZVPPD method, a value of 481 nm
was obtained for the OxyLH−
excitation wavelength, as
compared to the experimental wavelength of 548 ± 10 nm.
At the EOM-CCSD level with the smaller Def2-SVPD basis set,
these values were red-shifted by only ∼0.01 eV, indicating that
the smaller basis set was capable of producing well-converged
results.
The reduced excitation level (REL) diagnostic gives a
measure of the character of a given excitation within the
EOM-CC framework. Values close to unity indicate predom-
inantly single-excitation character, while higher values indicate
multiexcitation character. In all calculations performed in the
present work, the excitations had REL values of 1.1 ± 0.02.
Therefore, the excitations observed in the oxyluciferin systems
possess predominantly single-excitation character, and all of the
relevant physics should be described accurately even with the
truncation of the coupled-cluster expansion at second order.38
Greater multielectron character, on the other hand, would have
required inclusion of triples excitations, e.g., using EOM-
CCSD(T).
Excellent agreement with the high-level EOM-CCSD result
came from the two hybrid functionals, B3LYP and CAM-
B3LYP, which also showed minimal changes on going from the
Def2-SVPD basis set to the much larger Def2-TZVPPD set.
However, the pure DFT functionals SVWN and BLYP were
found to provide excitation energies that were lower than that
obtained with EOM-CCSD and that in fact were in very good
agreement with experiment, giving errors for both functionals
relative to experiment of less than 10 nm. The fact that the
EOM-CCSD and hybrid TDDFT methods gave values that
were significantly blue-shifted relative to the experimental
OxyLH−
value suggested that the approximations used in the
calculations were neglecting some effects (e.g., vibronic effects)
that were important in the OxyLH−
system. The apparently
superior performance of the pure DFT functionals was most
Figure 2. Action spectra of oxyluciferinate and 5,5-dimethyloxyluciferinate anions obtained using two different instruments. OxyLH−
: (a) ELISA,
sampling of neutral fragments; (b) accelerator mass spectrometer, sampling of m/z = 175 fragment ions. DMOxyL−
: (c) ELISA, sampling of neutral
fragments; (d) accelerator mass spectrometer, sampling of m/z = 175 fragment ions. In the ELISA experiment, we detect neutrals traveling with high
kinetic energies as they deposit energy in the detector, but we have no mass information. The curves are Gaussian fits to the data.
Journal of the American Chemical Society Article
dx.doi.org/10.1021/ja311400t | J. Am. Chem. Soc. 2013, 135, 6485−64936488
IV](https://image.slidesharecdn.com/683d4131-560b-40b7-aabd-4b72f336e72f-161214213503/85/Phd-thesis-Jorgen-Houmoller-final-156-320.jpg)
![likely an example of fortuitous cancellation of errors in these
formally less sophisticated methods.
In relation to theoretical predictions of color-tuning effects in
BL, a more important set of results were the calculated shifts
relative to OxyLH−
for the [(OxyLH)(H2O)]−
and DMOxyL−
systems (Table 1). The EOM-CCSD/Def2-TZVPPD method
yielded a blue-shift of 10 nm for the [(OxyLH)(H2O)]−
complex and a red-shift of 3 nm for the DMOxyL−
anion,
which, although providing qualitatively correct predictions,
were approximately one-fifth of the size of the shifts observed in
the experimental spectra in both cases. Despite the large split
between the performance of the pure and hybrid functionals
seen in the TDDFT results for OxyLH−
, there was very little
difference in the predicted spectral shifts obtained from the four
functionals. All of the TDDFT-predicted shifts for DMOxyL−
were ±2 nm relative to EOM-CCSD, while the [(OxyLH)-
(H2O)]−
EOM-CCSD shift was underestimated by all of the
functionals except CAM-B3LYP, with BLYP performing worst.
That all of the methods used here were able to correctly predict
the sign of the spectral shift in these systems but failed to
deliver the correct magnitude is most likely an indication that
the sources of error mentioned above for OxyLH−
may become
even more critical in these systems due to the complexed water
molecule in [(OxyLH)(H2O)]−
and the addition of two
methyl groups in DMOxyL−
.
It is of interest to note that Min et al. performed calculations
to investigate the effect of explicit waters on the electronic
structure of oxyluciferinate anion at the TD-B3LYP/6-31+G-
(d,p)//B3LYP/6-31+G(d,p) level where they found that one
water molecule hydrogen-bonded to the phenolate oxygen
Figure 3. Action spectra of oxyluciferinate−water complexes obtained
using the accelerator mass spectrometer. The fragment ion masses are
indicated on each panel. The red curves are Gaussian fits to the data.
Figure 4. B3LYP/Def2-SVPD optimized structures of the three
systems studied.
Table 1. Calculated Absorption Energies for OxyLH−
,
[(OxyLH)(H2O)]−
, and DMOxyL−a
λabs (S1 ← S0)/nm
Def2-SVPD Def2-TZVPPD
OxyLH−
EOM-CCSD 478 477
SVWN 545 546
BLYP 540 542
B3LYP 490 491
CAM-B3LYP 464 466
[(OxyLH)(H2O)]−
EOM-CCSD 470 (−8) 467 (−10)
SVWN 541 (−4) 542 (−4)
BLYP 538 (−2) 539 (−3)
B3LYP 485 (−5) 487 (−4)
CAM-B3LYP 455 (−9) 458 (−8)
DMOxyL−
EOM-CCSD 481 (+3) 480 (+3)
SVWN 549 (+4) 550 (+4)
BLYP 544 (+4) 546 (+4)
B3LYP 493 (+3) 495 (+4)
CAM-B3LYP 466 (+2) 469 (+3)
a
Wavelength shifts relative to isolated OxyLH−
given in parentheses.
Journal of the American Chemical Society Article
dx.doi.org/10.1021/ja311400t | J. Am. Chem. Soc. 2013, 135, 6485−64936489
IV](https://image.slidesharecdn.com/683d4131-560b-40b7-aabd-4b72f336e72f-161214213503/85/Phd-thesis-Jorgen-Houmoller-final-157-320.jpg)
![(similar to [(OxyLH)(H2O)]−
in the present work (Figure 4))
caused a blue-shift of 2 nm in the predicted absorption.20
The
small difference between their blue-shift and our value of 5 nm
can be rationalized by the slightly different basis sets used in the
geometry optimizations and subsequent excitation calculations.
Min et al. included diffuse functions only on non-hydrogens
during the geometry optimizations and in the excitation
calculations (6-31+G(d,p)), whereas our basis set contained
diffuse functions on all atoms (Def2-SVPD).
Min et al. found that when the water molecule was located at
the opposite (keto) end of the anion this was found to produce
a 4 nm red-shift in the absorption. Thus, longitudinal
polarization of the anion in opposite directions was seen to
be capable of producing shifts either to higher or to lower
energy in the spectrum. This polarization effect was systemati-
cally investigated by the incremental application of electric
fields during real-space/time TDDFT calculations on the
oxyluciferinate anion by Cai et al., who also found that the
absorption peak could be shifted either to higher or lower
energies by the polarizing field.39
The redistribution of charge
density in the anion due to the electron-withdrawing inductive
(−I) effect associated with the methyl groups attached to the
thiazolone ring in DMOxyL−
might be expected to be
qualitatively similar to the effect of a water molecule
hydrogen-bonded to the keto oxygen, which is in keeping
with both our experimental and our theoretical data.
A further feature of the experimental spectra that was of
interest in terms of the performance of simulation techniques
was the significant peak-broadening. In an attempt to extend
the single-point static calculations in a way that might shed
more light on the origins of this broadening, molecular
dynamics (MD) simulations were performed for the three
oxyluciferin systems. The resulting composite spectra obtained
from TDDFT calculations on the sampled MD trajectories are
shown in Figure 5. Both the LDA (SVWN) and the CAM-
B3LYP functionals were used, representing the simplest and
most complex functionals employed in this study. Although the
single-point TD-LDA result for OxyLH−
was closest to
experiment, this was probably due to cancellation of errors at
the equilibrium geometry, which might not the case for the
distorted geometries obtained from the MD run. TD-CAM-
B3LYP performed well relative to the EOM-CCSD data, and its
better treatment of charge-transfer type excitations might be
important in the distorted geometries.
The spectral profiles obtained from the MD-averaged TD-
LDA calculations were found to fit well the degree of band
broadening observed experimentally. Differential changes in the
band maxima for the three systems enhanced the calculated
color shift by 2 nm for both [(OxyLH)(H2O)]−
and
DMOxyL−
leading to shifts of −6 and +6 nm, respectively,
relative to OxyLH−
.
The composite peaks obtained with the CAM-B3LYP
functional were slightly less broad than those obtained with
LDA. This may be due to a greater sensitivity to geometrical
distortion with the LDA functional leading to a greater spread
of the excitation energies. The individual excitations are shown
in Figure 5 as crosses, and tighter clustering of those obtained
with CAM-B3LYP is evident. The peak maxima in the CAM-
B3LYP case yielded a blue-shift of 7 nm for [(OxyLH)-
(H2O)]−
relative to OxyLH−
, but only a 1 nm red-shift for the
DMOxyL−
anion. These shifts relative to one another are in
better proportion for CAM-B3LYP (as compared to the
experimental shifts) than with LDA.
It is interesting to note that during the MD simulations the
maximum deviation from planarity of the oxyluciferins was of
the order of 10−20° in agreement with the DFT calculations
and confirming the quality of the force field parametrization (a
plot of the energy of rotation about the inter-ring carbon−
carbon bond in OxyLH−
is shown in Figure S2). These data
provided further evidence that only the low energy trans-form
should be populated at room temperature, in agreement with
the Boltzmann factor ratio given below (Methods section).
During the simulation started with the water molecule located
at the phenolate end of oxyluciferin, the water was seen to
migrate to the benzothiazole nitrogen in ∼10% of the snapshots
where the absorption was red-shifted to ∼590 nm. However,
the small percentage of snapshots where this occurred
combined with the fact that the oscillator strengths for the
excitation were lower than the average during the simulation
meant that this had a small effect on the overall spectrum.
Repeat simulations with the water molecule located initially at
the midpoint of the oxyluciferin or bound to the keto oxygen
were run, but in these cases the water rapidly migrated to the
phenolate group and remained there as was seen in the first
simulation.
Relation of Gas-Phase Data to Firefly Biolumines-
cence. All Lampyridae species naturally emit green-yellow
light, although at slightly different wavelengths. A consistent
property of the spatial disposition of the amino acids in the
active pocket of their luciferases is a “barrel” of low polarity,
which wraps the substrate/product, with the two termini being
exposed to polar environments. This provides a central
microenvironment with properties more comparable to the
gas phase than to bulk (aqueous) solvent. Photuris pennsylvanica
Figure 5. Composite TD-DFT spectra obtained from 300 ps
molecular dynamics simulations. Results obtained with the LDA
(SVWN) functional are shown in red, and those obtained with the
CAM-B3LYP functional are shown in blue. Spectral profiles were
obtained from sums of Lorentzian functions fit to individual excitations
(+), which were then normalized to put them on the same scale as the
single excitations.
Journal of the American Chemical Society Article
dx.doi.org/10.1021/ja311400t | J. Am. Chem. Soc. 2013, 135, 6485−64936490
IV](https://image.slidesharecdn.com/683d4131-560b-40b7-aabd-4b72f336e72f-161214213503/85/Phd-thesis-Jorgen-Houmoller-final-158-320.jpg)
![fireflies emit green light with a maximum at λmax
em
= 538 nm,
while the North American fireflies Photinus pyralis produce
yellow-green light at λmax
em
= 562 nm. Although they share a
significant portion of the Luc amino acid sequence with fireflies,
the railroad worms Phrixotrix hirtus produce red light with λmax
em
= 623 nm. For the bare ion, we observe broad absorption with a
maximum at λmax
abs
= 548 ± 10 nm. The typical Stokes shifts of
oxyluciferin in nonaqueous diluted solutions, as a very crude
estimate for the respective gas-phase values, range between 69
and 96 nm, with the values in solvents of low polarity being at
the higher end of this range.14
As the absorption sets a lower
limit for the wavelength of emitted light, the estimated emission
of the bare ion at 617−644 nm (orange or red) necessitates
inclusion of microenvironment effects to account for the
natural emission at lower wavelengths (green). Indeed, the
action spectra recorded here evidenced that addition of a single
water molecule blue-shifts the absorption by about 50 nm. A
single water molecule could blue-shift the Stokes-shifted
emission of the ion in vacuo to about 567−594 nm (i.e.,
green to yellow). The results of the present study suggest that
such a dynamic water molecule could make a significant
contribution to shifting the emission color of the oxyluciferinate
ion between green and red. Further support for this suggestion
can be found in the results of molecular dynamics simulations
of oxyluciferin in which the importance of water molecules in
modulating electronic structure in the ground and excited states
in the enzyme active site was highlighted.28,29
The crystal structure of the complex of Luciola cruciata
luciferase with oxyluciferin does not contain a water molecule
bound to the phenoxyl group of the lumophore.25
Several
waters are located nearby, but these are presumably strongly
constrained in the electrostatic environment of the pair of
arginine residues at the benzothiazole end of the active site.
However, the benzothiazole hydroxyl group in structures of
both wild-type and mutant luciferases in a complex with a
molecule that represents a model for the unstable intermediate
in the bioluminescence reaction is bound to a water molecule at
2.7 Å from the oxygen atom.25
Combined with the molecular
dynamics results mentioned above28,29
and the results of the
present work, this observation appears to support our proposal
that a dynamic water molecule could interact significantly with
the benzothiazole oxygen of oxyluciferin and may play an
important role in the color tuning of the firefly emission.
Another issue to consider is that the most favorable location
of the water may be different in the excited state than in the
ground state of the oxyluciferin anion. Because, in the biological
setting, the oxyluciferin anion is formed in its excited state, it is
possible that the water is located in a way that it stabilizes the
excited state more than the ground state. As a result, the water
molecule would then cause a red-shifted emission. In
accordance with this, Ai-min and co-workers20
predicted a 3
nm blue-shift in the emission upon binding of a single water
molecule to the benzothiolate oxygen, while the emission red-
shifted by 8 nm for water binding to the thiazole oxygen. In
other work,28
Song and Rhee calculated the average emission
energies (RI-CIS(D) without EOM-CCSD corrections) for
solvated oxyluciferin ion configurations that had one more
water on the thiazole oxygen than on the benzothiazole oxygen
(1.419 eV), the same number on both oxygens (1.429 eV), and
one more on the benzothiazole oxygen than on the thiazole
oxygen (1.449 eV). Even though the trends from these two
works are in accordance with our reasoning, the shifts are small.
Song and Rhee instead ascribed color modulation to nearby
charges, for example, the positively charged ammonium of a
protonated lysine residue or the negatively charged AMP.
An analysis of energetic interactions within the luciferase
active site by Milne et al. using the fragment molecular orbital
method supports the importance of both the charged species
and the active site water molecules in terms of their
(de)stabilizing effects on the oxyluciferin anion in the ground
state.27
However, because the theoretical models commonly
employed in this field of research in general appear to
underestimate the blue-shift in absorption by a single water
molecule, the influence on emission may also be under-
estimated. More work is clearly needed to fully address the role
of the nearby environment in fine-tuning the details of the
electronic transition between the ground and excited states of
this system.
■ CONCLUSION
The action spectra reported here provide the first experimental
evidence on the absorption by the singly charged oxy-
luciferinate anion and its complex with water isolated in
vacuo and demonstrated a strong perturbation of the electronic
structure by a single water molecule. A range of calculations
using methods of varying theoretical complexity uniformly
support the experimental data and were found to provide
reliable predictions of color-shifts in the [(OxyLH)(H2O)]−
and DMOxyL−
systems, although the magnitude of the shifts
was underestimated. We cannot from our absorption experi-
ments tell the exact role of a water molecule on the emission
but only speculate that its influence is large enough for color
modulation because it significantly perturbs the difference in
energy levels between ground and excited states when it binds
to the ground-state geometry. Obtaining quantitative agree-
ment with experiment from calculations on these ions is
nontrivial, and more work is needed to improve the theoretical
description. Importantly, for a theoretical model to be used to
shed light on microenvironmental effects in firefly lumines-
cence, it is required to provide the experimentally measured
energy difference between the ground and excited states of the
bare oxyluciferinate anion and the perturbation caused by a
water molecule bound to the ground-state geometry.
■ METHODS
Experimental Details. The setups used for gas-phase spectrosco-
py have been described in detail elsewhere,30−36,40,41
and only a brief
description is given below. Oxyluciferin and 5,5-dimethyloxyluciferin,
prepared as described before,14
were dissolved in methanol and
electrosprayed. Ions were accumulated in a multipole ion trap in which
they experienced collisions with helium buffer gas kept at room
temperature.
In the ELISA experiments, an ion bunch was accelerated to kinetic
energy of 22 keV, and the ions of interest were selected with a bending
magnet. These were injected into the ring that is based on purely
electrostatic deflectors and focusing elements. The ions circulated until
they changed their mass-to-charge ratio as a result of either collisions
with residual gas in the ring (pressure of about 10−10
mbar) or
photoexcitation. Neutrals produced on the injection side of the ring
were not influenced by the electric fields and hit a microchannel plate
detector located at the end of the straight section. The rate of neutrals
hitting the detector was a measure of the number of ions circulating in
the ring. OxyLH−
ions were photoexcited after about 45 ms. The third
harmonic (355 nm) from a Nd:YAG laser was used to pump an optical
parametric oscillator (OPO) (EKSPLA laser system). Neutral density
filters were used to attenuate the laser power. The repetition rate of
the experiment was 10 Hz.
Journal of the American Chemical Society Article
dx.doi.org/10.1021/ja311400t | J. Am. Chem. Soc. 2013, 135, 6485−64936491
IV](https://image.slidesharecdn.com/683d4131-560b-40b7-aabd-4b72f336e72f-161214213503/85/Phd-thesis-Jorgen-Houmoller-final-159-320.jpg)
![For experiments using the accelerator mass spectrometer, an ion
bunch was accelerated to energy of 50 keV, and appropriate ions were
again selected with a bending magnet. These were photoexcited by
light from a laser system similar to that used with ELISA in a merged
beam configuration. An electrostatic analyzer allowed particular
fragment ions to reach a channeltron detector where they were
counted. The yield of fragment ions as a function of excitation
wavelength was monitored up to 3 μs after photoexcitation. The
experiment was performed at a repetition rate of 40 Hz. The laser was
run at 20 Hz; thus only every second ion bunch was irradiated to
obtain the real laser-induced signal. Also, laser-off spectra were used to
correct for ion beam fluctuations from the yield of fragment ions
produced as a result of collisions with the residual gas. Hydrated ions
were generated by introducing water vapor in an octopole trans-
mission guide located before the multipole trap. The kinetic energies
of the ions in the ion source were retained as low as possible to
prevent collision-induced water loss from the fragile molecular
complexes. The ion beam signal of the complexes was insufficient
for meaningful corrections for ion beam fluctuations; instead, the
experiment was repeated multiple times to compensate for such
variations.
Theoretical Methods. All electronic structure calculations were
performed using GAMESS-US (1 October 2010 (R1) release).42
Geometries were optimized at the B3LYP43
level with the diffuse-
augmented polarized double-ζ basis set Def2-SVPD.44
The isolated
anion was optimized in both the cis and the trans conformations
because both might be populated in the experiment. An energy
difference of 23.6 kJ mol−1
was found, indicating a Boltzmann factor
ratio of 1: 5.14 × 10⁻⁵
in favor of the trans-form at 300 K, and so the
cis-form was neglected thereafter. That the trans-enol form of
OxyLH−
might be important was also considered, but this geometry
was found to lie 47.4 kJ mol−1
higher than the trans-keto form
(Boltzmann ratio of 1:5.97 × 10⁻⁹
in favor of the keto-form). trans-
DMOxyL−
was optimized at the same level.
Geometry optimizations for the [(OxyLH)(H2O)]−
complex were
performed with water hydrogen-bonded to either the benzothiazole or
the thiazolone end of the trans-keto anion. The thiazolone-bound
configuration lay 10.5 kJ mol−1
higher in energy with a corresponding
Boltzmann factor ratio of 1:1.48 × 10⁻²
favoring the benzothiazole
complex at 300 K and indicating an insignificant contribution from the
thiazolone configuration.
To obtain a computational benchmark for the electronic excitations
in these systems, calculations were performed with equation-of-motion
coupled cluster theory including single and double excitations (EOM-
CCSD).38,45−48
The inclusion of triples excitations for molecules of
this size was too demanding, and therefore the calculations were
truncated at the EOM-CCSD level. However, the results obtained
showed that the excitations were predominantly single-electron in
character meaning that the physics required to accurately describe
these excitations was already contained in the EOM-CCSD method.38
Both the Def2-SVPD and the large Def2-TZVPPD basis sets were
used. To minimize the computational effort involved in these
calculations in terms of memory- and disk-usage, the reduced virtual
space method49
was employed. A cutoff of 50 eV above the HOMO
level was found to give results that changed by less than 2 nm when
the cutoff was increased to 60 eV and by less than 1 nm when
increased to 70 eV. These changes were not consistently positive or
negative, due to the nonvariational nature of the calculations, and so
negligible net change was seen beyond the 50 eV cutoff.
TDDFT50
calculations used a series of four functional forms of
increasing formal complexity representing different rungs on the
Jacob’s ladder of (TD)DFT approximations.51−53
The SVWN (local
density approximation) and BLYP (generalized gradient approxima-
tion) functionals were selected to investigate the performance of pure
DFT in this system.54−56
The commonly used hybrid functional
B3LYP (20% Hartree−Fock (HF) exchange) was also included. For
excitations with significant nonlocal character, TDDFT methods can
produce large errors due to an incomplete treatment of long-range
interactions.57,58
The range-separated hybrid CAM-B3LYP functional,
designed to provide a more balanced description of excitation
processes with, for example, charge-transfer character,59
was therefore
also included. TDDFT calculations were performed with the Def2-
SVPD basis set and repeated with the much more flexible Def2-
TZVPPD basis.44
Minor changes (∼0.01 eV) indicated that the Def2-
SVPD results were well converged.
Molecular dynamics simulations were performed with Tinker v6.1.60
OxyLH−
parameters24
were converted to fit the Tinker
CHARMM2261,62
functional form. Torsional parameters relating to
the bond bridging the two heterocylic substructures were adjusted for
a better fit of the torsion profile calculated with DFT (see the
Supporting Information). Additional parameters required for
DMOxyL−
and [(OxyLH)(H2O)]−
were taken from the
CHARMM22 set. Atomic partial charges were calculated using the
CHELPG approach (charges from electrostatic potentials using a grid-
based method)63
at the B3LYP/Def2-SVPD level with Orca v2.9.0.64
300 ps in vacuo simulations were run at 300 K in the NVE ensemble.
Sampling at 1 ps intervals gave 300 input structures for subsequent
TDDFT/Def2-SVPD calculations using the LDA (SVWN) and CAM-
B3LYP functionals. The dominant first excitations and oscillator
strengths from each calculation were collected, and a Lorentzian
broadening function with a half-width of 10 nm was applied using the
Gabedit v2.4.0 package.65
The resulting composite peaks were then
renormalized so as to fit them onto the same scale as the individual
excitations.
■ ASSOCIATED CONTENT
*S Supporting Information
Force field parameters used in molecular dynamics simulations
of the oxyluciferinate and 5,5-dimethyloxyluciferinate anions.
B3LYP/Def2-SVPD optimized geometries (and total energies)
used in EOM-CCSD and TDDFT single-point calculations.
This material is available free of charge via the Internet at
http://pubs.acs.org.
■ AUTHOR INFORMATION
Corresponding Author
sbn@phys.au.dk; pance.naumov@nyu.edu; bruce@teor.fis.uc.pt
Notes
The authors declare no competing financial interest.
■ ACKNOWLEDGMENTS
S.B.N. gratefully acknowledges support from Lundbeckfonden.
P.N. thanks the Human Frontier Science Project (grant
RGY0081/2011) and the Kyoto University’s Hakubi Project
for funding. B.F.M. thanks the Portuguese Foundation for
Science and Technology for funding (PTDC/FIS/103587/
2008) and the Laboratory for Advanced Computation of the
University of Coimbra for the provision of computer resources,
technical support, and assistance. P.N. acknowledges financial
support from the Swedish Research Council (Grant No. 621-
2010-5014). M.L. thanks SERC (Swedish e-Science Research
Center) for funding and SNIC for providing computer
resources.
■ REFERENCES
(1) Shimomura, O. Bioluminescence: Chemical Principles and Methods;
World Scientific: NJ, 2006.
(2) Cormier, M. J.; Hori, K.; Anderson, J. M. Biochim. Biophys. Acta
1974, 346, 137−164.
(3) Liu, F.; Liu, Y.; De Vico, L.; Lindh, R. J. Am. Chem. Soc. 2009,
131, 6181−6188.
(4) Ando, Y.; Niwa, K.; Yamada, N.; Enomoto, T.; Irie, T.; Kubota,
H.; Ohmiya, Y.; Akiyama, H. Nat. Photonics 2008, 2, 44−47.
(5) Kricka, L. J. Biolumin. Chemilumin., Part C: Methods Enzymol.
2000, 305, 333−345.
(6) Greer, L. F.; Szalay, A. A. Luminescence 2002, 17, 43−74.
Journal of the American Chemical Society Article
dx.doi.org/10.1021/ja311400t | J. Am. Chem. Soc. 2013, 135, 6485−64936492
IV](https://image.slidesharecdn.com/683d4131-560b-40b7-aabd-4b72f336e72f-161214213503/85/Phd-thesis-Jorgen-Houmoller-final-160-320.jpg)

![DOI: 10.1002/cphc.201300019
On the Photoabsorption by Permanganate Ions in Vacuo
and the Role of a Single Water Molecule. New
Experimental Benchmarks for Electronic Structure Theory
Jørgen Houmøller,[a]
Sydney H. Kaufman,[b]
Kristian Støchkel,[a]
Lokesh C. Tribedi,[c]
Steen Brøndsted Nielsen,*[a]
and J. Mathias Weber*[b]
1. Introduction
Permanganate, MnO4
À
, is one of the most prominent oxidation
reagents in chemistry, its distinctive violet colour being known
to every freshman chemistry student. It is a tetroxo d0
transi-
tion-metal complex with a tetrahedral (Td) ground-state geom-
etry. Its beautiful electronic spectrum exhibits a clear vibronic
structure even in room-temperature aqueous solutions. First
spectra of MnO4
À
embedded in crystal lattices were reported
by Teltow[1]
in 1938–39 but with limited resolution. A well-re-
solved spectrum at low temperatures was later published by
Holt and Ballhausen[2]
in 1967. It has become a prototype spec-
trum for the spectroscopy of transition-metal ion complexes
and spurred large interest among quantum chemists for sever-
al decades.[2–6]
Electronic excitations of MnO4
À
result in geometry changes
to lower symmetries (C3v, C2v and D2d) due to Jahn–Teller distor-
tion.[4,5]
As a result, the electronic spectrum of permanganate
is exceptionally difficult to describe theoretically and as such
stands out among the tetroxo complexes, despite the modest
size of MnO4
À
and its d0
electron configuration. Indeed, the ion
is not only of significant interest in inorganic chemistry but has
become a benchmark system to test and develop advanced
electronic structure models.[4–6]
Until now, calculated excitation
energies have been compared to the absorption spectrum of
permanganate in aqueous solution or to that of KMnO4 diluted
in KClO4 crystals at cryogenic temperatures. The overall band
shapes, including intricate vibronic structures, are relatively
well recovered, but the calculated spectra are significantly
shifted from experimental spectra by as much as 1 eV, even for
modern approaches based on time-dependent density func-
tional theory.[4,5]
Since quantum chemistry calculations on MnO4
À
are usually
carried out for isolated ions in the absence of a surrounding
medium, certainly a more proper reference is the spectrum of
permanganate in vacuo. In the present work, we address
whether the differences between experimental and calculated
spectra are due to limitations of the theoretical models or
owed to environmental perturbations. We report here on the
intrinsic absorption by MnO4
À
ions from 1.77 to 4.46 eV (700–
278 nm) and for MnO4
À
·H2O ions from 1.77 to 2.95 eV (700–
420 nm) in the absence of an environment, based on action
spectroscopy experiments using three different experimental
setups in Aarhus and Boulder. The results for the water com-
plex allow us to directly probe the role of a single water mole-
cule on the electronic structure of permanganate; in contrast
to the bare and the fully solvated ion, this is an inherently
asymmetric system.
The number of gas-phase experimental studies on perman-
ganate ions by mass spectrometry and laser spectroscopy is
limited. The ion can easily be brought into the gas phase with
electrospray ionization as first shown by Lau et al.[7]
Low-
energy collision-induced dissociation (CID) experiments re-
vealed that the lowest-energy dissociation channels are loss of
We report electronic spectra of mass-selected MnO4
À
and
MnO4
À
·H2O using electronic photodissociation spectroscopy.
Bare MnO4
À
fragments by formation of MnO3
À
and MnO2
À
,
while the hydrated complex predominantly decays by loss of
the water molecule. The band in the visible spectral region
shows a well-resolved vibrational progression consistent with
the excitation of a MnÀO stretching mode. The presence of
a single water molecule does not significantly perturb the
spectrum of MnO4
À
. Comparison with the UV/Vis absorption
spectrum of permanganate in aqueous solution shows that
complete hydration causes a small blueshift, while theoretical
models including a dielectric medium have predicted a redshift.
The experimental data can be used as benchmarks for elec-
tronic structure theory methods, which usually predict elec-
tronic spectra in the absence of a chemical environment.
[a] J. Houmøller, Dr. K. Støchkel, Prof. S. Brøndsted Nielsen
Department of Physics and Astronomy, Aarhus University
Ny Munkegade 120, 8000 Aarhus C (Denmark)
E-mail: sbn@phys.au.dk
[b] S. H. Kaufman, Prof. J. M. Weber
JILA and Department of Chemistry & Biochemistry
University of Colorado
440 UCB, Boulder, CO 80309-0440 (USA)
E-mail: weberjm@jila.colorado.edu
[c] Prof. L. C. Tribedi
Department of Nuclear and Atomic Physics
Tata Institute of Fundamental Research Colaba
Mumbai 400005 (India)
Supporting information for this article is available on the WWW under
http://dx.doi.org/10.1002/cphc.201300019.
2013 Wiley-VCH Verlag GmbH Co. KGaA, Weinheim ChemPhysChem 2013, 14, 1133 – 1137 1133
CHEMPHYSCHEM
ARTICLES
V](https://image.slidesharecdn.com/683d4131-560b-40b7-aabd-4b72f336e72f-161214213503/85/Phd-thesis-Jorgen-Houmoller-final-162-320.jpg)
![oxygen or dioxygen from MnO4
À
. Wang and co-workers[8]
mea-
sured its photoelectron spectrum using 194 nm photons and
determined the vertical and adiabatic detachment energies to
be 4.91 and 4.80 eV. These are much higher than the first few
electronic excitation energies. Hence, electron detachment
does not need to be considered in our experiments where we
use visible and UV light with photon energies less than 4.5 eV.
2. Results and Discussion
We first present the results from the Aarhus experiments
where photo-excitation was carried out within the first intense
electronic band. This band has been assigned to a transition
characterized mainly as a HOMO!LUMO (1t1!2e) type be-
longing to the 11
T2 state.[4]
It gives permanganate solutions
their characteristic colour.
To verify that the ions with m/z=119 u/e produced by elec-
trospray ionization were indeed MnO4
À
, high-energy (50 keV in
laboratory frame) CID and charge reversal (CR) experiments
were done. Air was used as the collision gas. The CID spectra
had peaks at m/z=103 and 87 u/e that can be assigned to
MnO3
À
and MnO2
À
, while CR resulted in peaks at m/z=27.5,
55, 71, 87 and 103 u/e corresponding to Mn2+
, Mn+
, MnO+
,
MnO2
+
and MnO3
+
formed after the detachment of at least
two electrons (see the Supporting Information). There were no
indications of impurities in the ion beam with m/z=119 u/e.
The dominant fragment ions of MnO4
À
after irradiation at
540 nm (2.3 eV) are MnO3
À
and MnO2
À
, formed after loss of
either one or two oxygen atoms, with a branching ratio of
0.95:1 (see the Supporting Information). The fluence depend-
ences of both processes show that two photons are needed
for dissociation (see the Supporting Information). Storage-ring
experiments revealed that dissociation occurs rapidly since no
dissociation events were registered after more than half a revo-
lution in the ring (21 ms, Figure 1). This is reasonable since
MnO4
À
has only nine vibrational degrees of freedom and the
excess energy available for simple bond cleavage after two-
photon absorption is at least 1 eV. Assuming that the electron-
ic excitation energy is converted into vibrational energy on the
electronic ground-state surface, dissociation of a hot ion
should therefore be fast. Finally, we note that photodecompo-
sition of permanganate in solution mainly leads to evolution of
O2, not production of O.[9]
This suggests that solvent caging ef-
fects prevent the loss of atomic oxygen.
The MnO4
À
·H2O complex dissociates almost exclusively to
MnO4
À
and H2O after the absorption of a single 540 nm
photon. This is not surprising as typical binding energies of
water–anion complexes are of the order of 0.5 eV. Again, full
dissociation is expected within the time window for sampling
fragmentation (a few microseconds).
To obtain action spectra we measured the yields of MnO3
À
and MnO2
À
ions from MnO4
À
, and MnO4
À
from MnO4
À
·H2O. The
MnO3
À
fragment action spectrum of MnO4
À
(Figure 2a) shows
a vibrational progression with an average spacing of (740Æ
50) cmÀ1
, which is mainly due to the MnÀO stretching vibra-
tion in the 11
T2 excited state. This value is in excellent agree-
ment with the values of approximately 770 cmÀ1
reported by
Holt and Ballhausen.[2]
The lowest-energy peak is observed at
16850 cmÀ1
(2.09 eV). Sampling MnO2
À
fragment ions instead
gives an action spectrum (Figure 2b) that has the same peaks
but a distribution that favours peaks to the blue and suppress-
es the lowest-energy peak. This is simply due to the higher
threshold energy required to lose O2 compared to O. To obtain
the total photodissociation action spectrum, we added the
two spectra together (see curve in Figure 2c). Peak positions
are summarized in Table 1. The maximum cross section is
Figure 1. Yield of neutrals from MnO4
À
ions circulating in an electrostatic
ion-storage ring. Neutral atoms or molecules are formed either from colli-
sions between the ions and residual gas in the ring (pressure of 10À10
mbar)
or as a result of 540 nm photodissociation. The time for the laser pulse is set
to zero. Neutrals were detected by a secondary emission detector (SED) on
the side where photoexcitation was performed (a) and by a microchannel
plate (MCP) detector located on the opposite side (b). No delayed photodis-
sociation was observed. Data were acquired during approximately two
hours.
Table 1. Summary of in vacuo spectroscopic data (peaks 1–7) for MnO4
À
and MnO4
À
·H2O. All energies are in cmÀ1
. The uncertainty is about
50 cmÀ1
. Average spacings are 740 cmÀ1
for MnO4
À
and 725 cmÀ1
for
MnO4
À
·H2O.
Ion 1[a]
2[b]
3[b]
4[b]
5[b]
6[b]
7[b]
MnO4
À
16850 730 770 720 760 710 740
MnO4
À
·H2O 16920 730 770 700 770 640 740
[a] Lowest-energy transition. [b] Peak n is given as the shift relative to
peak nÀ1.
2013 Wiley-VCH Verlag GmbH Co. KGaA, Weinheim ChemPhysChem 2013, 14, 1133 – 1137 1134
CHEMPHYSCHEM
ARTICLES www.chemphyschem.org
V](https://image.slidesharecdn.com/683d4131-560b-40b7-aabd-4b72f336e72f-161214213503/85/Phd-thesis-Jorgen-Houmoller-final-163-320.jpg)
![found for the two lowest-energy components (i.e. the v“=0 to
v’=0 and v”=0 to v’=1 transitions). We note that there is
considerable spectral congestion in the gas-phase spectra,
probably due to the fact that the ions are prepared at room
temperature which leads to hot bands. As a consequence, we
cannot resolve the vibrational progressions in the bending and
wagging modes, which have lower vibrational energies.[2,4]
In-
terestingly, weak signatures roughly halfway between the main
progressions can be seen, which are consistent with progres-
sions in the MnÀO stretching modes building on the v=1 hot
band in the ground-state bending or wagging modes.[4]
The photodissociation spectrum of MnO4
À
·H2O is shown in
Figure 2c. It is surprisingly similar to that of MnO4
À
, both in re-
spect to peak positions and the overall band shape. The vi-
bronic peaks are shifted towards higher energies by less than
100 cmÀ1
(12 meV). The spectral data are summarized in
Table 1. It is evident that the water binds to the electronic
ground state with almost equal strength as to the first excited
state. This is a surprising result since a single water molecule
or hydrogen bond interaction often causes significant blue-
shifts in electronic bands.[10]
However, it is in line with the ex-
ceptional stability of the permanganate ion described in a com-
bined photoelectron spectroscopy and quantum chemical
study.[8]
It is also consistent with the observation by Sam and
Simmons,[11]
who showed that KMnO4 can be dissolved in ben-
zene by complexing with dicyclohexyl-18-crown-6 and that the
absorption spectrum is very similar to that of permanganate
ions in aqueous solution, even though nuclear magnetic reso-
nance indicated an ion pair in benzene and a less symmetric
permanganate ion. The spectrum of the water complex serves
as an interesting benchmark system for quantum chemistry
since methods have to be able to deal with perturbations
caused by the water both in the ground state and the elec-
tronically excited state.
The absorption spectrum of MnO4
À
in aqueous solution is
also shown in Figure 2. We note that the band contours of the
isolated ions are different from those in the condensed phase.
The v’’=0!v’=2 and v’’=0!v’=1 peaks represent the maxi-
mum of the band contours for aqueous solutions and low-
temperature diluted crystals,[2]
while we find that the v“=0!
v’=0 and v”=0!v’=1 are of similar intensity for the isolated
ions, indicating a noticeable change in the excited-state sur-
face along the MnÀO stretching coordinate upon full solvation.
There is a solvatochromic shift of 1220 cmÀ1
(0.15 eV) towards
the blue for the diluted crystal spectrum (800 cmÀ1
in aqueous
solution). This shift can be caused, for example, by breaking of
the symmetry of the solute ion in interactions with the solvent.
If this were so, then attachment of a single water molecule
would introduce a large fraction of the solvatochromic shift.
The spectrum of MnO4
À
·H2O shown in Figure 2c implies that
this is not the case, which indicates that differential stabiliza-
tion of the ground and excited state upon more complete sol-
vation is a more likely source of the solvatochromic shift ob-
served.
Based on time-dependent density functional calculations
Neugebauer et al.[5]
and Jose et al.[4]
were able to simulate the
vibronic structure of the experimental spectra from low-tem-
perature crystalline solutions, making important band assign-
ments possible. Comprehensive discussions on previous theo-
retical work are given in these two very informative papers.
However, the calculated spectra were shifted by more than
0.5 eV towards the red to match the condensed phase spectra.
With the gas-phase spectrum of MnO4
À
at hand, we can con-
clude that the predictions of absolute energies are actually off
by more than 0.7 eV including the 0.15 eV blueshift seen be-
tween bare ions and ions in diluted crystals. We note that the
inclusion of dielectric environmental effects in the form of the
COSMO solvation model led to predicted redshifts in the exci-
tation energies[6l]
and not the experimentally observed blue-
shifts. This highlights the fact that permanganate is certainly
still a challenge for electronic structure theory.
Our spectra display absorption to the red of the first peak
extending all the way down to 14300 cmÀ1
for MnO4
À
·H2O.
Similar features are observed in absorption spectra of aqueous
solutions and in diluted crystals at room temperature,[1]
while
Holt and Ballhausen did not find absorption below the lowest-
energy vibronic band.[2]
The origin of this absorption is unclear.
The highest energy part of it may be caused by hot bands, but
they cannot account for the low-energy onset of the band.
Figure 2. Action spectra of MnO4
À
sampling a) MnO3
À
and b) MnO2
À
frag-
ment ions. The solid curves are based on a Savitzky–Golay smoothing filter
using five and three successive data points. c) Action spectrum of
MnO4
À
·H2O sampling MnO4
À
fragment ions. The sum of the two solid curves
from (a) and (b) is included (d). Peaks are numbered 1–7, and their associ-
ated energies are listed in Table 1. d) Absorption spectrum of an aqueous so-
lution of KMnO4 (100 mm concentration). We note that the photofragment
yield for bare MnO4
À
below approximately 15400 cmÀ1
was too low to be
reported due to relatively low laser pulse energy and the two-photon
nature of the photodissociation process.
2013 Wiley-VCH Verlag GmbH Co. KGaA, Weinheim ChemPhysChem 2013, 14, 1133 – 1137 1135
CHEMPHYSCHEM
ARTICLES www.chemphyschem.org
V](https://image.slidesharecdn.com/683d4131-560b-40b7-aabd-4b72f336e72f-161214213503/85/Phd-thesis-Jorgen-Houmoller-final-164-320.jpg)
![Triplet states could be responsible for the low-lying excitations,
and their energies as calculated by Dickson and Ziegler[6j]
are
compatible with the experimentally observed position of this
low-energy band. Irrespective of the actual assignment, our
work clearly verifies that this band is due to MnO4
À
and not
another solute species in solution.
Next we consider the results from the Boulder experiments
where photoexcitation was performed in the UV. Absorption of
UV radiation by MnO4
À
leads to the loss of one oxygen atom
upon absorption of a single photon as revealed by the fluence
dependence (see the Supporting Information) of the photodis-
sociation signal at 3.75 eV photon energy (331 nm). Weak sig-
nals corresponding to the loss of dioxygen were also observed,
but they were insufficient to record useful photodissociation
spectra.
The second and third absorption bands exhibit much less vi-
bronic structure than the first. The data obtained in vacuo
(Figure 3) show more details than spectra taken in aqueous
solutions, but fewer than those obtained in crystals at low
temperatures.[2]
The second band, which marks the transition
from the ground state to the 21
T2 state,[4]
shows an onset at
24000 cmÀ1
. The first discernible structure is a shoulder at
26700 cmÀ1
, red-shifted by approximately 740 cmÀ1
from the
first observable shoulder in the crystal spectrum by Holt and
Ballhausen.[2]
A weak intensity modulation with irregular spac-
ing can be observed in both the second and the third elec-
tronic band, which is compatible with a vibrational progression
in a MnÀO stretching vibration, similar to the vibronic signa-
tures observed in the first electronic band. Electronic structure
calculations predict vertical transition energies for the second
and third electronic bands which are too high by 0.6 and
1.2 eV.[4]
3. Conclusions
We measured the electronic spectra of isolated permanganate
ions and their complexes with one water molecule attached.
The lowest-energy bands are almost identical except for a tiny
blueshift of 12 meV caused by the presence of a single water
molecule. We established that complete hydration gives rise to
a blueshift of about 0.1 eV and a crystalline KClO4 environment
leads to a blueshift of 0.15 eV. For the second and third elec-
tronic bands we observed blueshifts upon full solvation of the
ion. Interestingly, the trend of solvatochromic shifts from the
bare ion to an aqueous solution to the diluted crystal (Table 2)
shows that the chemical environment in crystal experiments
that have been mostly used to benchmark calculations up to
now is more perturbative than an aqueous solution. This is
consistent with the observation that the overall in vacuo band
contours and relative intensities in the UV are closer to aque-
ous-solution data than to crystal spectra, highlighting that the
environment of an ion is important for its electronic properties.
The spectra provide new and much-needed benchmarks for
sophisticated electronic structure calculations on this highly
important metal ion complex. Last but not least, our data
allow theorists to test the role of a single water molecule on
the electronic states of permanganate. Future experiments
using cryogenically cooled ions may be a good way to obtain
an even better benchmark for this system.
Experimental Section
Altogether three experimental approaches for molecular beam
photodissociation spectroscopy were used in this work, an acceler-
ator mass spectrometer and the electrostatic storage ring ELISA,
both in Aarhus, and a reflectron time-of-flight mass spectrometer
in Boulder. The setups have been described in detail else-
where,[12,13]
and only a brief description is given below. In all ex-
periments, KMnO4 was dissolved in acetonitrile and electrosprayed.
The internal vibrational energy in both experiments corresponds to
room temperature.
Table 2. Solvatochromic shifts of the three lowest energy electronic
bands of MnO4
À
in cmÀ1
, defined as the wavenumber in vacuo subtracted
from the wavenumber in solution. The uncertainty is about 70 cmÀ1
.
Band 1st 2nd 3rd
aqueous solution 800 N/A 400
diluted crystal 1220 740 1280
Figure 3. a) UV photofragment action spectrum of MnO4
À
monitoring
MnO3
À
. The solid line shown in the regions of the second and third electron-
ic bands is a smoothed curve using seven-point adjacent averaging. b) Ab-
sorption spectrum of an aqueous solution of KMnO4 (100 mm concentration).
2013 Wiley-VCH Verlag GmbH Co. KGaA, Weinheim ChemPhysChem 2013, 14, 1133 – 1137 1136
CHEMPHYSCHEM
ARTICLES www.chemphyschem.org
V](https://image.slidesharecdn.com/683d4131-560b-40b7-aabd-4b72f336e72f-161214213503/85/Phd-thesis-Jorgen-Houmoller-final-165-320.jpg)
![Aarhus Experiments
Ions were passed through a heated capillary and tube-lens/skimm-
er region into an octopole that is operated as a trap by proper
pulsing of the lens directly following it. There, ions were in some
experiments allowed to react with H2O for 25 ms at a pressure of
about 0.1 mbar. Ions were accelerated to 50 keV kinetic energies,
and those of interest were selected by an electromagnet and sub-
sequently irradiated with light (420–700 nm) from an optical para-
metric oscillator pumped by the third harmonic of a Nd:YAG laser
with a repetition rate of 20 Hz. Ion bunches were about 5 ms long
and laser pulses shorter than 10 ns. An electrostatic analyzer was
scanned to identify the fragment ions; these were counted by
a channeltron detector. Since the ion source was running at 40 Hz,
only every second ion bunch was irradiated to obtain the laser-in-
duced signal. The formation of fragments with the laser off was
due to either dissociation of metastable ions or to collisions with
residual gas in the beam line. For high count rates, this yield was
used to correct for small fluctuations in the intensity of the parent
ions. The photo-induced yield of fragment ions was measured as
a function of wavelength. Yields were corrected for photon flux to
obtain action spectra and several spectra were taken on different
days and averaged. As fragmentation is a result of absorption,
these spectra were taken to represent absorption by the ions.
In other experiments, MnO4
À
ions were photo-excited by 540 nm
light in a storage ring after 15 ms of storage. Dissociation was
monitored as a function of time by detecting neutral fragments
formed either on the side where irradiation was done or on the
other side of the instrument using a secondary emission detector
(SED) and a microchannel plate (MCP) detector (Figure 1). The ion
revolution time was 42 ms.
Boulder Experiments
After passing through a desolvation capillary, electrosprayed ions
were accumulated in a linear hexapole ion trap. Subsequently, they
were extracted from the trap, focused using ion optics and inject-
ed into the acceleration region of a Wiley–McLaren time-of-flight
mass spectrometer. Ions of interest were irradiated at the first
space focus of the mass spectrometer by the output of a nanosec-
ond-pulsed optical parametric converter. Using a two-stage reflec-
tron, fragment ions were mass-separated from remaining, undisso-
ciated parent ions. Ions were detected on a microchannel plate de-
tector at the second space focus of the mass spectrometer. Photo-
dissociation action spectra were obtained by monitoring the frag-
ment ion intensity as a function of photon energy and corrected
for laser fluence. Signals due to unimolecular decay of metastable
(hot) parent ions or collisions with residual gas were subtracted by
running the laser at 20 Hz and the ion source at 40 Hz, subtracting
the ion signals without irradiation from those obtained with irradi-
ation. Several spectra were taken on different days and averaged.
The UV/Vis absorption spectrum of KMnO4 dissolved in water at
100 mm concentration was acquired using a Varian Cary 500 Scan
UV-visible-NIR spectrometer (version 8.01) with 10 mm path length,
10 cmÀ1
step size, 2 nm resolution and an integration time of 0.1 s.
Acknowledgements
This work was supported by Lundbeckfonden, FNU, and by the
National Science Foundation (CHE-0845618 and PHY-1125844).
S.H.K. is a NSF Graduate Research Fellow (DGE-1144083). L.C.T.
and J.M.W. gratefully acknowledge support from Guest Professor-
ships at Aarhus University.
Keywords: gas-phase spectroscopy · mass spectrometry ·
permanganate · quantum chemistry · single water complex
[1] a) J. Teltow, Z. Phys. Chem. Abt. A 1938, 40, 397–430; b) J. Teltow, Z.
Phys. Chem. Abt. A 1939, 43, 198–212.
[2] S. L. Holt, C. J. Ballhausen, Theor. Chim. Acta 1967, 7, 313–320.
[3] a) M. Wolfsberg, L. Helmholtz, J. Chem. Phys. 1952, 20, 837–843; b) C. J.
Ballhausen, A. D. Liehr, J. Mol. Spectrosc. 1958, 2, 342–360; c) C. J. Ball-
hausen, Theor. Chim. Acta 1963, 1, 285–293; d) A. Viste, H. B. Gray,
Inorg. Chem. 1964, 3, 1113–1123.
[4] L. Jose, M. Seth, T. Ziegler, J. Phys. Chem. A 2012, 116, 1864–1876.
[5] J. Neugebauer, E. J. Baerends, M. Nooijen, J. Phys. Chem. A 2005, 109,
1168–1179.
[6] a) H. Hsu, C. Peterson, R. M. Pitzer, J. Chem. Phys. 1976, 64, 791–795;
b) H. Johansen, S. Rettrup, Chem. Phys. 1983, 74, 77–81; c) H. Nakai, Y.
Ohmori, H. Nakatsuji, J. Chem. Phys. 1991, 95, 8287–8291; d) M. Nooi-
jen, J. Chem. Phys. 1999, 111, 10815–10826; e) K. H. Johnson, F. C.
Smith, Jr., Chem. Phys. Lett. 1971, 10, 219–223; f) S. J. A. van Gisbergen,
J. A. Groeneveld, A. Rosa, J. G. Snijders, E. J. Baerends, J. Phys. Chem. A
1999, 103, 6835–6844; g) P. Boulet, H. Chermette, C. A. Daul, F. Gilardo-
ni, J. Weber, G. Zuber, J. Phys. Chem. A 2001, 105, 885–894; h) G. Men-
coni, N. Kaltsoyannis, Chem. Phys. Lett. 2005, 415, 64–68; i) M. Buijse,
E. J. Baerends, J. Chem. Phys. 1990, 93, 4129–4141; j) R. M. Dickson, T.
Ziegler, Int. J. Quantum Chem. 1996, 58, 681–687; k) A. J. Bridgeman, G.
Cavigliasso, Polyhedron 2001, 20, 2269–2277; l) M. Seth, T. Ziegler, A.
Banerjee, J. Autschbach, S. J. A. van Gisbergen, E. J. Baerends, J. Chem.
Phys. 2004, 120, 10942–10954.
[7] T. C. Lau, J. Y. Wang, K. W. M. Siu, R. Guevremont, J. Chem. Soc. Chem.
Commun. 1994, 1487–1488.
[8] G. L. Gutsev, B. K. Rao, P. Jena, X. B. Wang, L. S. Wang, Chem. Phys. Lett.
1999, 312, 598–605.
[9] H. Nakai, Y. Ohmori, H. Nakatsuji, J. Phys. Chem. 1995, 99, 8550–8555,
and references therein.
[10] a) D. Zuev, K. B. Bravaya, M. V. Makarova, A. I. Krylov, J. Chem. Phys.
2011, 135, 194304; b) E. V. Gromov, I. Burghardt, H. Koppel, L. S. Ceder-
baum, J. Am. Chem. Soc. 2007, 129, 6798–6806.
[11] D. J. Sam, H. F. Simmons, J. Am. Chem. Soc. 1972, 94, 4024–4025.
[12] a) K. Støchkel, B. F. Milne, S. Brøndsted Nielsen, J. Phys. Chem. A 2011,
115, 2155–2159; b) J. A. Wyer, S. Brøndsted Nielsen, Angew. Chem.
2012, 124, 10402–10406; Angew. Chem. Int. Ed. 2012, 51, 10256–
10260; c) J. U. Andersen, P. Hvelplund, S. Brøndsted Nielsen, S. Tomita,
H. Wahlgreen, S. P. Møller, U. V. Pedersen, J. S. Forster, T. J. D. Jørgensen,
Rev. Sci. Instrum. 2002, 73, 1284–1287; d) K. Støchkel, U. Kadhane, J. U.
Andersen, A. I. S. Holm, P. Hvelplund, M.-B. S. Kirketerp, M. K. Larsen,
M. K. Lykkegaard, S. Brøndsted Nielsen, S. Panja, H. Zettergren, Rev. Sci.
Instrum. 2008, 79, 023107; e) J. Rajput, D. B. Rahbek, G. Aravind, L. H.
Andersen, Biophys. J. 2010, 98, 488–492.
[13] J. C. Marcum, A. Halevi, J. M. Weber, Phys. Chem. Chem. Phys. 2009, 11,
1740–1751.
Received: January 9, 2013
Published online on February 1, 2013
2013 Wiley-VCH Verlag GmbH Co. KGaA, Weinheim ChemPhysChem 2013, 14, 1133 – 1137 1137
CHEMPHYSCHEM
ARTICLES www.chemphyschem.org
V](https://image.slidesharecdn.com/683d4131-560b-40b7-aabd-4b72f336e72f-161214213503/85/Phd-thesis-Jorgen-Houmoller-final-166-320.jpg)


![German Edition: DOI: 10.1002/ange.201601979Chlorophyll
International Edition: DOI: 10.1002/anie.201601979
On the Exciton Coupling between Two Chlorophyll Pigments in the
Absence of a Protein Environment: Intrinsic Effects Revealed by
Theory and Experiment
Bruce F. Milne,* Christina Kjær, Jørgen Houmøller, Mark H. Stockett, Yoni Toker, Angel Rubio,
and Steen Brøndsted Nielsen*
Abstract: Exciton coupling between two or more chlorophyll
(Chl) pigments is a key mechanism associated with the color
tuning of photosynthetic proteins but it is difficult to disen-
tangle this effect from shifts that are due to the protein
microenvironment. Herein, we report the formation of the
simplest coupled system, the Chl a dimer, tagged with a quater-
nary ammonium ion by electrospray ionization. Based on
action spectroscopic studies in vacuo, the dimer complexes
were found to absorb 50–70 meV to the red of the monomers
under the same conditions. First-principles calculations predict
shifts that somewhat depend on the relative orientation of the
two Chl units, namely 50 and 30 meV for structures where the
Chl rings are stacked and unstacked, respectively. Our work
demonstrates that Chl association alone can produce a large
portion of the color shift observed in photosynthetic macro-
molecular assemblies.
The absorption wavelengths of chlorophyll (Chl) molecules
are modulated by the microenvironment surrounding each
pigment molecule. In this way, nature has evolved a method
by which the coverage of the optical spectrum and the
subsequent transfer of the absorbed energy is optimized,[1,2]
leading to photon energy conversion efficiencies of 95% in
photosynthetic systems.[3]
The harvesting of light energy in
photosynthesis is therefore far more efficient than anything
thus far developed by our most cutting-edge scientific and
technological efforts. Furthermore, small modifications to the
basic Chl structure, for example, the replacement of a methyl
group in Chl a with a formyl group in Chl b, also lead to some
fine-tuning of the absorption spectra.[4]
For decades a great deal of research activity has been
directed at understanding precisely how natural systems
modulate the absorption energies of Chl species. The highly
complex nature of the macromolecular systems involved has,
however, always served to complicate such attempts. In recent
years, experimental approaches have been joined by theoret-
ical/computational methods, and this has permitted studies at
levels of detail that were previously unattainable.[5–12]
Experimental methods have also continued to develop,
and recently it has become possible to study absorption
processes in Chl molecules free of solvent and other micro-
environmental effects. In pioneering experiments, Shafizadeh
et al.[13]
utilized two-color pump-probe spectroscopy to mea-
sure the lowest energy absorption band of neutral Chl a
evaporated from spinach leaves. They found the origin band
of the Qy transition to be at 647 nm. Recent action spectros-
copy experiments on Chl a tagged with quaternary ammoni-
um cations, in combination with theory, provided an absorp-
tion band maximum of similar value (642 nm).[14,15]
In this
case, the absorption was obtained from the dissociation of the
complex, and a calibrated value was determined for the
neutral molecule based on the deviation between theory and
experiment. Using this same technique, Q-band maxima were
obtained for Chl b,[14]
and the Soret band was measured for
both Chl a and Chl b.[15]
Importantly, the large difference in
the absorption spectra of Chl a and Chl b was concluded to be
an intrinsic effect and not due to local hydrogen-bond
interactions with the formyl group of Chl b, for example,
clearly demonstrating the advantage of looking at isolated
molecules. Compared to literature values for Chl in a variety
of natural protein complexes, absorption in vacuo was found
to be blue-shifted by 50 nm.[16–19]
With the absorption spectra of bare Chl now well
established, we can begin to ask the question of whether
shifts that are due to interactions with the protein environ-
ment are more or less important than those that are due to
excitonic coupling between two or more pigments. This issue
was very recently discussed by Baghbanzadeh and Kassal.[20]
The interactions basically govern the mechanism for energy
[*] Dr. B. F. Milne
CFisUC, Department of Physics, University of Coimbra
Rua Larga, 3004-516 Coimbra (Portugal)
E-mail: bfmilne@uc.pt
C. Kjær, J. Houmøller, Dr. M. H. Stockett, Prof. S. B. Nielsen
Department of Physics and Astronomy, Aarhus University
Ny Munkegade, DK-8000 Aarhus C (Denmark)
E-mail: sbn@phys.au.dk
Dr. Y. Toker
Institute of Nanotechnology and Advanced Materials
Bar-Ilan University, Ramat-Gan 5290002 (Israel)
Prof. A. Rubio
Max Planck Institute for the Structure and Dynamics of Matter
Luruper Chaussee 149, 22761 Hamburg (Germany)
Prof. A. Rubio
Nano-Bio Spectroscopy Group and ETSF
Universidad del País Vasco
CFM CSIC-UPV/EHU-MPC DIPC, 20018 San Sebastiµn (Spain)
Supporting information and the ORCID identification number(s) for
the author(s) of this article can be found under http://dx.doi.org/10.
1002/anie.201601979.
2016 The Authors. Published by Wiley-VCH Verlag GmbH Co.
KGaA. This is an open access article under the terms of the Creative
Commons Attribution Non-Commercial License, which permits use,
distribution and reproduction in any medium, provided the original
work is properly cited, and is not used for commercial purposes.
Angewandte
ChemieCommunications
6248 2016 The Authors. Published by Wiley-VCH Verlag GmbH Co. KGaA, Weinheim Angew. Chem. Int. Ed. 2016, 55, 6248 –6251
VII](https://image.slidesharecdn.com/683d4131-560b-40b7-aabd-4b72f336e72f-161214213503/85/Phd-thesis-Jorgen-Houmoller-final-173-320.jpg)
![transfer to the reaction center: For funneling via localized
states on the potential energy surface, the protein environ-
ment is most important whereas supertransfer requires fully
delocalized states where all pigments are electronically
coupled. In naturally occurring photosynthetic complexes,
there can be significant uninterrupted interfacial regions
between Chl molecules, and these presumably play an
important part in facilitating energy transfer between pig-
ments. Herein, we have applied the action spectroscopy
method used previously on individual Chl pigments to the
study of Chl a dimers in vacuo to evaluate the extent to which
the close association of chromophores contributes to the
spectral shift of Chl in photosynthetic systems.
To study photoabsorption with our approach it is neces-
sary for the chromophore to be charged; however, the direct
ionization of a molecule such as Chl in order to produce
a charged ion would yield the absorption energies for the
anion/cation instead of the neutral molecule. To get around
this problem, we have employed our previously developed
technique of non-covalently tagging the chromophore with
charged species to produce a complex ion.[14,15]
The experimental setup has been described in detail
elsewhere.[21,22]
Chl a (provided by Sigma–Aldrich) was
dissolved in methanol, and salts of either tetramethylammo-
nium (1+
) or acetylcholine (3+
) were added (see Figure 1).
These solutions were electrosprayed to produce complexes
consisting of chlorophylls and one charge tag. All ions were
accumulated in an octopole ion trap for 25 ms. Following
extraction from the trap, the ions were accelerated to 40 keV.
The charge-tagged complexes were then selected according to
their mass-to-charge ratios by an electromagnet and photo-
excited by a laser pulse (few nanoseconds long). Photo-
excitation led to dissociation of the complex, and the daughter
ions were separated according to their kinetic energies
(proportional to m/z) using an electrostatic analyzer and
counted with a channeltron detector. The light source used
was the visible output (420–700 nm) of an optical parametric
oscillator (OPO) pumped by a frequency-tripled, Q-switched
Nd:YAG laser (EKSPLA). The repetition rate of the laser
was 20 Hz, and only every second ion bunch was irradiated.
The real photoinduced signal was obtained as the difference
between the “laser on” and “laser off” signals. Each ion bunch
contained about one hundred charge-tagged Chl dimer
complexes.
Collision-induced dissociation (CID) experiments were
also performed by leaking atmospheric air into the beam line
after the mass-selection step and again scanning the electro-
static analyzer (ESA) for daughter ion mass spectrometry.
These experiments were done to confirm the identity of the
complex, and the corresponding spectra can be found in the
Supporting Information.
Photoexcitation of the dimer cation complexes led to loss
of either one Chl a or both Chl a (see Figure 2). Power
dependence experiments revealed that at least two photons
were needed for dissociation to occur within the instrumental
time window of approximately 10 ms. While the complexes are
weakly bound, they have many degrees of freedom account-
ing for dissociation not being a simple one-photon process.
To correct for the variation in laser power across the
spectral region, the photoinduced signal was divided by the
number of photons at each wavelength, that is, the laser pulse
energy was divided by the photon energy, raised to the power
of 2.3 (according to the power-dependence measurements, see
the Supporting Information). The resulting action spectra
associated with each fragment ion are very similar (Support-
ing Information) and were combined to give a total action
spectrum for each charge-tagged dimer (Figure 3). The band
maximum occurs at 652 Æ 5 nm (1.902 Æ 0.015 eV) for both
dimer complexes. The spectra shown here were recorded with
lower resolution than those in our previous work on Chl
monomers[14,15]
as the experiment was more difficult owing to
much lower ion currents. It is important to note that although
the overall band shape slightly depends on the power
correction, the band maximum does not within the exper-
imental uncertainty. Hence, our data show that the interaction
between two Chl pigments causes a red shift in the absorption
band maximum of about 15–25 nm (or 50–70 meV) relative to
the monomer charge-tag complexes. There is a second band in
the dimer spectrum at higher energy that may be due to the
higher-lying exciton state but more work is needed to
establish this with certainty.
Figure 1. Structures of molecular species employed in the present
work. Numbering of the cationic tags chosen to be consistent with our
previous related work on Chl spectra.[14,15]
Figure 2. PID mass spectrum of the dimer complex (Chl a)2·1+
normal-
ized to the highest fragment ion yield. The spectrum was obtained
with l=420 nm. Two fragment ions are observed: the charge tag 1+
(m/z 74) and the monomer complex Chl a·1+
(m/z 968).
Angewandte
ChemieCommunications
6249Angew. Chem. Int. Ed. 2016, 55, 6248 –6251 2016 The Authors. Published by Wiley-VCH Verlag GmbH Co. KGaA, Weinheim www.angewandte.org
VII](https://image.slidesharecdn.com/683d4131-560b-40b7-aabd-4b72f336e72f-161214213503/85/Phd-thesis-Jorgen-Houmoller-final-174-320.jpg)
![It is also evident from our spectra that the absorption
covers a broad region from 550 nm to 675 nm. This is
expected owing to vibronic coupling and the asymmetry of
the chromophores (different transition dipoles along each
diagonal). Aside from the spectral shift, we observed that the
double-maximum character of the monomer spectrum (which
is due to vibronic coupling) was lost in the case of the dimer.
For now, the origin of this effect remains unclear and requires
further study. The band maxima will be compared to the
theoretical vertical excitation energies in the following.
The first excitation energies in vacuo for Chl a dimers
complexed with a single 1+
charge tag in two different
optimized ground-state geometries were calculated using
time-dependent density functional theory (TD-DFT;
Figure 4).[23]
The range-separated CAM-B3LYP func-
tional[24,25]
has been found[26]
to provide results similar to
those obtained with the computationally demanding equa-
tion-of-motion coupled-cluster level of theory, and its use
ensured consistency with our previous work. The difference in
the first excitation energies of chlorophyll (for both the a and
b forms) using the charge tags 1+
and 3+
was previously found
to be less than 0.03 eV, and it was for this reason that in the
present work only the simpler 1+
was employed in the
theoretical calculations.[14]
The TD-DFT excitation energies together with the
experimental band maxima are given in Table 1. Values for
both dimer configurations are given because the energy
difference between them was only 0.018 eVat the DFT/CAM-
B3LYP/Def2-SVP level of theory, and so both can be
expected to be significantly populated at 298 K. The distances
between the two magnesium centers are 5.05 Š (stacked
configuration) and 19.04 Š (linear configuration). For com-
parison, the experimental and calculated excitation energies
for the monomeric Chl a·1+
complex from our previous work
are also shown.[14]
The predicted red shift for the two dimer
structures relative to the monomer structure is 30–50 meV,
which is close to the measured value of 50–70 meV consid-
ering an uncertainty of 15 meV in the experimental data.
The main Qy(0,0) absorption band in Chl-containing
proteins is found between 660 nm and 680 nm but absorption
at even longer wavelengths (701–710 nm) is also seen for Chl
units in photosystem I.[16–19,27]
It is easy to account for
absorption in the 660–680 nm region because 1) isolated
neutral Chl a and Chl b that are free of charge tags absorb
maximally at 642 nm and 626 nm, respectively, according to
our previous work, 2) axial ligation has been predicted to give
a red shift of 9–19 nm,[28]
and 3) the shift that is due to exciton
coupling according to our present results is 15–25 nm. The
maximum shift would therefore be about 680 nm. However,
to account for the absorption at 701–710 nm, it seems that
either the two Chl units have to be closer to each other than is
the case here (forced together by the protein environment) to
increase the coupling—although this seems unlikely as the
stacked dimer configuration found in the present work is
already close to the lower limit for the intermolecular
approach—or in addition to the environmental effect of the
protein surroundings, more than two Chl units couple. This is
supported by the crystal structures of systems such as the
major light harvesting complex (LHC-II) and photosystem I
Figure 4. DFT/PBE/Def2-SVP-optimized geometries of the Chl a dimer
tagged with 1+
in stacked (a) and linear (b) configurations. Chl a
displayed in stick format, charge tag displayed in ball-and-stick format.
Hydrogen atoms omitted for clarity.
Table 1: Energies of the experimental band maxima and vertical
transition energies for the Chl a dimer. Values in eV with the
corresponding absorption wavelengths in nm in parentheses.
(Chl a)2·1+
Chl a·1+[a]
DDimer
exp. 1.90 (652) 1.97 (629) À0.07 (+23)
theory (stacked) 2.028 (611) 2.081 (596)[b]
À0.053 (+15)
theory (linear) 2.050 (605) 2.081 (596)[b]
À0.031 (+9)
[a] Values from previous work.[14]
[b] Single value for the unique Chl a
monomer complex configuration.
Figure 3. Total 2.3-photon-corrected action spectra for the dimer com-
plexes compared to the monomer complexes (dashed lines). A) Com-
plexes with charge tag 1+
. B) Complexes with charge tag 3+
. Line
smoothing using spline functions was performed because of the low
resolution of the dimer spectra. For the purpose of consistency
between data sets, the same smoothing was applied to the monomer
spectra.
Angewandte
ChemieCommunications
6250 www.angewandte.org 2016 The Authors. Published by Wiley-VCH Verlag GmbH Co. KGaA, Weinheim Angew. Chem. Int. Ed. 2016, 55, 6248 –6251
VII](https://image.slidesharecdn.com/683d4131-560b-40b7-aabd-4b72f336e72f-161214213503/85/Phd-thesis-Jorgen-Houmoller-final-175-320.jpg)
![from green plants in which close proximity between more
than two Chl pigments occurs frequently.[29,30]
We aim to
investigate the influence of larger pigment assemblies within
these protein–Chl complexes in the future by looking at
trimers or larger clusters of Chl molecules.
Acknowledgements
B.F.M. acknowledges funding from the Portuguese Founda-
tion for Science and Technology (CONT_DOUT/11/UC/405/
10150/18/2008) and thanks the DIPC and CFM (UPV/EHU)
and the Laboratory for Advanced Computation (University
of Coimbra) for support. S.B.N. acknowledges support from
the Danish Council for Independent Research (4181-00048B)
and the Villum Foundation. A.R. acknowledges financial
support from the European Research Council (ERC-2010-
AdG-267374), a Spanish grant (FIS2013-46159-C3-1-P),
Grupos Consolidados (IT578-13), AFOSR (FA2386-15-1-
0006), AOARD (144088), the H2020-NMP-2014 project
MOSTOPHOS (SEP-210187476), and COST Action
(MP1306, “EUSpec”).
Keywords: absorption spectroscopy · chlorophyll ·
density functional calculations · mass spectrometry ·
photosynthesis
How to cite: Angew. Chem. Int. Ed. 2016, 55, 6248–6251
Angew. Chem. 2016, 128, 6356–6359
[1] G. D. Scholes, T. Mirkovic, D. B. Turner, F. Fassioli, A. Buchleit-
ner, Energy Environ. Sci. 2012, 5, 9374 – 9393.
[2] G. R. Fleming, G. S. Schlau-Cohen, K. Amarnath, J. Zaks,
Faraday Discuss. 2012, 155, 27 – 41.
[3] Y. C. Cheng, G. R. Fleming, Annu. Rev. Phys. Chem. 2009, 60,
241 – 262.
[4] J. Gross, Pigments in vegetables: chlorophylls and carotenoids,
Springer, New York, 1991.
[5] J. Jornet-Somoza, J. Alberdi-Rodriguez, B. F. Milne, X.
Andrade, M. A. L. Marques, F. Nogueira, M. J. T. Oliveira,
J. J. P. Stewart, A. Rubio, Phys. Chem. Chem. Phys. 2015, 17,
26599.
[6] L. Joly, R. Antione, A. R. Alloche, M. Broyer, J. Lemoine, P.
Dugourd, J. Am. Chem. Soc. 2007, 129, 8428 – 8429.
[7] G. FØraud, C. Dedonder, C. Jouvet, Y. Inokuchi, T. Haino, R.
Sekiya, T. Ebata, J. Phys. Chem. Lett. 2014, 5, 1236 – 1240.
[8] J. Rajput, D. B. Rahbek, L. H. Andersen, A. Hirshfeld, M.
Sheves, P. Altoe, G. Orlandi, M. Garavelli, Angew. Chem. Int.
Ed. 2010, 49, 1790 – 1793; Angew. Chem. 2010, 122, 1834 – 1837.
[9] S. Xu, S. Gozem, A. I. Krylov, C. R. Christopher, J. M. Weber,
Phys. Chem. Chem. Phys. 2015, 17, 31938 – 31946.
[10] J. F. Greisch, M. E. Harding, M. Kordel, W. Klopper, M. M.
Kappes, D. Schoos, Phys. Chem. Chem. Phys. 2013, 15, 8162 –
8170.
[11] S. M. J. Wellman, R. A. Jockusch, J. Phys. Chem. A 2015, 119,
6333 – 6338.
[12] N. J. A. Coughlan, B. D. Adamson, L. Gamon, K. Catani, E. J.
Bieske, Phys. Chem. Chem. Phys. 2015, 17, 22623 – 22631.
[13] N. Shafizadeh, M. H. Ha-Thi, B. Soep, M. A. Gaveau, F. Piuzzi,
C. Pothier, J. Chem. Phys. 2011, 135, 114303.
[14] B. F. Milne, Y. Toker, A. Rubio, S. B. Nielsen, Angew. Chem. Int.
Ed. 2015, 54, 2170 – 2173; Angew. Chem. 2015, 127, 2198 – 2201.
[15] M. H. Stockett, L. Musbat, C. Kjær, J. Houmøller, Y. Toker, A.
Rubio, B. F. Milne, S. B. Nielsen, Phys. Chem. Chem. Phys. 2015,
17, 25793 – 25798.
[16] E. L. Smith, J. Gen. Physiol. 1941, 24, 565 – 582.
[17] N. W. Withers, R. S. Alberte, R. A. Lewin, J. P. Thornber, G.
Britton, T. W. Goodwin, Proc. Natl. Acad. Sci. USA 1978, 75,
2301 – 2305.
[18] J. A. Guikema, L. A. Sherman, Arch. Biochem. Biophys. 1983,
220, 155 – 166.
[19] J. C. Waldron, J. M. Anderson, Eur. J. Biochem. 1979, 102, 357 –
362.
[20] S. Baghbanzadeh, I. Kassal, Phys. Chem. Chem. Phys. 2016, 18,
7459 – 7467.
[21] K. Støchkel, B. F. Milne, S. B. Nielsen, J. Phys. Chem. A 2011,
115, 2155 – 2159.
[22] J. A. Wyer, S. B. Nielsen, Angew. Chem. Int. Ed. 2012, 51, 10256 –
10260; Angew. Chem. 2012, 124, 10402 – 10406.
[23] E. Runge, E. K. U. Gross, Phys. Rev. Lett. 1984, 52, 997.
[24] M. J. G. Peach, P. Benfield, T. Helgaker, D. J. Tozer, J. Chem.
Phys. 2008, 128, 044118.
[25] M. J. G. Peach, C. R. Le Sueur, K. Ruud, M. Guillaume, D. J.
Tozer, Phys. Chem. Chem. Phys. 2009, 11, 4465 – 4470.
[26] K. Støchkel, C. N. Hansen, J. Houmøller, L. M. Nielsen, K.
Anggara, M. Linares, P. Norman, F. Nogueira, O. V. Maltsev, L.
Hintermann, S. B. Nielsen, P. Naumov, B. F. Milne, J. Am. Chem.
Soc. 2013, 135, 6485 – 6493.
[27] J. E. Mullet, J. J. Burke, C. J. Arntzen, Plant Physiol. 1980, 65,
814 – 822.
[28] J. Heimdal, K. P. Jensen, A. Devarajan, J. Biol. Inorg. Chem.
2007, 12, 49 – 61.
[29] Z. Liu, H. Yan, K. Wang, T. Kuang, J. Zhang, L. Gui, Nature
2004, 428, 287 – 292.
[30] A. Ben-Shem, F. Frolow, N. Nelson, Nature 2003, 426, 630 – 635.
Received: February 25, 2016
Published online: April 13, 2016
Angewandte
ChemieCommunications
6251Angew. Chem. Int. Ed. 2016, 55, 6248 –6251 2016 The Authors. Published by Wiley-VCH Verlag GmbH Co. KGaA, Weinheim www.angewandte.org
VII](https://image.slidesharecdn.com/683d4131-560b-40b7-aabd-4b72f336e72f-161214213503/85/Phd-thesis-Jorgen-Houmoller-final-176-320.jpg)
![REVIEW OF SCIENTIFIC INSTRUMENTS 87, 053103 (2016)
A cylindrical quadrupole ion trap in combination with an electrospray ion
source for gas-phase luminescence and absorption spectroscopy
Mark H. Stockett,a)
Jørgen Houmøller, Kristian Støchkel, Annette Svendsen,
and Steen Brøndsted Nielsen
Department of Physics and Astronomy, Aarhus University, Aarhus, Denmark
(Received 5 February 2016; accepted 16 April 2016; published online 3 May 2016)
A relatively simple setup for collection and detection of light emitted from isolated photo-excited
molecular ions has been constructed. It benefits from a high collection efficiency of photons, which
is accomplished by using a cylindrical ion trap where one end-cap electrode is a mesh grid combined
with an aspheric condenser lens. The geometry permits nearly 10% of the emitted light to be
collected and, after transmission losses, approximately 5% to be delivered to the entrance of a grating
spectrometer equipped with a detector array. The high collection efficiency enables the use of pulsed
tunable lasers with low repetition rates (e.g., 20 Hz) instead of continuous wave (cw) lasers or
very high repetition rate (e.g., MHz) lasers that are typically used as light sources for gas-phase
fluorescence experiments on molecular ions. A hole has been drilled in the cylinder electrode so that
a light pulse can interact with the ion cloud in the center of the trap. Simulations indicate that these
modifications to the trap do not significantly affect the storage capability and the overall shape of the
ion cloud. The overlap between the ion cloud and the laser light is basically 100%, and experimentally
50% of negatively charged chromophore ions are routinely photodepleted. The performance of the
setup is illustrated based on fluorescence spectra of several laser dyes, and the quality of these spectra
is comparable to those reported by other groups. Finally, by replacing the optical system with a
channeltron detector, we demonstrate that the setup can also be used for gas-phase action spectros-
copy where either depletion or fragmentation is monitored to provide an indirect measurement on the
absorption spectrum of the ion. Published by AIP Publishing. [http://dx.doi.org/10.1063/1.4948316]
I. INTRODUCTION
Spectroscopy of (bio)molecular chromophore ions iso-
lated in vacuo is a field of intense research with the goal
to reveal their intrinsic electronic structure in the absence of
perturbations from a solvent or protein micro-environment.1–7
These large and fragile chromophore ions are typically
produced by electrospray ionization (ESI) to guarantee a soft
transfer to the gas phase. Comparisons of gas-phase spectra
to those measured when the chromophore is fully solvated
or within a protein pocket provide information on, e.g., the
effect of nearby water molecules or amino acid residues.
Most work has focused on absorption spectroscopy where
absorption is identified indirectly from either ion dissociation
or electron detachment, so-called action spectroscopy. This is
because the ion density is too low for a traditional transmission
experiment where the attenuation of light passing through a
sample is measured. Instead, specialized mass spectroscopy
equipment is required to identify the fate of the ion after light
absorption. Only a few experimental groups have measured
the light emitted from mass-selected photoexcited ions. Here
we present a new setup to measure luminescence from ions
produced by ESI, but first we discuss some of the difficulties
associated with such experiments.
In most luminescence spectroscopy experiments on
molecular ions produced by ESI, the ions are trapped in either
a)Electronic mail: stockett@phys.au.dk
a linear quadrupole trap, a Paul trap (i.e, a 3-D quadrupole
trap), or a Penning trap.8–16
The experiments are non-trivial,
not only because of the inherently low ion density but also
because photons areemitted in all directions, and the collection
of the emitted photons is limited by poor optical access to the
trapped ions. Sensitive light detectors are needed to detect
each of the rare events. Detection efficiencies are typically
much less than 1% of the total emitted photons. As an added
complication, light scattered from the laser or ambient light
is also detected, which reduces the signal-to-noise ratio, or
even causes saturation of the detector if one is not careful
enough. The same ions are irradiated multiple times with the
use of either high repetition rate (e.g., 80 MHz) pulsed lasers
or continuous wave (cw) lasers. This approach necessitates
collisional (or radiative) cooling of the excited ions between
each excitation event. The pressure of the helium buffer gas
used to facilitate the trapping of the ions, together with the
applied laser power, are therefore highly important adjustable
parameters. The rate of collisions at typical buffer gas densities
(1014
cm−3
) is ∼105
s−1
while the time between two laser pulses
from an 80 MHz laser is only 12.5 ns. For a pulsed laser
experiment, the number of photons in each pulse has to be
kept low to avoid two-photon absorption, which is the reason
for the use of high repetition rate lasers. The optimal solution
is to produce a high number of photons broadly distributed
over time to maximize the number of excitation events, each
associated with emitted photons from the ions being hit. A cw
laser is as such the best choice but the wavelength tunability
is poor compared to that of a pulsed laser. An alternative
0034-6748/2016/87(5)/053103/9/$30.00 87, 053103-1 Published by AIP Publishing.
Reuse of AIP Publishing content is subject to the terms at: https://publishing.aip.org/authors/rights-and-permissions. Download to IP: 130.225.184.6 On: Fri, 12 Aug
2016 18:46:53
VIII](https://image.slidesharecdn.com/683d4131-560b-40b7-aabd-4b72f336e72f-161214213503/85/Phd-thesis-Jorgen-Houmoller-final-177-320.jpg)


![053103-7 Stockett et al. Rev. Sci. Instrum. 87, 053103 (2016)
setups where fluorescence is measured from ions produced by
ESI. (2) Fluorescence spectra are independent of helium buffer
gas pressure as discussed above. (3) The number of photons
emitted is directly related to the fluorescence quantum yield
and does not change between each laser shot. Hence the time it
takes to record a given number of photons emitted from a cloud
of trapped ions is linearly proportional to the fluorescence
quantum yield. If we assume 100% fluorescence quantum
yields for the laser dyes studied, it would take 100 times longer
to detect the same number of photons from ions that have a
quantum yield of say only 1%. This is a doable experiment.
(4) If electron detachment or prompt dissociation occur with
a certain probability (Ploss), the number of ions, N(n), in a
multiple irradiation experiment quickly decreases with the
number of laser shots (n): N(n) = N0(1 − Ploss · Pabs)n
. Here,
N0 is the initial number of ions in the trap, and Pabs is
the probability with which the ion absorbs a photon, which
depends on the laser power and can be as high as 50% in
our experiments (see Section V). Even if Ploss · Pabs is only
1%, N is reduced by more than four orders of magnitudes
after n = 1000 laser shots, that is after only about 10 µs
using a 80 MHz laser. This issue is irrelevant with our setup
as long as the fluorescence quantum yield is non-zero. (5)
The replacement of ions between each laser shot could be
important for further development of a setup for detecting
fluorescence from cryogenically cooled ions. Here cooling
times between irradiation events become more crucial, which
is an issue that is avoided with a low repetition rate. In
such experiments, the octupole ion guide in our ESI source
could be used as a pre-trap to maximize the cooling time
in the Paul trap, an approach that has been demonstrated
previously.40
V. DEPLETION MEASUREMENTS
In order to optimize the trapping parameters and laser-
ion overlap, we performed photo-depletion measurements on
several molecular anions. These experiments also demonstrate
the possibilities for utilizing our apparatus for absorption ac-
tion spectroscopy. For these measurements, the condenser lens
and optical assembly is removed and a channeltron detector
placed outside the trap facing the grid electrode. While being
continuously filled with ions from the electrospray source,
the trap is emptied at a repetition rate of 40 Hz. This is
accomplished by switching off the RF voltage (1/e fall-time
∼3 µs) and swapping the polarity of the DC voltage on the
entrance end-cap from +15 V to −15 V (for negative ions)
while keeping the exit end-cap at +15 V. Prior to every
FIG. 12. Action spectroscopy of pCA− ions stored in the trap. Panel (a) shows the time profiles of the ion bunches ejected from the trap with (ON, red) and
without (OFF, blue) laser irradiation, and the difference between the ON and OFF signals (Difference, black) showing clear evidence for photodepletion of the
stored pCA− ions. For times 12 µs the difference signal is negative indicating electron detachment, whereas for times 12 µs the difference signal is positive,
suggesting fragmentation of the pCA− ions. Panel (b) shows simulated time profiles for 1000 ions of mass 163 amu (pCA−, green) and 119 amu ([pCA-CO2]−,
pink) stored in the trap using the same parameters as the experiment. Panel (c) are hypothetical ON, OFF and difference profiles (same labelling as (a)) based
on the simulated time profiles in (b). Panel (d) shows the normalized magnitude of the experimental difference signal as a function of excitation wavelength for
times 12 µs (black) and 12 µs (gray). Also shown are action spectra recorded at the ELISA storage ring.42
Reuse of AIP Publishing content is subject to the terms at: https://publishing.aip.org/authors/rights-and-permissions. Download to IP: 130.225.184.6 On: Fri, 12 Aug
2016 18:46:53
VIII](https://image.slidesharecdn.com/683d4131-560b-40b7-aabd-4b72f336e72f-161214213503/85/Phd-thesis-Jorgen-Houmoller-final-183-320.jpg)


![THE JOURNAL OF CHEMICAL PHYSICS 145, 104303 (2016)
Nile blue shows its true colors in gas-phase absorption
and luminescence ion spectroscopy
M. H. Stockett,a)
J. Houmøller, and S. Brøndsted Nielsen
Department of Physics and Astronomy, Aarhus University, Aarhus, Denmark
(Received 15 July 2016; accepted 26 August 2016; published online 9 September 2016)
Nile blue is used extensively in biology as a histological stain and fluorescent probe. Its absorption and
emission spectra are strongly solvent dependent, with variations larger than 100 nm. The molecule is
charged due to an iminium group, and it is therefore an obvious target for gas-phase ion spectroscopy.
Here we report the absorption and emission spectra of the mass-selected bare ions isolated in vacuo,
and based on our results we revisit the interpretation of solution-phase spectra. An accelerator
mass spectrometer was used for absorption spectroscopy where the absorption is represented by the
yield of photofragment ions versus excitation wavelength (action spectroscopy). The luminescence
experiments were done with a newly built ion trap setup equipped with an electrospray ion source,
and some details on the mass selection technique will be given which have not been described before.
In vacuo, the absorption and emission maxima are at 580 ± 10 nm and 628 ± 1 nm. These values are
somewhat blue-shifted relative to those obtained in most solvents; however, they are much further to
the red than those in some of the most non-polar solvents. Furthermore, the Stokes shift in the gas
phase (1300 cm−1
) is much smaller than that in these non-polar solvents but similar to that in polar
ones. An explanation based on charge localization by solvent dipoles, or by counterions in some
non-polar solvents, can fully account for these findings. Hence in the case of ions, it is nontrivial to
establish intrinsic electronic transition energies from solvatochromic shifts alone. Published by AIP
Publishing. [http://dx.doi.org/10.1063/1.4962364]
I. INTRODUCTION
Nile blue (NB) is a histological stain that has found
wide applications as a fluorescent probe1
and in cell biology.2
It is a phenoxazinium and carries one positive charge that is
delocalized over the whole molecule; two important resonance
formulas are shown in Fig. 1 where either the diethylamino
substituent or the amino substituent is an iminium. The
heterocyclic oxygen bridges the conjugation and is also partly
positively charged. This electronic delocalization gives rise
to strong absorption in the visible region and thus intensely
colored solutions. NB is soluble in polar solvents like water,
largely because of the positive charge, which can be important
for some biotechnological applications.
The spectroscopic properties of Nile blue, the structurally
similar (but neutral) Nile red, and their derivatives have
been investigated in great detail.3–8
The electronic transition
energies of NB decrease as the solvent polarity increases,
e.g., absorption (emission) band maxima are 473 nm
(546 nm) in n-hexane and 635 nm (674 nm) in water.8
The fluorescence quantum yield is also solvent dependent,
with measured values ranging from 0.01 in water9
to 0.27
in methanol and 0.50 in 1,2-dichloroethane.10
However,
these effects do not have a simple dependence on solvent
polarity, which has led to considerable disagreement over
the character of the transition. This matter is complicated
by the possibility, recognized by several authors,5,7
that
a)Author to whom correspondence should be addressed. Electronic mail:
stockett@phys.au.dk
heterogeneous ion-counterion pairs may be formed in some
non-polar solvents; this issue will be addressed further
here.
Gas-phase ion spectroscopy is necessary to firmly
establish the intrinsic spectroscopic properties of NB in the
absence of environmental perturbations induced by solvent
molecules or counter-anions. Experimental gas-phase data
are also useful to benchmark quantum chemical calculations
of the NB optical properties.3,6
In this work, we have
studied the absorption by NB isolated in vacuo using Photo-
Induced Dissociation (PID) action spectroscopy as well as
its luminescence spectrum after photo-excitation utilizing a
new instrument in which a quadrupole ion trap is coupled to
an optical spectrometer.11
We note that earlier gas-phase
spectroscopy of NB is limited to the infrared multiple
photon dissociation (IRMPD) spectrum revealing vibrational
frequencies.4
II. EXPERIMENTAL DETAILS
In the study of complex molecules in the gas-phase,
the density of ions in vacuo is too low for traditional
transmission experiments employing Beer’s law. Instead,
action spectroscopy is performed using specially designed
mass spectrometers. Photon absorption is identified indirectly
from the production of ion fragments, neutrals, or electrons
whose yields are monitored versus excitation wavelength.
Such a spectrum is taken to represent the electronic absorption
spectrum.
0021-9606/2016/145(10)/104303/5/$30.00 145, 104303-1 Published by AIP Publishing.
Reuse of AIP Publishing content is subject to the terms: https://publishing.aip.org/authors/rights-and-permissions. Downloaded to IP: 178.157.222.87 On: Fri, 09 Sep
2016 21:59:08
IX](https://image.slidesharecdn.com/683d4131-560b-40b7-aabd-4b72f336e72f-161214213503/85/Phd-thesis-Jorgen-Houmoller-final-186-320.jpg)
![104303-2 Stockett, Houmøller, and Brøndsted Nielsen J. Chem. Phys. 145, 104303 (2016)
FIG. 1. Dominant resonance formulas of Nile blue.
The accelerator mass spectrometer instrument for gas-
phase ion absorption spectroscopy has been described in
detail previously.12,13
Briefly, NB was produced in gas phase
by electrospray ionization (ESI) of NB dissolved in methanol.
Ions were accumulated in an octopole ion trap that was
emptied every 25 ms. Ions were accelerated to 50 keV
kinetic energies, and those of interest were selected by a
bending magnet by their mass to charge ratio (m/z = 318 amu
for NB). Every second ion bunch was irradiated with
visible light from a 20 Hz laser system (EKSPLA). The
fundamental from an Nd:YAG laser was frequency tripled
to 355 nm, which was used to pump an optical parametric
oscillator (OPO) to produce visible light. Neutral density
filters were used to reduce laser power when needed.
Fragment ions produced were separated by a hemispherical
electrostatic analyzer and counted by a channeltron detector.
Synchronization and timing were controlled by a LabView
program.
In the case of luminescence spectroscopy, photons emitted
by laser-excited ions are collected and detected. This is
nontrivial due again to the low number of ions but also due to
limited optical access to the ions in the radio-frequency (RF)
ion traps typically used in these experiments.14,15
It is crucial
to diminish the scattered light to an absolute minimum.16
Our
setup for luminescence experiments (LUNA) has also been
described previously.11
The heart of this instrument, shown
schematically in Fig. 2, is a custom-made cylindrical Paul trap
with integrated optics and a large light-collection solid angle.
We have implemented a new scheme for mass selection of
trapped ions prior laser irradiation which is suitable for use
with low repetition rate pulsed lasers such as that employed
here (20 Hz). In contrast to other researchers using cw or MHz
repetition rate lasers,14,17
the ions in our trap are irradiated
by a single laser shot before the trap is emptied and refilled.
This eliminates problems like photobleaching and the need
for fine-tuning of the laser power and buffer gas pressure.18
The details of this scheme are found in the supplementary
material.
Ions produced by ESI are accumulated in an octopole
for 50 ms. The ion bunch is then transferred to the Paul
trap, where the ions are cooled to the center in collisions
with helium buffer gas. After a certain storage time (∼1 ms),
the DC voltage on the cylinder electrode is changed to mass
select the ions of interest (see the supplementary material).
Next follows the laser excitation pulse (from the same 20 Hz
repetition rate laser system described above) and the detection
of fluorescence. To correct for scattered laser light and other
background sources, the experiment is repeated in alternating
sets of 100 cycles with ions in the trap followed by 100
cycles with no ions (the trap RF voltage is switched off). The
difference between the “ions on” and “ions off” acquisitions
is the fluorescence signal.
III. RESULTS AND DISCUSSION
A. Photo-induced dissociation action spectroscopy
Excitation of Nile blue at 560 nm leads to one dominant
fragment ion (m/z = 274 amu), formed after loss of C3H8
(44 amu) from the parent ion (318 amu) via a 1,2-elimination
process within the diethylamino group. This dissociation
channel was also seen to dominate after absorption of multiple
IR photons.4
Minor fragment ions are at m/z = 303 [0.08]:
loss of CH3, 289 [0.08]: loss of CH3CH2, 260 [0.03]: loss
of two CH3CH2, and 246 [0.05]: loss of N(CH2CH3)2, with
their yields given relative to m/z = 274 amu in brackets.
The mass resolution is low and the given masses could be
off by 1 amu. Laser power dependence experiments were
FIG. 2. The luminescence in Aarhus instrument, LUNA.11
Reuse of AIP Publishing content is subject to the terms: https://publishing.aip.org/authors/rights-and-permissions. Downloaded to IP: 178.157.222.87 On: Fri, 09 Sep
2016 21:59:08
IX](https://image.slidesharecdn.com/683d4131-560b-40b7-aabd-4b72f336e72f-161214213503/85/Phd-thesis-Jorgen-Houmoller-final-187-320.jpg)
![104303-3 Stockett, Houmøller, and Brøndsted Nielsen J. Chem. Phys. 145, 104303 (2016)
FIG. 3. Absorption (blue) and emission (red) spectra of NB in vacuo. The
solid red line is a fit to the emission data. The vertical lines indicate the
absorption and emission band maxima and their uncertainties.
performed to establish the number of photons absorbed by
the parent ions in order to form each fragment within the
instrumental time scale of 20 µs. For m/z = 274 and 303 amu,
the yield increased quadratically with the laser power (shown
for m/z = 274 in Fig. S3 of the supplementary material),
indicating a 2-photon process. At high laser power, some
saturation occurred. All other fragments appeared to result
from the absorption of 3 or more photons. For the wavelength
scan experiments, neutral density filters were therefore used
to reduce laser power where needed in the spectrum. Several
scans (more than ten) were combined to give the action
spectrum for the formation of m/z = 274 in Fig. 3; each
data point is obtained after subtraction of “laser off” signal
from “laser on” signal divided by the number of photons
in the pulse raised to second order (to account for the
2-photon power dependence and the variation of the laser
power across the tuning range). It is evident that absorption oc-
curs over a broad region from 480 nm to 650 nm. Similar action
spectra were obtained for the other fragment ions (not shown).
The absorption band maximum is at about 580 nm with an
uncertainty of ±10 nm, as indicated by the blue shaded area in
Fig. 3.
Time-Dependent Density Functional Theory (TD-DFT)
calculations predict a gas-phase absorption band maximum of
512 nm for NB cations,6
while the dynamic approach taken
by Marazzi et al. predicts 545 or 585 nm, depending on
the functional used. The rather large differences between
theoretical methods and between theory and experiment
illustrate the importance of performing such experiments in
the gas-phase.
B. Luminescence spectroscopy of Nile blue cations
in vacuo
NB ions were mass-selected and stored in the Paul
trap, followed by irradiation with laser light. Two excitation
wavelengths were used, 560 nm and 515 nm, within the
absorption band of the ions (vide supra). The luminescence
spectrum after 560 nm excitation is shown in Fig. 3. The solid
line is a fit to the data using a sum of two extreme value
functions,
FIG. 4. Emission from NB ions in vacuo with λex = 515 nm. The solid line is
a 50-point Savitzky-Golay smoothing. The vertical line indicates the emission
band maximum obtained from the λex = 560 nm spectrum (Fig. 3).
y = A × exp[−exp((x − x0)/w) − (x − x0)/(w)] (1)
as recommended by Greisch et al.19
The position of the band
maximum obtained from this fit is 628 ± 1 nm. There is a
small shoulder at 668 nm due to a vibronic transition with a
vibrational frequency of about 1400 cm−1
. This shoulder is
also reflected in the absorption spectrum at around 536 nm.
The spectrum obtained after 515 nm excitation (Fig. 4) is
similar but of lower quality as this wavelength is in the tail of
the absorption band.
Comparing the maxima of the gas-phase absorption
and emission spectra (Fig. 3), the Stokes shift is about
1300 ± 300 cm−1
. This is significantly greater than that
seen in other gas-phase ion experiments, e.g., 500 cm−1
for rhodamine cations.20
According to resonance Raman
spectroscopy of NB in solution, a 590 cm−1
vibrational mode
is strongly coupled with the electronic transition.21
A simple
scheme can therefore account for the shift: absorption involves
the 590 cm−1
mode with v′
− v = +1 (v′
and v are excited
state and ground state vibrational quantum numbers) followed
by internal vibrational redistribution (IVR) and ∆v′
= −1.
According to the mirror-image rule, the emission will then
be associated with v′
− v = −1. As a result, the difference
between absorption and emission is two quanta of 590 cm−1
,
i.e., 1180 cm−1
. This number is close to the measured shift of
1300 cm−1
, noting that the frequency may be different for the
gas-phase ion than in solution.
C. Comparison with spectroscopic data for Nile blue
in solution
Dutt et al.,22
Krihak et al.,23
Jose and Burgess,8
and
Gilani et al.5
give values for the absorption and emission band
maxima of NB in different solvents, mostly with chloride
or perchlorate counter-anions. In Fig. 5 we have plotted
these values versus the normalized solvent polarity, EN
T .
This scale is based on the ET(30) scale but normalized so
that tetramethylsilane has a polarity of 0 and water 1.24
The
ET(30) values refer to excitation energies of propidium phenol
betaine in different solvents.25
This indicator molecule is a
neutral zwitterion which experiences a significant decrease in
Reuse of AIP Publishing content is subject to the terms: https://publishing.aip.org/authors/rights-and-permissions. Downloaded to IP: 178.157.222.87 On: Fri, 09 Sep
2016 21:59:08
IX](https://image.slidesharecdn.com/683d4131-560b-40b7-aabd-4b72f336e72f-161214213503/85/Phd-thesis-Jorgen-Houmoller-final-188-320.jpg)


