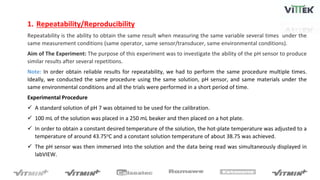
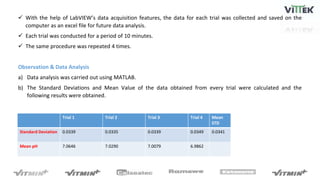
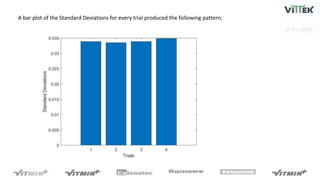
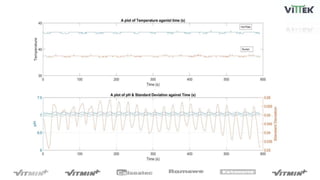
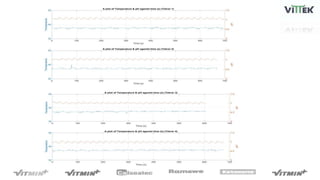
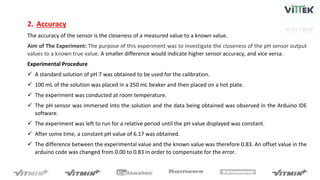
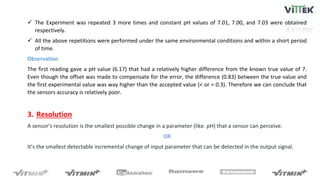
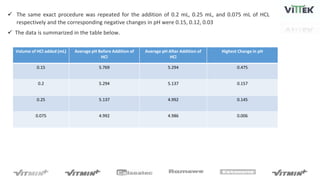
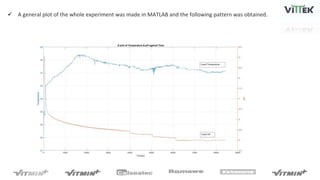
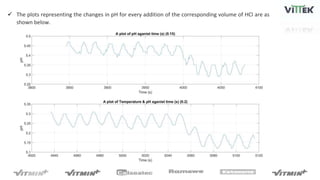
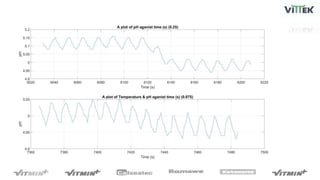
R&D ACTIVITY REPORT
pH Sensor Calibration
1. Repeatability/Reproducibility
Repeatability is the ability to obtain the same result when measuring the same variable several times under the
same measurement conditions (same operator, same sensor/transducer, same environmental conditions).
Aim of The Experiment: The purpose of this experiment was to investigate the ability of the pH sensor to produce
similar results after several repetitions.
Note: In order obtain reliable results for repeatability, we had to perform the same procedure multiple times.
Ideally, we conducted the same procedure using the same solution, pH sensor, and same materials under the
same environmental conditions and all the trials were performed in a short period of time.
Experimental Procedure
 A standard solution of pH 7 was obtained to be used for the calibration.
 100 mL of the solution was placed in a 250 mL beaker and then placed on a hot plate.
 In order to obtain a constant desired temperature of the solution, the hot-plate temperature was adjusted to a
temperature of around 43.75oC and a constant solution temperature of about 38.75 was achieved.
 The pH sensor was then immersed into the solution and the data being read was simultaneously displayed in
labVIEW.
 With the help of LabVIEW’s data acquisition features, the data for each trial was collected and saved on the
computer as an excel file for future data analysis.
 Each trial was conducted for a period of 10 minutes.
 The same procedure was repeated 4 times.
Observation & Data Analysis
a) Data analysis was carried out using MATLAB.
b) The Standard Deviations and Mean Value of the data obtained from every trial were calculated and the
following results were obtained.
Trial 1 Trial 2 Trial 3 Trial 4 Mean
STD
Standard Deviation 0.0339 0.0335 0.0339 0.0349 0.0341
Mean pH 7.0646 7.0290 7.0079 6.9862
A bar plot of the Standard Deviations for every trial produced the following pattern;
2. Accuracy
The accuracy of the sensor is the closeness of a measured value to a known value.
Aim of The Experiment: The purpose of this experiment was to investigate the closeness of the pH sensor output
values to a known true value. A smaller difference would indicate higher sensor accuracy, and vice versa.
Experimental Procedure
 A standard solution of pH 7 was obtained to be used for the calibration.
 100 mL of the solution was placed in a 250 mL beaker and then placed on a hot plate.
 The experiment was conducted at room temperature.
 The pH sensor was immersed into the solution and the data being obtained was observed in the Arduino IDE
software.
 The experiment was left to run for a relative period until the pH value displayed was constant.
 After some time, a constant pH value of 6.17 was obtained.
 The difference between the experimental value and the known value was therefore 0.83. An offset value in the
arduino code was changed from 0.00 to 0.83 in order to compensate for the error.
 The Experiment was repeated 3 more times and constant pH values of 7.01, 7.00, and 7.03 were obtained
respectively.
 All the above repetitions were performed under the same environmental conditions and within a short period
of time.
Observation
The first reading gave a pH value (6.17) that had a relatively higher difference from the known true value of 7.
Even though the offset was made to compensate for the error, the difference (0.83) between the true value and
the first experimental value was way higher than the accepted value (< or = 0.3). Therefore we can conclude that
the sensors accuracy is relatively poor.
3. Resolution
A sensor’s resolution is the smallest possible change in a parameter (like. pH) that a sensor can perceive.
OR
It’s the smallest detectable incremental change of input parameter that can be detected in the output signal.
Aim of The Experiment: The purpose of this experiment was to determine the smallest change in pH of the
solution that the sensor could detect.
Experimental Procedure
 A standard HCl solution of 0.000316 M & pH 3.5 plus 200 mL of deionized water was used for the
experiment.
 200 mL of deionized water was placed in a 250 mL beaker and then placed on a hot plate.
 The pH sensor and a liquid temperature thermocouple were then immersed into the solution and the
data collected was simultaneously displayed in labVIEW.
 Additionally, the data for the whole experiment was saved on the computer as an excel file for future
data analysis.
 Initially, the experiment was left to run for a relative period of time until the pH value displayed was
constant.
 0.15 mL of HCl was then to the water and the solution was continuously stirred using the magnet
stirrer.
 A sudden drop in pH was observed. The experiment was left to run until the pH values obtained were
constant. A highest negative 0.17 final change in pH was obtained.
 The same exact procedure was repeated for the addition of 0.2 mL, 0.25 mL, and 0.075 mL of HCL
respectively and the corresponding negative changes in pH were 0.15, 0.12, 0.03
 The data is summarized in the table below.
Volume of HCl added (mL) Average pH Before Addition of
HCl
Average pH After Addition of
HCl
Highest Change in pH
0.15 5.769 5.294 0.475
0.2 5.294 5.137 0.157
0.25 5.137 4.992 0.145
0.075 4.992 4.986 0.006
 A general plot of the whole experiment was made in MATLAB and the following pattern was obtained.
 The plots representing the changes in pH for every addition of the corresponding volume of HCl are as
shown below.
pH Calibration.pptx

pH Calibration.pptx

  • 1.
    R&D ACTIVITY REPORT pHSensor Calibration
  • 2.
    1. Repeatability/Reproducibility Repeatability isthe ability to obtain the same result when measuring the same variable several times under the same measurement conditions (same operator, same sensor/transducer, same environmental conditions). Aim of The Experiment: The purpose of this experiment was to investigate the ability of the pH sensor to produce similar results after several repetitions. Note: In order obtain reliable results for repeatability, we had to perform the same procedure multiple times. Ideally, we conducted the same procedure using the same solution, pH sensor, and same materials under the same environmental conditions and all the trials were performed in a short period of time. Experimental Procedure  A standard solution of pH 7 was obtained to be used for the calibration.  100 mL of the solution was placed in a 250 mL beaker and then placed on a hot plate.  In order to obtain a constant desired temperature of the solution, the hot-plate temperature was adjusted to a temperature of around 43.75oC and a constant solution temperature of about 38.75 was achieved.  The pH sensor was then immersed into the solution and the data being read was simultaneously displayed in labVIEW.
  • 3.
     With thehelp of LabVIEW’s data acquisition features, the data for each trial was collected and saved on the computer as an excel file for future data analysis.  Each trial was conducted for a period of 10 minutes.  The same procedure was repeated 4 times. Observation & Data Analysis a) Data analysis was carried out using MATLAB. b) The Standard Deviations and Mean Value of the data obtained from every trial were calculated and the following results were obtained. Trial 1 Trial 2 Trial 3 Trial 4 Mean STD Standard Deviation 0.0339 0.0335 0.0339 0.0349 0.0341 Mean pH 7.0646 7.0290 7.0079 6.9862
  • 4.
    A bar plotof the Standard Deviations for every trial produced the following pattern;
  • 7.
    2. Accuracy The accuracyof the sensor is the closeness of a measured value to a known value. Aim of The Experiment: The purpose of this experiment was to investigate the closeness of the pH sensor output values to a known true value. A smaller difference would indicate higher sensor accuracy, and vice versa. Experimental Procedure  A standard solution of pH 7 was obtained to be used for the calibration.  100 mL of the solution was placed in a 250 mL beaker and then placed on a hot plate.  The experiment was conducted at room temperature.  The pH sensor was immersed into the solution and the data being obtained was observed in the Arduino IDE software.  The experiment was left to run for a relative period until the pH value displayed was constant.  After some time, a constant pH value of 6.17 was obtained.  The difference between the experimental value and the known value was therefore 0.83. An offset value in the arduino code was changed from 0.00 to 0.83 in order to compensate for the error.
  • 8.
     The Experimentwas repeated 3 more times and constant pH values of 7.01, 7.00, and 7.03 were obtained respectively.  All the above repetitions were performed under the same environmental conditions and within a short period of time. Observation The first reading gave a pH value (6.17) that had a relatively higher difference from the known true value of 7. Even though the offset was made to compensate for the error, the difference (0.83) between the true value and the first experimental value was way higher than the accepted value (< or = 0.3). Therefore we can conclude that the sensors accuracy is relatively poor. 3. Resolution A sensor’s resolution is the smallest possible change in a parameter (like. pH) that a sensor can perceive. OR It’s the smallest detectable incremental change of input parameter that can be detected in the output signal.
  • 9.
    Aim of TheExperiment: The purpose of this experiment was to determine the smallest change in pH of the solution that the sensor could detect. Experimental Procedure  A standard HCl solution of 0.000316 M & pH 3.5 plus 200 mL of deionized water was used for the experiment.  200 mL of deionized water was placed in a 250 mL beaker and then placed on a hot plate.  The pH sensor and a liquid temperature thermocouple were then immersed into the solution and the data collected was simultaneously displayed in labVIEW.  Additionally, the data for the whole experiment was saved on the computer as an excel file for future data analysis.  Initially, the experiment was left to run for a relative period of time until the pH value displayed was constant.  0.15 mL of HCl was then to the water and the solution was continuously stirred using the magnet stirrer.  A sudden drop in pH was observed. The experiment was left to run until the pH values obtained were constant. A highest negative 0.17 final change in pH was obtained.
  • 10.
     The sameexact procedure was repeated for the addition of 0.2 mL, 0.25 mL, and 0.075 mL of HCL respectively and the corresponding negative changes in pH were 0.15, 0.12, 0.03  The data is summarized in the table below. Volume of HCl added (mL) Average pH Before Addition of HCl Average pH After Addition of HCl Highest Change in pH 0.15 5.769 5.294 0.475 0.2 5.294 5.137 0.157 0.25 5.137 4.992 0.145 0.075 4.992 4.986 0.006
  • 11.
     A generalplot of the whole experiment was made in MATLAB and the following pattern was obtained.
  • 12.
     The plotsrepresenting the changes in pH for every addition of the corresponding volume of HCl are as shown below.