Download as PDF, PPTX


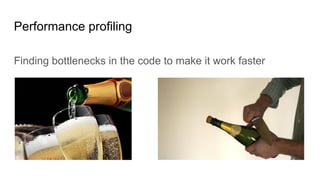
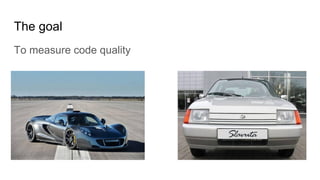


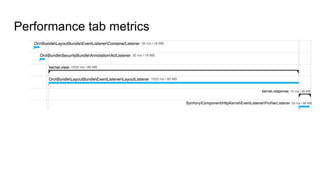
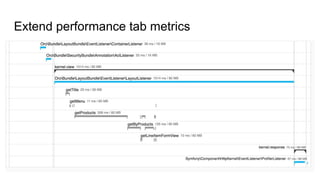
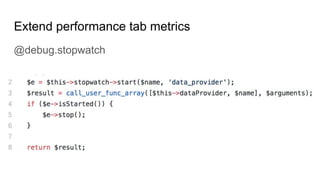
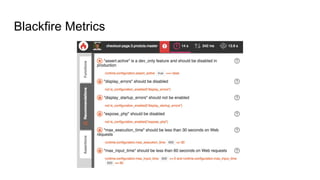
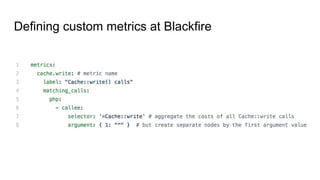
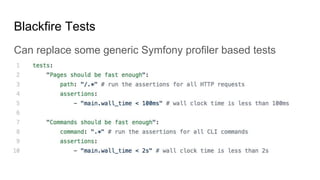
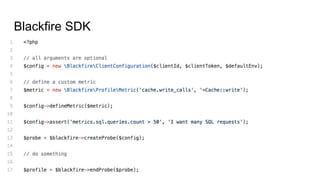
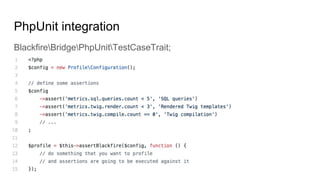
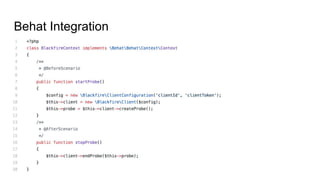
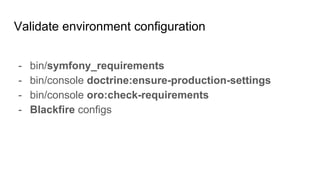

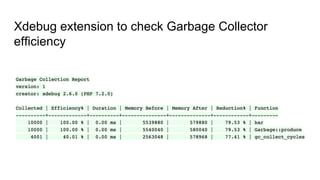
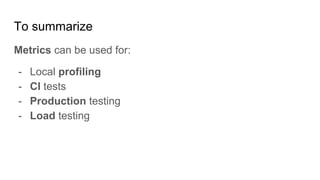
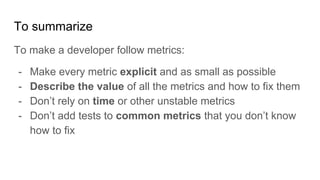
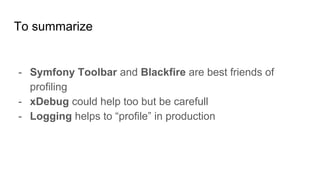


This document discusses performance profiling and testing of a Symfony application. It recommends using tools like the Symfony profiler toolbar, Blackfire, and logging to measure metrics like SQL query times, external API calls, memory usage, and more. Capturing these metrics during testing and in production helps identify bottlenecks in the code related to performance. The goal is to measure code quality from a performance perspective and ensure the application meets requirements for speed and responsiveness.