The document provides an overview of key telecom metrics in India for the quarter ending June 2015. Some key highlights include:
1) Total telephone subscribers increased to 1,006.96 million, a growth of 1.05% over the previous quarter. Wireless subscribers grew to 980.81 million and wireline declined to 26.15 million.
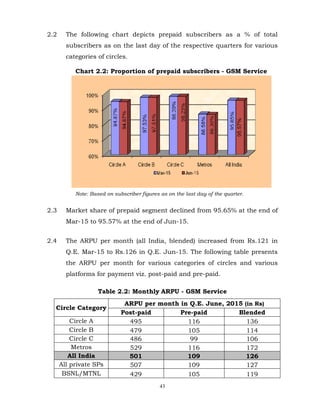
2) Urban subscribers were 584.21 million and rural were 422.75 million. Urban teledensity was 149.70 and rural was 48.66.
3) Private operators accounted for 90.03% of subscribers while PSUs had 9.97%.
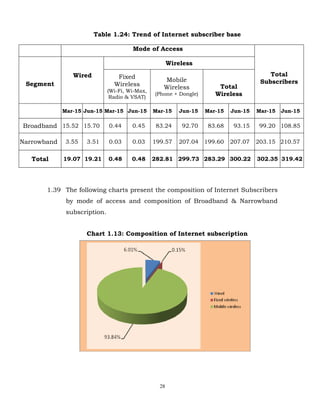
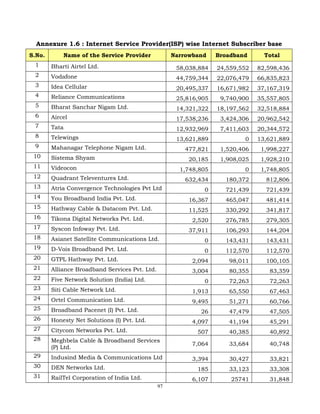
4) Internet subscribers grew 5.65% to 319.42 million,


![10
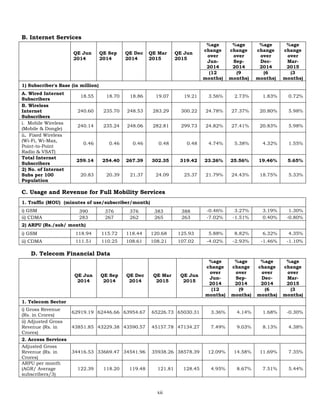
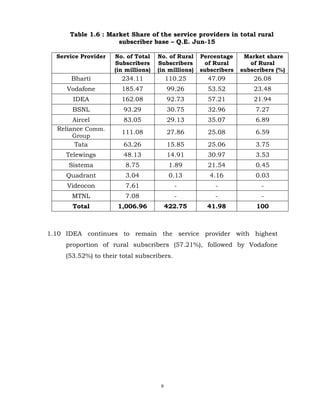
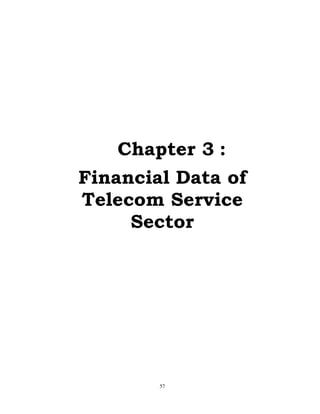
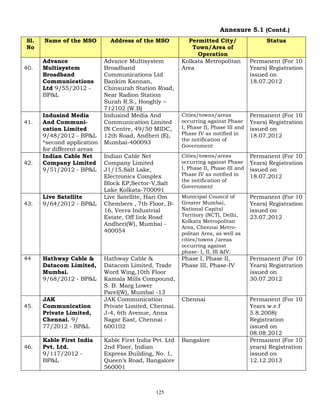
Section B : Wireless Service
Table 1.7: List of Cellular Mobile (GSM & CDMA) Service Providers currently
providing service [As on 30th June, 2015]
Sl.No. Service Provider Area of Operation
1 Bharti All India
2 Aircel Group All India
3 Reliance Communications All India (except Assam & NE)
4 Reliance Telecom Ltd
Kolkata, MP, WB, HP, Bihar, Orissa,
Assam & NE
5 Vodafone All India
6 Tata Teleservices All India except Assam, NE & J&K
7 IDEA All India
8 Sistema Shyam Telelink
Delhi, Kolkata, Gujarat, Karnataka,
Tamil Nadu (incl. Chennai), Kerala,
UP(W), Rajasthan & W.B.
9 BSNL All India (except Delhi & Mumbai)
10 MTNL Delhi & Mumbai
11 Quadrant Punjab
12
Telewings Communications
Services Pvt. Ltd.
MH, Gujarat, AP, UP(W), UP(E), Bihar
13
Videocon
Telecommunications Ltd
Gujarat, Haryana, UP(W), UP(E), MP,
Bihar
1.11 Complete list of licensed Cellular (GSM & CDMA) Service providers
as on 30th June, 2015 is at Annexure -1.1.
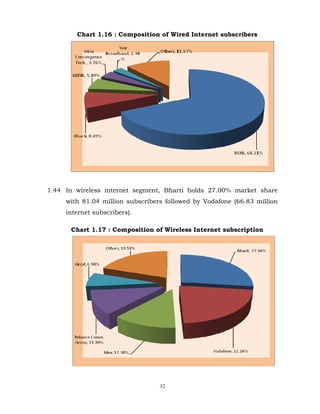
1.12 Total Wireless (GSM+CDMA) subscriber base increased from 969.89
million at the end of Mar-15 to 980.81 million at the end of Jun-15,
thereby showing a gowth rate of 1.13%. During this quarter, net
addition of 10.91 million subscribers was recorded. The year-on-year
(Y-O-Y) growth of wireless subscribers is 7.20% for Q.E. Jun-15.
1.13 Wireless Teledensity increased from 77.27 at the end of Mar-15 to
77.90 at the end of Jun-15.](https://image.slidesharecdn.com/performanceindicatorreportjun2015-160105144718/85/Performance-indicator-report_jun_2015-26-320.jpg)


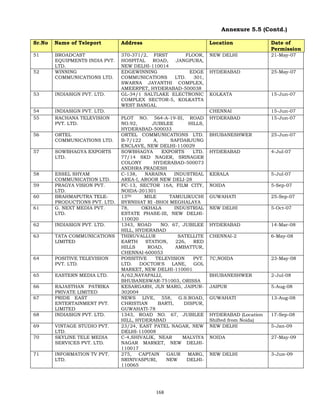
![19
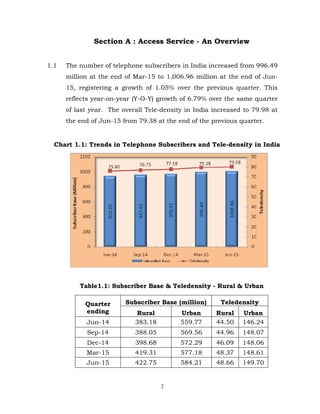
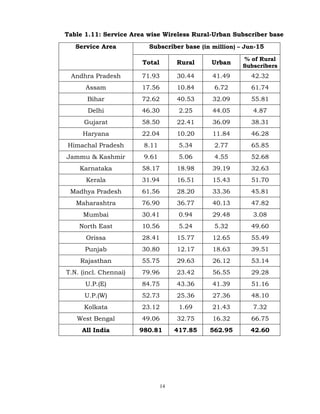
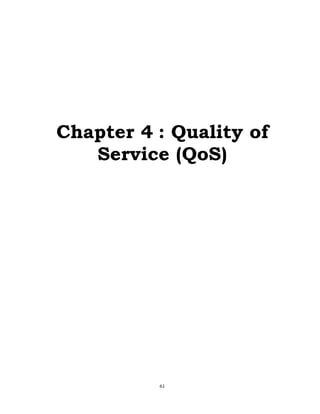
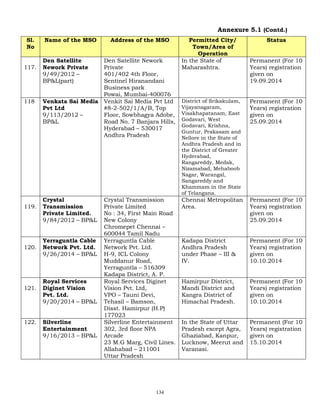
Section C : Wireline Service
Table 1.16 : Service Providers providing Wireline Service
[As on 30th June, 2015]
Sl. No. Name of the Service
Provider
Area of Operation
1 BSNL All India except Delhi & Mumbai
2 MTNL Delhi & Mumbai
3 Bharti Airtel Ltd
Andhra Pradesh (including Telangana), Delhi,
Gujarat, Haryana, Himachal Pradesh,
Madhya Pradesh (including Chhatisgarh),
Maharashtra, Mumbai, Punjab, Tamil Nadu
(including Chennai), Karnataka, Kerala,
Kolkata, Rajasthan, UP(East) and UP(West)
4
Tata Teleservices Ltd. &
Tata Teleservices (Mah)
Ltd.
All India except N.E., Assam and J&K
5
Quadrant Televentures
Ltd. (HFCL)
Punjab
6
Sistema Shyam Telelink
Ltd.
Rajasthan
7
Reliance
Communications Ltd.
All India except Assam & North-East
8 Vodafone All India except J&K
1.26 Total Wireline subscriber base declined from 26.59 million at the
end of Mar-15 to 26.15 million at the end of Jun-15 with quarterly
declining rate of 1.66%. Overall Wireline Teledensity is 2.08 at the
end of this quarter as against 2.12 of the previous quarter.
1.27 Rural subscriber base has shown decline of 4.39%, from 5.12
Million at the end of Mar-15 to 4.90 Million at the end of Jun-15.
During the same period, Urban subscription also recorded decline of
1.01%, from 21.47 million to 21.25 million.](https://image.slidesharecdn.com/performanceindicatorreportjun2015-160105144718/85/Performance-indicator-report_jun_2015-35-320.jpg)


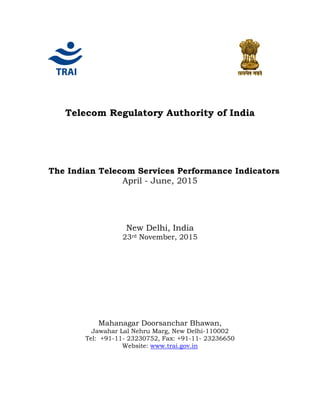
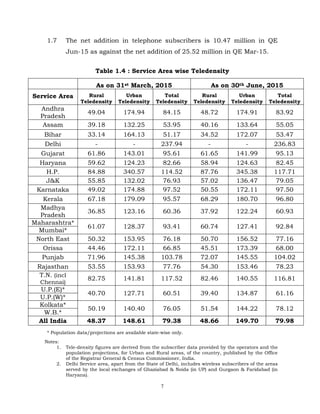
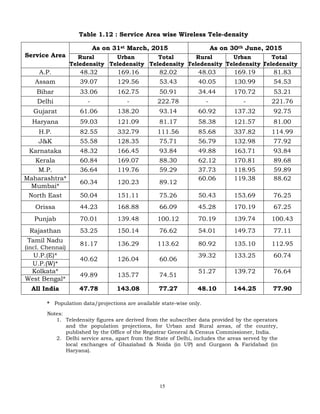
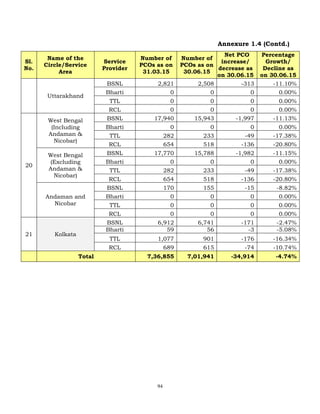
![29
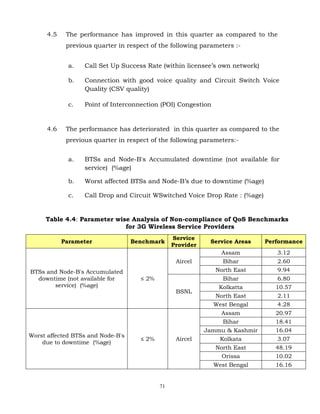
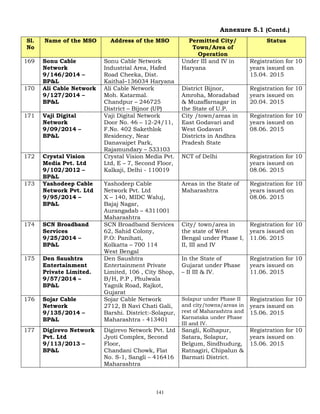
Chart 1.14 : Composition of Broadband & Narrowband subscription
1.40 The urban/rural break up of internet subscribers are as per the
following table.
Table 1.25: Break up of Rural-Urban internet subscriber base
[Subscribers in Millions]
Telecom Service
Area
Narrowband Broadband
Total Internet
(Jun-15)
Total Internet
(Mar-15)
Rural Urban Rural Urban Rural Urban Rural Urban
Andhra Pradesh 6.43 8.61 2.44 5.92 8.87 14.53 8.15 13.97
Assam 2.97 1.68 0.51 0.73 3.48 2.41 3.25 2.23
Bihar 7.43 7.23 1.21 2.17 8.64 9.40 7.94 8.64
Delhi 0.61 8.72 0.44 9.62 1.05 18.34 1.01 17.48
Gujarat 4.89 7.82 1.48 6.09 6.37 13.91 6.46 12.99
Haryana 2.53 2.44 0.60 1.83 3.13 4.27 3.16 3.98
Himachal Pradesh 1.19 0.65 0.55 0.33 1.74 0.98 1.64 0.94
Jammu & Kashmir 1.34 1.03 0.47 0.68 1.81 1.72 1.79 1.55
Karnataka 4.06 7.83 1.56 7.53 5.62 15.36 5.32 14.74
Kerala 3.56 3.43 2.60 3.92 6.17 7.35 5.93 7.03
Kolkata 0.29 4.97 0.23 2.97 0.52 7.94 0.44 7.59
Madhya Pradesh 5.90 6.81 0.50 4.95 6.40 11.76 5.71 10.87](https://image.slidesharecdn.com/performanceindicatorreportjun2015-160105144718/85/Performance-indicator-report_jun_2015-45-320.jpg)


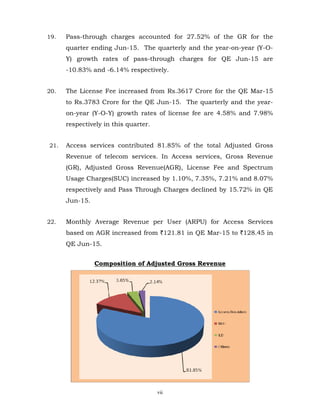
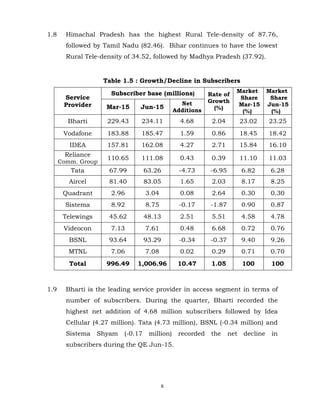
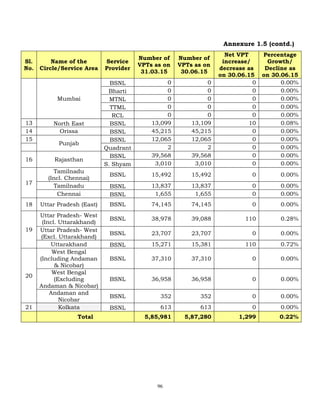
![56
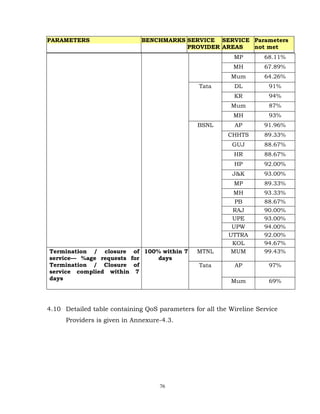
Table 2.15: Average subscriber outgo per outgoing minute from HSA -
CDMA Full Mobility Service
[```` Per min]
Circle Category Postpaid Prepaid Blended
Circle A 0.91 0.37 0.52
Circle B 0.55 0.26 0.30
Circle C 0.45 0.24 0.27
Metros 1.06 0.38 0.55
All India 0.82 0.31 0.42
Average Subscriber Outgo per Outgoing Minute for usage from HSA =
Rental revenue + revenue from outgoing calls from HSA
No. of outgoing minutes from HSA
Table 2.16: Trends of Key Parameters - CDMA Full Mobility
Service
Parameter Jun-14 Sep-14 Dec-14 Mar-15 Jun-15
1. ARPU (```` Per month) 112 110 109 108 107
2. MOU per subscriber per
month
283 267 262 265 263
3. Average revenue from data
usage per subscriber per
month (in ````)
42.46 44.21 45.11 45.80 48.93
4. No. of Outgoing SMS per
subscriber per month
16.73 16.19 16.42 10.70 9.49
5. Average subscriber Outgo per
outgoing minute from HSA (````)
0.48 0.47 0.47 0.45 0.42
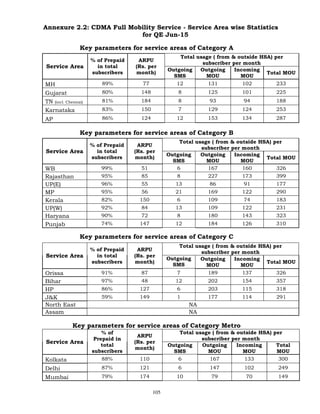
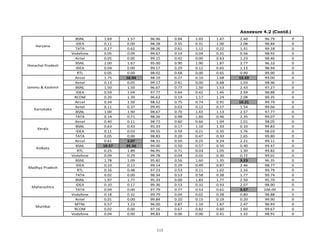
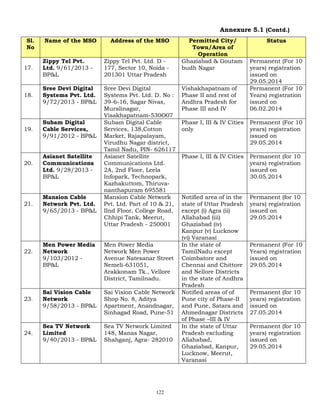
2.29 Service Area wise statistics are available at Annexure-2.2.](https://image.slidesharecdn.com/performanceindicatorreportjun2015-160105144718/85/Performance-indicator-report_jun_2015-72-320.jpg)


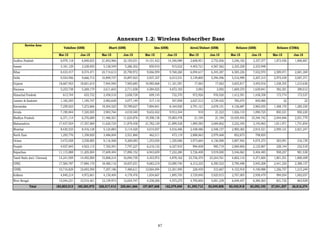


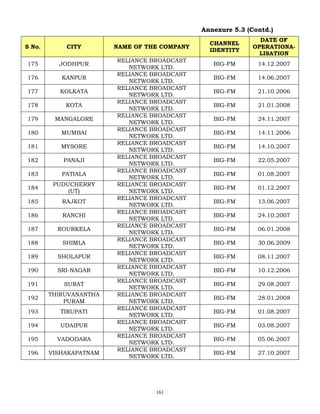
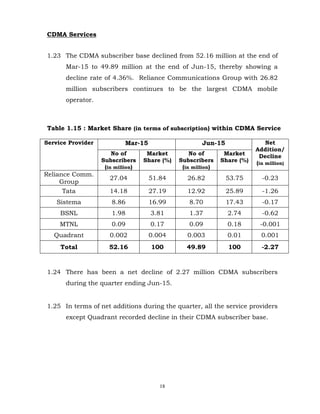
![159
Annexure 5.3 (Contd.)
S No. CITY NAME OF THE COMPANY
CHANNEL
IDENTITY
DATE OF
OPERATIONA-
LISATION
127 VADODARA MUSIC BROADCAST PVT. LTD. RADIO-CITY 11.06.2007
128 VISHAKAPATNAM MUSIC BROADCAST PVT. LTD. RADIO-CITY 29.10.2007
129 CHENNAI MUTHOOT FINANCE CHENNAI LIVE 04.01.2008
130 JAMSHEDPUR NEUTRAL PUBLICATION DHOOM FM 18.07.2008
131 RANCHI NEUTRAL PUBLICATION DHOOM FM 18.07.2008
132 CHENNAI NOBLE BROADCASTING AAHAA-FM 18.01.2007
133 GANGTOK
PCM CEMENT CONCRETE PVT.
LTD.
MISTY FM 31.01.2009
134 SILIGURI
PCM CEMENT CONCRETE PVT.
LTD.
MISTY FM 14.11.2007
135 AGARTALA POSITIVE RADIO OOLALA FM 07.08.2007
136 ITANAGAR POSITIVE RADIO OOLALA FM 05.08.2008
137 KOLHAPUR PUDHARI PUBLICATION TOMOTO FM 21.09.2007
138 SANGLI PUDHARI PUBLICATION TOMOTO FM 21.09.2009
139 GUWAHATI PURVY BROADCASTING GUP-SHUP 09.10.2007
140 AHMEDABAD RADIO MID-DAY RADIO-ONE [1] 26.08.2007
141 BENGALURU RADIO MID-DAY RADIO-ONE [1] 01.08.2006
142 CHENNAI RADIO MID-DAY RADIO-ONE [1] 10.01.2007
143 DELHI RADIO MID-DAY RADIO-ONE [1] 23.09.2006
144 KOLKATA RADIO MID-DAY RADIO-ONE [1] 12.12.2008
145 MUMBAI RADIO MID-DAY RADIO-ONE [1]
29.04.2003
(01.04.2005*)
146 PUNE RADIO MID-DAY RADIO-ONE [1] 12.05.2008
147 JAIPUR RAJASTHAN PATRIKA RADIO-TADKA 15.08.2006
148 KOTA RAJASTHAN PATRIKA RADIO-TADKA 25.02.2008
149 RAIPUR RAJASTHAN PATRIKA RADIO-TADKA 10.02.2009
150 UDAIPUR RAJASTHAN PATRIKA RADIO-TADKA 27.08.2007
151 RAIPUR RANEKA FINCOM RANGILA104.8 01.02.2008
152 AGRA
RELIANCE BROADCAST
NETWORK LTD.
BIG-FM 18.08.2007](https://image.slidesharecdn.com/performanceindicatorreportjun2015-160105144718/85/Performance-indicator-report_jun_2015-175-320.jpg)