Download to read offline


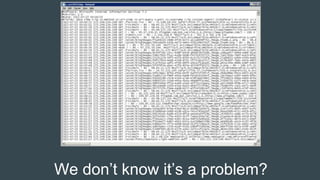
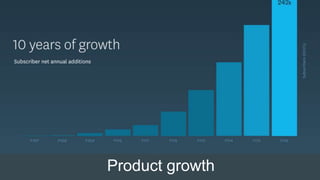

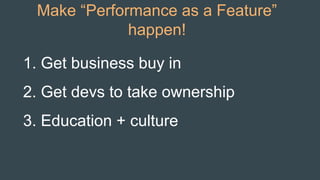


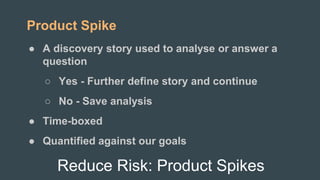


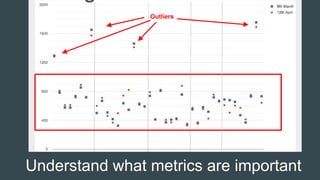
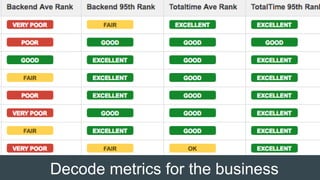
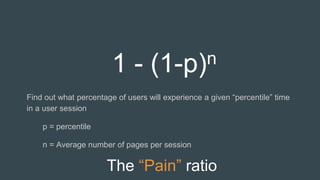
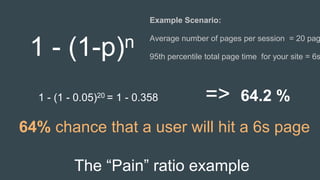

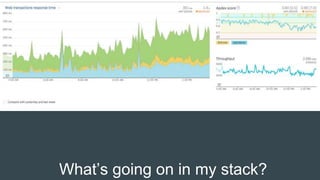


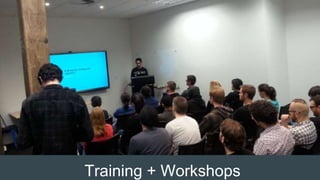
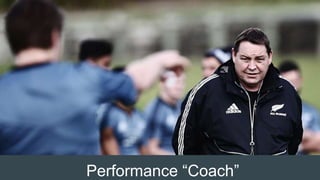
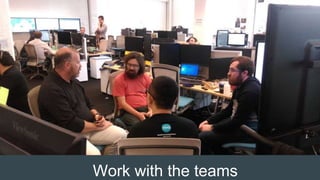


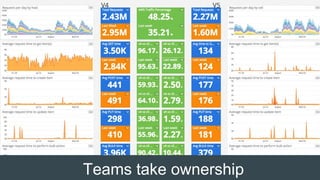
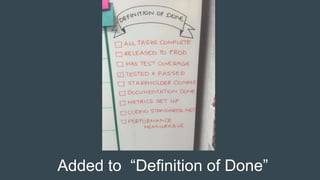


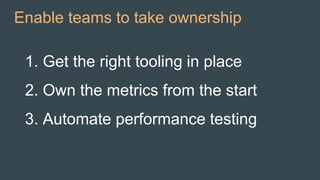
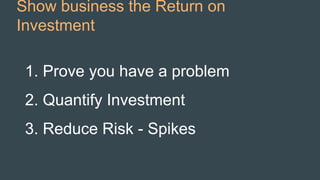
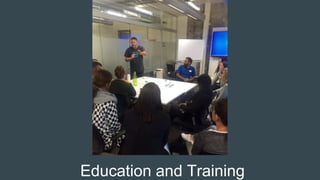
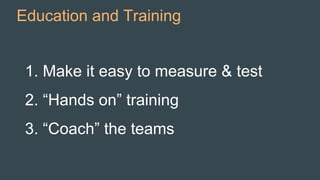


John Clegg gave a talk at ScaleConf about making performance a feature. He discussed how the Impossible Mission Force team at Xero focuses on performance as part of their development process. Clegg explained that focusing on performance leads to better customer satisfaction, conversion rates, and costs. However, premature optimization can be evil. The key is optimizing critical parts of the system as products and customers grow over time. Clegg provided tips on getting business buy-in, having developers take ownership of performance, using education and culture change, and metrics to make performance a feature.


![LITE 2017 – How to Boost Business with Virtual Training Labs [Lee Berkman]](https://cdn.slidesharecdn.com/ss_thumbnails/talk8-day1-howtoboostbusinesswithvirtualtraininglabs-171113102406-thumbnail.jpg?width=640&height=640&fit=bounds)


![Getting Started with Apache Spark: Big Data Made Simple [Free Meetup]](https://cdn.slidesharecdn.com/ss_thumbnails/apachesparkgettingstarted-260203175547-8361bcc3-thumbnail.jpg?width=640&height=640&fit=bounds)


