SlideShare a Scribd company logo
PEO ADVISOR
                                                                      RISK MANAGEMENT


                                                                                      © Praxiom Risk Management                         August 2011


Features
The Importance of Transparency in Medical Bill Review
- Jason Beans, CEO, Rising Medical Solutions
Medical bill review can be a powerful tool in the claims management arsenal, if used properly. The savings achieved through a well
run program directly impacts the bottom line, reducing claims costs and increasing surplus. The process is much more technical
and complex than most people realize and, due to that, I see up to a 20% difference in overall program savings in many states. That
difference makes a huge impact on whether your program is performing or underperforming.
Data analytics can also dramatically impact your results, and this should be part of any good bill review program. Nowhere else can
such a wide array of data be produced that allows for comprehensive claims analysis and alerts. The capabilities of data analytics
are infinite and underutilized. Companies need to start doing a better job of flagging claims that need intervention, setting reserves
with predictive models, recognizing fraud and identifying the best treatment patterns.
The problem is that the optimal performance of a bill review program requires one critical component: “transparency.” However,
instant access to clear data is too often the exception, not the rule.
One area that frequently lacks transparency is the reporting of results. I often see data broken into micro-bites that hide or mislead
the client about their program’s overall results. The most important number to judge your bill review program by is not ROI, or
PPO penetration, or even the bill review program fee – it is the net savings (total savings less the bill review fees).
Let me give two scenarios: Would you rather have a $20 to $1 ROI or a $6.67 to $1 ROI? Sounds like a simple question, but the out-
comes are actually not what you’d expect.
In scenario A: Imagine a bill with $1,000 in charges, $200 in fee schedule discounts and a $10 bill processing fee (20 to 1 ROI). The
resulting bill cost is $810, with a net savings of 19%.
In scenario B: You get an additional $200 discount over fee schedule (e.g. PPO, nego-
tiations) at a 25% of savings rate, bringing the total savings to $400 for $60 in fees
($6.67 to $1 ROI). The resulting bill cost is $660, with a net savings of 34% – demon-
strating why it’s net savings that is really the key metric to give you the best indica-
tion of program performance. Continue Reading...


Avoiding Heat Illnesses
- John Conrad
Whether you are a worker or weekend warrior, hot and humid conditions can cause
heat illnesses. Each year, workers, home owners and athletes experience heat re-
lated illnesses that in some cases result in deaths. Confirmed heat related death sta-
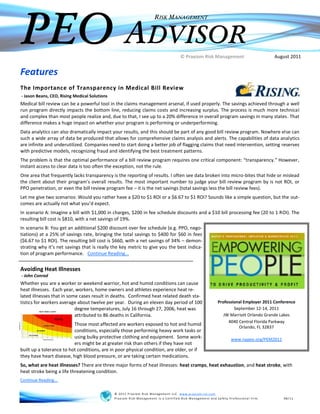
tistics for workers average about twelve per year. During an eleven day period of 100                       Professional Employer 2011 Conference
                           degree temperatures, July 16 through 27, 2006, heat was                                  September 12-14, 2011
                           attributed to 86 deaths in California.                                              JW Marriott Orlando Grande Lakes
                                                                                                                 4040 Central Florida Parkway
                          Those most affected are workers exposed to hot and humid
                                                                                                                      Orlando, FL 32837
                          conditions, especially those performing heavy work tasks or
                          using bulky protective clothing and equipment. Some work-                                 www.napeo.org/PEM2011
                          ers might be at greater risk than others if they have not
built up a tolerance to hot conditions, are in poor physical condition, are older, or if
they have heart disease, high blood pressure, or are taking certain medications.
So, what are heat illnesses? There are three major forms of heat illnesses: heat cramps, heat exhaustion, and heat stroke, with
heat stroke being a life threatening condition.
Continue Reading...

                                               © 2011 P rax iom Risk Management LLC www.prax iom-rm. com
                                               Prax iom Risk Management is a Certified Risk Management and Safety P rofessional firm.       08/11
PEO
                                                RISK MANAGEMENT

                                           ADVISOR   © Praxiom Risk Management


Free Webinar Schedule

The Certification Institute’s PEO WC Risk Management Webinar Series
www.certificationinstitute.org


The Certification Institute’s free webinar series returns in August with another full schedule. Participa-
tion in June and July was very high, with over 300 individuals representing 75+ PEOs. The webinars are
short, 1-hour courses that cover important tactical topics for PEO operators. The webinars also provide
access to resource material and industry operational statistics that won’t be found elsewhere.
While sponsored by the CI, the webinars are being hosted by Certified Risk Managers from the PEO
consulting firm of Praxiom Risk management.
                   New Webinar in August:
                   Underwriting Profitable PEO Clients
                   Tuesday, August 9th and 23rd: 2:00 to 3:00 (ET)
                   http://peounderwriting.eventbrite.com

                        At the conclusion of the webinar you will have an understanding of:
                         Obtaining the right underwriting data
                         Hazard Groupings and client classifications
                         When to pre-inspect
                         Loss Ratio and EMR impact on renewal pricing
                         Retention and Rate Level objectives

                   Returning Webinars
                   Workers Compensation Experience Mod for PEOs – Understanding the EMR Worksheet
                   Thursday, August 4th and 18th: 2:00 PM to 3:00 PM (ET)
                        The key components of the NCCI experience mod and calculation
                        Interpretation of codes and abbreviations
                        Recommendations for influencing a reduction in the EMR

                   Workers Compensation Experience Mod for PEOs – True Cost of Client Claims
                   Thursday, August 11th and 25th: 2:00 PM to 3:00 PM (ET)
                        Minimum and controllable EMR
                        Premium associated with controllable EMR
                        The ‘true” cost of a claim
                        A single client’s impact on EMR and premium

                   Measuring PEO WC Performance
                   Tuesday, August 16th and 30th: 2:00 to 3:00 (ET)
                        Requirements for data analysis
                        Ideal Risk Management Information System (RMIS) capabilities
                        Key WC metrics to monitor and timing
                        Best client level reports
                        Best PEO level reports

                   To view all the current webinars and register, follow the link below:
                   www.peoriskmanagement.eventbrite.com


                                              © 2011 P rax iom Risk Management LLC www.prax iom-rm. com
                                              Prax iom Risk Management is a Certified Risk Management and Safety P rofessional firm.   08/11
PEO
                                                       RISK MANAGEMENT

                                                  ADVISOR   © Praxiom Risk Management


Measuring PEO Performance                                                                                           Evaluate your PEO’s practices vs CI
This section is dedicated to those PEOs that manage their Workers                                                   certification guidelines...
Compensation program through a Large Deductible or captive ar-
                                                                                   As we review the CI’s best practices for PEO risk management in each
rangement, and utilize positive results as a profit center.
                                                                                   of their 5 categories, evaluate how your PEO stacks up by answering
Premium                                                                            these questions:
There are many definitions of WC premium that can be confusing
and are often times mixed up erroneously. Here is a good list of                   Risk Control Assessment
the most common premium definitions.
Manual Premium = (payroll/$100)/ manual rates                                      Compliance with Risk Control Requirements—Have you established
                                                                                   written procedures for requiring the Client to comply with “critical”
Subject Premium = manual premium * increased limit charge (this                    recommendations? Do your procedures should include:
is also the premium that is “subject to” the EMR
                                                                                         Communication requirements to the client
Standard Premium = Subject premium * EMR (also called Modified                           Target dates for compliance
Premium)                                                                                 Taking appropriate action if Client fails to comply
Deductible Premium = Standard premium * deductible factor                                Documenting the action(s) taken

Discounted Premium = Standard premium * discount factor                            New Client Needs Assessment— Has the PEO established written
                                                                                   procedures for conducting a “needs assessment” of each new client?
Estimated Premium = Discounted premium + Taxes + assessments
                                                                                   Do you produce a service plan that is consistent with the needs as-
Final Premium = Premium determined after audit                                     sessment? Do the Needs Assessment and Service Plan consider Cli-
Other forms of Premium used in Retrospective Plans include:                        ent requests for specific services and requirements included in the
                                                                                   CSA? Do the procedures include how the Service Plan will be docu-
Basic Premium = Standard premium * Basic factor (this is the por-                  mented and used?
tion of the retro plan that covers admin costs, overhead, profit, and
insurance charges)                                                                 Providing Appropriate Risk Control Services— Has the PEO estab-
                                                                                   lished written procedures for delivering Risk Control services to Cli-
Minimum Premium = Standard premium * minimum factor (this                          ents consistent with Service Plans?
represents the least amount you potentially pay on a retro plan)
                                                                                   Accident Investigation— Have you established poli-
Maximum Premium = Standard premium * maximum factor (this                          cies requiring investigation of employee accidents
represents the most you potentially pay on a retro plan)                           when they result in a work related injury and subse-
                                                                                   quently reported as a claim? Do the policies describe
                                                                                   which accidents will be investigated (med only, lost
Workers Compensation Highlights                                                    time, specific injuries, etc)? Have you identified what
                                                                                   method will be used for investigation (telephone vs on-site) and the
The WC Benchmarking Analysis                                                       format of documenting the investigation results?
By John Keller, CRM ARM CIC AAI
                                                                                   Certificate Tracking Confirmation - Do you have a tracking process in
A Benchmarking Analysis is one of the most beneficial tools for                    place for clients with material contingent workers’ compensation
evaluating operational efficiencies, yet it is significantly underuti-             exposure?
lized.
                                                                                   Background Investigations—Has the PEO required as part of the
When a Benchmarking Analysis is completed for a company’s                          service plan and CSA that the clients cooperate with the PEO in con-
Workers’ Compensation program, there are three primary areas of                    ducting pre-employment and/or post-employment background inves-
focus: Accident, Post-Injury Cost Management, and Organizational                   tigations? Is an MVR review, where applicable, a part of the back-
Procedures. Each of these three components can have numerous                       ground investigations?
ratios and statistics that can be used for comparison. Which ratios
                                                                                   Claims Review— Does the PEO review and document, at least
are used typically depends on the industry and the type of work
                                                                                   monthly, the claims experience and resulting recommendations for
being performed. Below is an outline of the most common statis-
                                                                                   clients with claims frequency or severity issues? Do you use the re-
tics used in each component of a Benchmark Analysis with a brief
                                                                                   sults of these reviews to implement client-specific corrective actions
description.
                                                                                   such as placement on the watch-list, providing risk control services,
The Accident Component                                                             and/or terminating the client?
Frequency Rate – is a measure of the number of claims (anything
>$0 paid) divided by a predetermined measure. Insurance compa-
nies most commonly express this as… Continue Reading
                                                                                                  For more on CI requirements visit: www.certificationinstitute.org


                                                     © 2011 P rax iom Risk Management LLC www.prax iom-rm. com
                                                     Prax iom Risk Management is a Certified Risk Management and Safety P rofessional firm.                 08/11
PEO
                                                             RISK MANAGEMENT

                                                       ADVISOR   © Praxiom Risk Management


Benchmarking
The Benchmarking section is used to outline various industries in terms of their Workers Compensation risk factors, historical
claims statistics, and key loss sources. Benchmarking statistics are obtained from a variety of credible sources including the largest
WC insurance companies in the U.S. and The Bureau of Labor and Statistics. The statistics used are aggregated from all states and
averaged over a 5 year rolling period. All stats below are from claims incurred between 1/1/06—12/31/10.


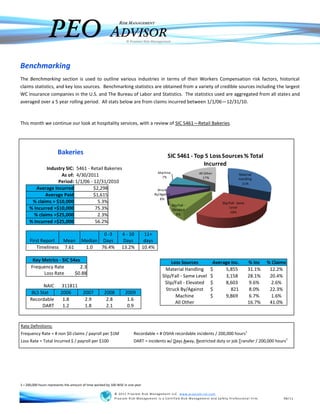
This month we continue our look at hospitality services, with a review of SIC 5461—Retail Bakeries.


                       Bakeries                                                            SIC 5461 - Top 5 Loss Sources % Total
                                                                                                         Incurred
             Industry SIC: 5461 - Retail Bakeries
                                                                                      Machine                 All Other
                    As of: 4/30/2011                                                    7%                       17%
                                                                                                                                     Material
                                                                                                                                     Handling
                  Period: 1/1/06 - 12/31/2010                                                                                          31%
        Average Incurred           $2,298                                           Struck
            Average Paid           $1,615                                         By/Against
                                                                                      8%
      % claims > $10,000             5.3%                                                                                 Slip/Fall - Same
                                                                                                Slip/Fall -
     % Incurred >$10,000            75.3%                                                       Elevated
                                                                                                                               Level
                                                                                                                                28%
       % claims >$25,000             2.3%                                                           9%

     % Incurred >$25,000            56.2%

                                             0 -3             4 - 10           11+
     First Report   Mean             Median Days               Days            days
         Timeliness 7.61              1.0   76.4%             13.2%           10.4%

       Key Metrics - SIC 54xx                                                                Loss Sources             Average Inc.           % Inc   % Claims
      Frequency Rate          2.3                                                         Material Handling          $     5,855             31.1%    12.2%
            Loss Rate      $0.88
                                                                                        Slip/Fall - Same Level       $     3,158             28.1%    20.4%
                                                                                         Slip/Fall - Elevated        $     8,603             9.6%      2.6%
             NAIC       311811
                                                                                          Struck By/Against          $        821            8.0%     22.3%
       BLS Stat         2006          2007          2008         2009
                                                                                               Machine               $     9,869             6.7%      1.6%
      Recordable         1.8           2.9           2.8          1.6
                                                                                               All Other                                     16.7%    41.0%
            DART         1.2           1.8           2.1          0.9


Rate Definitions:
Frequency Rate = # non $0 claims / payroll per $1M                    Recordable = # OSHA recordable incidents / 200,000 hours1
Loss Rate = Total Incurred $ / payroll per $100                       DART = incidents w/ Days Away, Restricted duty or job Transfer / 200,000 hours1


1—200,000 hours represents the amount of time worked by 100 WSE in one year

                                                          © 2011 P rax iom Risk Management LLC www.prax iom-rm. com
                                                          Prax iom Risk Management is a Certified Risk Management and Safety P rofessional firm.            08/11
PEO
                                                             RISK MANAGEMENT

                                                       ADVISOR   © Praxiom Risk Management


Benchmarking
The Benchmarking section is used to outline various industries in terms of their Workers Compensation risk factors, historical
claims statistics, and key loss sources. Benchmarking statistics are obtained from a variety of credible sources including the largest
WC insurance companies in the U.S. and The Bureau of Labor and Statistics. The statistics used are aggregated from all states and
averaged over a 5 year rolling period. All stats below are from claims incurred between 1/1/06—12/31/10.


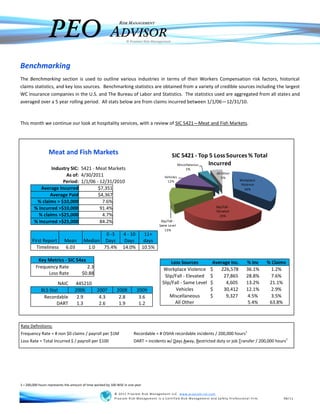
This month we continue our look at hospitality services, with a review of SIC 5421—Meat and Fish Markets.


                 Meat and Fish Markets                                                         SIC 5421 - Top 5 Loss Sources % Total
                                                                                                 Miscellaneous Incurred
                Industry SIC: 5421 - Meat Markets                                                    5%
                                                                                                                       All Other
                       As of: 4/30/2011                                                  Vehicles                          5%
                     Period: 1/1/06 - 12/31/2010                                           12%                                      Workplace
                                                                                                                                     Violence
           Average Incurred           $7,351                                                                                           36%
               Average Paid           $4,367
         % claims > $10,000             7.6%
        % Incurred >$10,000            91.4%                                                                          Slip/Fall -
                                                                                                                      Elevated
          % claims >$25,000             4.7%                                                                             29%
        % Incurred >$25,000            84.2%                                           Slip/Fall -
                                                                                      Same Level
                                                                                          13%
                                               0 -3            4 - 10          11+
       First Report        Mean        Median Days              Days           days
         Timeliness        6.03         1.0   75.4%            14.0%          10.5%

          Key Metrics - SIC 54xx                                                             Loss Sources           Average Inc.        % Inc      % Claims
         Frequency Rate          2.3                                                    Workplace Violence         $   226,578          36.1%        1.2%
              Loss Rate       $0.88
                                                                                         Slip/Fall - Elevated      $     27,865         28.8%        7.6%
                    NAIC         445210                                                 Slip/Fall - Same Level     $      4,605         13.2%       21.1%
            BLS Stat             2006   2007               2008         2009                   Vehicles            $     30,412         12.1%        2.9%
             Recordable           2.9    4.3                2.8          3.6                Miscellaneous          $      9,327         4.5%         3.5%
                   DART           1.3    2.6                1.9          1.2                   All Other                                5.4%        63.8%


Rate Definitions:
Frequency Rate = # non $0 claims / payroll per $1M                    Recordable = # OSHA recordable incidents / 200,000 hours1
Loss Rate = Total Incurred $ / payroll per $100                       DART = incidents w/ Days Away, Restricted duty or job Transfer / 200,000 hours1


1—200,000 hours represents the amount of time worked by 100 WSE in one year

                                                          © 2011 P rax iom Risk Management LLC www.prax iom-rm. com
                                                          Prax iom Risk Management is a Certified Risk Management and Safety P rofessional firm.          08/11
PEO
                                   RISK MANAGEMENT

                              ADVISOR  © Praxiom Risk Management


                                Stay Connected...
   If you haven’t already joined, there is now a group on LinkedIn dedicated to PEO
   Risk Management. All PEO operators and Risk Managers are encouraged to join
   and participate in the online discussions. Or, you can simply follow the news posts that relate to PEO,
   Risk Management, and Workers Compensation.

                      Click here to go to the PEO Risk Management group on LinkedIn and join.


With PEO Risk Management professionals averaging 20 years of experience and encompassing a
broad range of industry expertise, Praxiom Risk Management is committed to providing a wide
range of resources to help PEOs mitigate risk and grow their Workers Compensation profit center.


This PEO RM Advisor is a monthly e-newsletter designed to keep PEO executives and Risk Manage-
ment professionals informed of relevant topics in the area of PEO risk management. Sharing infor-
mation and best practice through e-newsletters is one of the many ways we help support PEO or-
ganizations' risk management efforts.


If you would like to contribute industry specific content or articles for publication in the areas be-
low, you may submit them to the Editor at:
                                     RiskAdvisor@praxiom-rm.com.


                                                  Loss Control
                                             Claims Management
                                            Performance Metrics
                                          RM Information Systems
                                            Policy Administration
                                             Carrier Relationships
                                            Industry Certifications


                    Up Next…
                    We’ll continue benchmarking the hospitality industry with an in
                    depth look into the WC results of:

                                        5511—New/Used Car Dealers

                                         5571—Motorcycle Dealers


                                © 2011 P rax iom Risk Management LLC www.prax iom-rm. com
                                Prax iom Risk Management is a Certified Risk Management and Safety P rofessional firm.   08/11

More Related Content

What's hot

ROI on EHS Risk Reduction
ROI on EHS Risk ReductionROI on EHS Risk Reduction
ROI on EHS Risk Reduction
lheim
 
Risk Treatment Standard-ASB
Risk Treatment Standard-ASBRisk Treatment Standard-ASB
Risk Treatment Standard-ASB
Michel Rochette
 
2007 CPM West Keynote Presentation
2007 CPM West Keynote Presentation2007 CPM West Keynote Presentation
2007 CPM West Keynote Presentation
sirjem
 
Active Risk Manager 2 page brochure
Active Risk Manager 2 page brochureActive Risk Manager 2 page brochure
Active Risk Manager 2 page brochure
SteveSchultz
 
MITIGATING OPERATIONAL RISK: RISK TRANSFER SOLUTIONS
MITIGATING OPERATIONAL RISK: RISK TRANSFER SOLUTIONSMITIGATING OPERATIONAL RISK: RISK TRANSFER SOLUTIONS
MITIGATING OPERATIONAL RISK: RISK TRANSFER SOLUTIONS
Michel Rochette
 
P&C Claims Automation Solution - A Competitive Advantage
P&C Claims Automation Solution - A Competitive AdvantageP&C Claims Automation Solution - A Competitive Advantage
P&C Claims Automation Solution - A Competitive Advantage
Paragon Solutions
 
Advanced Risk Management - Elsam Management Consultants
Advanced Risk Management - Elsam Management ConsultantsAdvanced Risk Management - Elsam Management Consultants
Advanced Risk Management - Elsam Management Consultants
EMAC Consulting Group
 
ERM Presentation
ERM PresentationERM Presentation
ERM Presentation
H Contrex
 
Convergence of Security Risks
Convergence of Security RisksConvergence of Security Risks
Convergence of Security Risks
Enterprise Security Risk Management
 
Discover 100 Job Descriptions in Risk and Compliance Management and what it t...
Discover 100 Job Descriptions in Risk and Compliance Management and what it t...Discover 100 Job Descriptions in Risk and Compliance Management and what it t...
Discover 100 Job Descriptions in Risk and Compliance Management and what it t...
Compliance LLC
 
Risk Analysis In Business Continuity Management - Jeremy Wong
Risk Analysis In Business Continuity Management - Jeremy WongRisk Analysis In Business Continuity Management - Jeremy Wong
Risk Analysis In Business Continuity Management - Jeremy WongBCM Institute
 

What's hot (18)

PEO RM Advisor 3/2011
PEO RM Advisor 3/2011PEO RM Advisor 3/2011
PEO RM Advisor 3/2011
 
ROI on EHS Risk Reduction
ROI on EHS Risk ReductionROI on EHS Risk Reduction
ROI on EHS Risk Reduction
 
Risk Treatment Standard-ASB
Risk Treatment Standard-ASBRisk Treatment Standard-ASB
Risk Treatment Standard-ASB
 
2007 CPM West Keynote Presentation
2007 CPM West Keynote Presentation2007 CPM West Keynote Presentation
2007 CPM West Keynote Presentation
 
Active Risk Manager 2 page brochure
Active Risk Manager 2 page brochureActive Risk Manager 2 page brochure
Active Risk Manager 2 page brochure
 
MITIGATING OPERATIONAL RISK: RISK TRANSFER SOLUTIONS
MITIGATING OPERATIONAL RISK: RISK TRANSFER SOLUTIONSMITIGATING OPERATIONAL RISK: RISK TRANSFER SOLUTIONS
MITIGATING OPERATIONAL RISK: RISK TRANSFER SOLUTIONS
 
P&C Claims Automation Solution - A Competitive Advantage
P&C Claims Automation Solution - A Competitive AdvantageP&C Claims Automation Solution - A Competitive Advantage
P&C Claims Automation Solution - A Competitive Advantage
 
Advanced Risk Management - Elsam Management Consultants
Advanced Risk Management - Elsam Management ConsultantsAdvanced Risk Management - Elsam Management Consultants
Advanced Risk Management - Elsam Management Consultants
 
ERM Presentation
ERM PresentationERM Presentation
ERM Presentation
 
People Risk Collateral
People Risk CollateralPeople Risk Collateral
People Risk Collateral
 
People Risk Collateral
People Risk CollateralPeople Risk Collateral
People Risk Collateral
 
Analisis de Riesgos O-ISM3
Analisis de Riesgos O-ISM3Analisis de Riesgos O-ISM3
Analisis de Riesgos O-ISM3
 
Riskpro security audit
Riskpro security auditRiskpro security audit
Riskpro security audit
 
Control Risks-ERM-whitepaper
Control Risks-ERM-whitepaperControl Risks-ERM-whitepaper
Control Risks-ERM-whitepaper
 
Convergence of Security Risks
Convergence of Security RisksConvergence of Security Risks
Convergence of Security Risks
 
Riskpro Brief Introduction
Riskpro Brief IntroductionRiskpro Brief Introduction
Riskpro Brief Introduction
 
Discover 100 Job Descriptions in Risk and Compliance Management and what it t...
Discover 100 Job Descriptions in Risk and Compliance Management and what it t...Discover 100 Job Descriptions in Risk and Compliance Management and what it t...
Discover 100 Job Descriptions in Risk and Compliance Management and what it t...
 
Risk Analysis In Business Continuity Management - Jeremy Wong
Risk Analysis In Business Continuity Management - Jeremy WongRisk Analysis In Business Continuity Management - Jeremy Wong
Risk Analysis In Business Continuity Management - Jeremy Wong
 

Similar to PEO Risk Management Advisor - August 2011

Enterprise Risk Management
Enterprise Risk ManagementEnterprise Risk Management
Enterprise Risk ManagementAnu Damodaran
 
Risk Management Presentation Powerpoint 2008
Risk Management Presentation Powerpoint 2008Risk Management Presentation Powerpoint 2008
Risk Management Presentation Powerpoint 2008
Praxiom
 
Enterprise risk management
Enterprise risk managementEnterprise risk management
Enterprise risk managementAnu Damodaran
 
Fit For EMR White Paper
Fit For EMR White PaperFit For EMR White Paper
Fit For EMR White Paper
jjorgensenus
 
Risk Management Diagnostic Ashes2009
Risk Management Diagnostic   Ashes2009Risk Management Diagnostic   Ashes2009
Risk Management Diagnostic Ashes2009Roger Paveza
 
Ilta09 Law Firm Risk Management D Cunningham
Ilta09 Law Firm Risk Management  D CunninghamIlta09 Law Firm Risk Management  D Cunningham
Ilta09 Law Firm Risk Management D Cunningham
Baker Robbins & Company
 
CIA Quebec 11 Sept 2015 Presentation C Louis Final
CIA Quebec 11 Sept 2015 Presentation C Louis FinalCIA Quebec 11 Sept 2015 Presentation C Louis Final
CIA Quebec 11 Sept 2015 Presentation C Louis FinalClaire Louis
 
Return-On-Investment Humanscale India
Return-On-Investment Humanscale IndiaReturn-On-Investment Humanscale India
Return-On-Investment Humanscale India
rumpasahaa
 
Applying risk management_to_your_business_continuity_management_efforts
Applying risk management_to_your_business_continuity_management_effortsApplying risk management_to_your_business_continuity_management_efforts
Applying risk management_to_your_business_continuity_management_effortsSubhajit Bhuiya
 
pihms Overview Presentation
pihms Overview Presentationpihms Overview Presentation
pihms Overview Presentation
Andrew Mackler
 
MRM: PwC Top Issues
MRM:  PwC Top Issues  MRM:  PwC Top Issues
MRM: PwC Top Issues
PwC
 
HP ArcSight Demonstrating ROI For a SIEM Solution
HP ArcSight Demonstrating ROI For a SIEM SolutionHP ArcSight Demonstrating ROI For a SIEM Solution
HP ArcSight Demonstrating ROI For a SIEM Solution
rickkaun
 
Risk Mgmt - Define_And_Articulate
Risk Mgmt - Define_And_ArticulateRisk Mgmt - Define_And_Articulate
Risk Mgmt - Define_And_ArticulateAnthony Chiusano
 
Life Sciences Insurance
Life Sciences InsuranceLife Sciences Insurance
Life Sciences Insurancemwrobert007
 
Veta compliance operations review
Veta compliance operations reviewVeta compliance operations review
Veta compliance operations reviewMark Taylor
 
Pay Me Now or Pay Me A Lot More Later
Pay Me Now or Pay Me A Lot More LaterPay Me Now or Pay Me A Lot More Later
Pay Me Now or Pay Me A Lot More Later
RLE Technologies
 
Compliance Risk Assessment
Compliance Risk AssessmentCompliance Risk Assessment
Compliance Risk Assessment
Compliance Consultant
 

Similar to PEO Risk Management Advisor - August 2011 (20)

PEO Risk Management Advisor 5/2011
PEO Risk Management Advisor 5/2011PEO Risk Management Advisor 5/2011
PEO Risk Management Advisor 5/2011
 
Enterprise Risk Management
Enterprise Risk ManagementEnterprise Risk Management
Enterprise Risk Management
 
Risk Management Presentation Powerpoint 2008
Risk Management Presentation Powerpoint 2008Risk Management Presentation Powerpoint 2008
Risk Management Presentation Powerpoint 2008
 
Enterprise risk management
Enterprise risk managementEnterprise risk management
Enterprise risk management
 
Fit For EMR White Paper
Fit For EMR White PaperFit For EMR White Paper
Fit For EMR White Paper
 
Risk Management Diagnostic Ashes2009
Risk Management Diagnostic   Ashes2009Risk Management Diagnostic   Ashes2009
Risk Management Diagnostic Ashes2009
 
Peo advisor 11.01
Peo advisor 11.01Peo advisor 11.01
Peo advisor 11.01
 
Ilta09 Law Firm Risk Management D Cunningham
Ilta09 Law Firm Risk Management  D CunninghamIlta09 Law Firm Risk Management  D Cunningham
Ilta09 Law Firm Risk Management D Cunningham
 
CIA Quebec 11 Sept 2015 Presentation C Louis Final
CIA Quebec 11 Sept 2015 Presentation C Louis FinalCIA Quebec 11 Sept 2015 Presentation C Louis Final
CIA Quebec 11 Sept 2015 Presentation C Louis Final
 
Return-On-Investment Humanscale India
Return-On-Investment Humanscale IndiaReturn-On-Investment Humanscale India
Return-On-Investment Humanscale India
 
Applying risk management_to_your_business_continuity_management_efforts
Applying risk management_to_your_business_continuity_management_effortsApplying risk management_to_your_business_continuity_management_efforts
Applying risk management_to_your_business_continuity_management_efforts
 
pihms Overview Presentation
pihms Overview Presentationpihms Overview Presentation
pihms Overview Presentation
 
MRM: PwC Top Issues
MRM:  PwC Top Issues  MRM:  PwC Top Issues
MRM: PwC Top Issues
 
HP ArcSight Demonstrating ROI For a SIEM Solution
HP ArcSight Demonstrating ROI For a SIEM SolutionHP ArcSight Demonstrating ROI For a SIEM Solution
HP ArcSight Demonstrating ROI For a SIEM Solution
 
Using Tools for Putting a Cost on Turnover
Using Tools for Putting a Cost on TurnoverUsing Tools for Putting a Cost on Turnover
Using Tools for Putting a Cost on Turnover
 
Risk Mgmt - Define_And_Articulate
Risk Mgmt - Define_And_ArticulateRisk Mgmt - Define_And_Articulate
Risk Mgmt - Define_And_Articulate
 
Life Sciences Insurance
Life Sciences InsuranceLife Sciences Insurance
Life Sciences Insurance
 
Veta compliance operations review
Veta compliance operations reviewVeta compliance operations review
Veta compliance operations review
 
Pay Me Now or Pay Me A Lot More Later
Pay Me Now or Pay Me A Lot More LaterPay Me Now or Pay Me A Lot More Later
Pay Me Now or Pay Me A Lot More Later
 
Compliance Risk Assessment
Compliance Risk AssessmentCompliance Risk Assessment
Compliance Risk Assessment
 

Recently uploaded

Tdasx: Unveiling the Trillion-Dollar Potential of Bitcoin DeFi
Tdasx: Unveiling the Trillion-Dollar Potential of Bitcoin DeFiTdasx: Unveiling the Trillion-Dollar Potential of Bitcoin DeFi
Tdasx: Unveiling the Trillion-Dollar Potential of Bitcoin DeFi
nimaruinazawa258
 
Globalization (Nike) Presentation PPT Poster Infographic.pdf
Globalization (Nike) Presentation PPT Poster Infographic.pdfGlobalization (Nike) Presentation PPT Poster Infographic.pdf
Globalization (Nike) Presentation PPT Poster Infographic.pdf
VohnArchieEdjan
 
Instant Issue Debit Cards
Instant Issue Debit CardsInstant Issue Debit Cards
Instant Issue Debit Cards
egoetzinger
 
Turin Startup Ecosystem 2024 - Ricerca sulle Startup e il Sistema dell'Innov...
Turin Startup Ecosystem 2024  - Ricerca sulle Startup e il Sistema dell'Innov...Turin Startup Ecosystem 2024  - Ricerca sulle Startup e il Sistema dell'Innov...
Turin Startup Ecosystem 2024 - Ricerca sulle Startup e il Sistema dell'Innov...
Quotidiano Piemontese
 
Instant Issue Debit Cards - School Designs
Instant Issue Debit Cards - School DesignsInstant Issue Debit Cards - School Designs
Instant Issue Debit Cards - School Designs
egoetzinger
 
Analyzing the instability of equilibrium in thr harrod domar model
Analyzing the instability of equilibrium in thr harrod domar modelAnalyzing the instability of equilibrium in thr harrod domar model
Analyzing the instability of equilibrium in thr harrod domar model
ManthanBhardwaj4
 
Seminar: Gender Board Diversity through Ownership Networks
Seminar: Gender Board Diversity through Ownership NetworksSeminar: Gender Board Diversity through Ownership Networks
Seminar: Gender Board Diversity through Ownership Networks
GRAPE
 
一比一原版(GWU,GW毕业证)加利福尼亚大学|尔湾分校毕业证如何办理
一比一原版(GWU,GW毕业证)加利福尼亚大学|尔湾分校毕业证如何办理一比一原版(GWU,GW毕业证)加利福尼亚大学|尔湾分校毕业证如何办理
一比一原版(GWU,GW毕业证)加利福尼亚大学|尔湾分校毕业证如何办理
obyzuk
 
how to swap pi coins to foreign currency withdrawable.
how to swap pi coins to foreign currency withdrawable.how to swap pi coins to foreign currency withdrawable.
how to swap pi coins to foreign currency withdrawable.
DOT TECH
 
What price will pi network be listed on exchanges
What price will pi network be listed on exchangesWhat price will pi network be listed on exchanges
What price will pi network be listed on exchanges
DOT TECH
 
1. Elemental Economics - Introduction to mining.pdf
1. Elemental Economics - Introduction to mining.pdf1. Elemental Economics - Introduction to mining.pdf
1. Elemental Economics - Introduction to mining.pdf
Neal Brewster
 
5 Tips for Creating Standard Financial Reports
5 Tips for Creating Standard Financial Reports5 Tips for Creating Standard Financial Reports
5 Tips for Creating Standard Financial Reports
EasyReports
 
Donald Trump Presentation and his life.pptx
Donald Trump Presentation and his life.pptxDonald Trump Presentation and his life.pptx
Donald Trump Presentation and his life.pptx
SerdarHudaykuliyew
 
一比一原版(IC毕业证)帝国理工大学毕业证如何办理
一比一原版(IC毕业证)帝国理工大学毕业证如何办理一比一原版(IC毕业证)帝国理工大学毕业证如何办理
一比一原版(IC毕业证)帝国理工大学毕业证如何办理
conose1
 
how to sell pi coins effectively (from 50 - 100k pi)
how to sell pi coins effectively (from 50 - 100k  pi)how to sell pi coins effectively (from 50 - 100k  pi)
how to sell pi coins effectively (from 50 - 100k pi)
DOT TECH
 
can I really make money with pi network.
can I really make money with pi network.can I really make money with pi network.
can I really make money with pi network.
DOT TECH
 
How Non-Banking Financial Companies Empower Startups With Venture Debt Financing
How Non-Banking Financial Companies Empower Startups With Venture Debt FinancingHow Non-Banking Financial Companies Empower Startups With Venture Debt Financing
How Non-Banking Financial Companies Empower Startups With Venture Debt Financing
Vighnesh Shashtri
 
An Overview of the Prosocial dHEDGE Vault works
An Overview of the Prosocial dHEDGE Vault worksAn Overview of the Prosocial dHEDGE Vault works
An Overview of the Prosocial dHEDGE Vault works
Colin R. Turner
 
Financial Assets: Debit vs Equity Securities.pptx
Financial Assets: Debit vs Equity Securities.pptxFinancial Assets: Debit vs Equity Securities.pptx
Financial Assets: Debit vs Equity Securities.pptx
Writo-Finance
 
一比一原版(UoB毕业证)伯明翰大学毕业证如何办理
一比一原版(UoB毕业证)伯明翰大学毕业证如何办理一比一原版(UoB毕业证)伯明翰大学毕业证如何办理
一比一原版(UoB毕业证)伯明翰大学毕业证如何办理
nexop1
 

Recently uploaded (20)

Tdasx: Unveiling the Trillion-Dollar Potential of Bitcoin DeFi
Tdasx: Unveiling the Trillion-Dollar Potential of Bitcoin DeFiTdasx: Unveiling the Trillion-Dollar Potential of Bitcoin DeFi
Tdasx: Unveiling the Trillion-Dollar Potential of Bitcoin DeFi
 
Globalization (Nike) Presentation PPT Poster Infographic.pdf
Globalization (Nike) Presentation PPT Poster Infographic.pdfGlobalization (Nike) Presentation PPT Poster Infographic.pdf
Globalization (Nike) Presentation PPT Poster Infographic.pdf
 
Instant Issue Debit Cards
Instant Issue Debit CardsInstant Issue Debit Cards
Instant Issue Debit Cards
 
Turin Startup Ecosystem 2024 - Ricerca sulle Startup e il Sistema dell'Innov...
Turin Startup Ecosystem 2024  - Ricerca sulle Startup e il Sistema dell'Innov...Turin Startup Ecosystem 2024  - Ricerca sulle Startup e il Sistema dell'Innov...
Turin Startup Ecosystem 2024 - Ricerca sulle Startup e il Sistema dell'Innov...
 
Instant Issue Debit Cards - School Designs
Instant Issue Debit Cards - School DesignsInstant Issue Debit Cards - School Designs
Instant Issue Debit Cards - School Designs
 
Analyzing the instability of equilibrium in thr harrod domar model
Analyzing the instability of equilibrium in thr harrod domar modelAnalyzing the instability of equilibrium in thr harrod domar model
Analyzing the instability of equilibrium in thr harrod domar model
 
Seminar: Gender Board Diversity through Ownership Networks
Seminar: Gender Board Diversity through Ownership NetworksSeminar: Gender Board Diversity through Ownership Networks
Seminar: Gender Board Diversity through Ownership Networks
 
一比一原版(GWU,GW毕业证)加利福尼亚大学|尔湾分校毕业证如何办理
一比一原版(GWU,GW毕业证)加利福尼亚大学|尔湾分校毕业证如何办理一比一原版(GWU,GW毕业证)加利福尼亚大学|尔湾分校毕业证如何办理
一比一原版(GWU,GW毕业证)加利福尼亚大学|尔湾分校毕业证如何办理
 
how to swap pi coins to foreign currency withdrawable.
how to swap pi coins to foreign currency withdrawable.how to swap pi coins to foreign currency withdrawable.
how to swap pi coins to foreign currency withdrawable.
 
What price will pi network be listed on exchanges
What price will pi network be listed on exchangesWhat price will pi network be listed on exchanges
What price will pi network be listed on exchanges
 
1. Elemental Economics - Introduction to mining.pdf
1. Elemental Economics - Introduction to mining.pdf1. Elemental Economics - Introduction to mining.pdf
1. Elemental Economics - Introduction to mining.pdf
 
5 Tips for Creating Standard Financial Reports
5 Tips for Creating Standard Financial Reports5 Tips for Creating Standard Financial Reports
5 Tips for Creating Standard Financial Reports
 
Donald Trump Presentation and his life.pptx
Donald Trump Presentation and his life.pptxDonald Trump Presentation and his life.pptx
Donald Trump Presentation and his life.pptx
 
一比一原版(IC毕业证)帝国理工大学毕业证如何办理
一比一原版(IC毕业证)帝国理工大学毕业证如何办理一比一原版(IC毕业证)帝国理工大学毕业证如何办理
一比一原版(IC毕业证)帝国理工大学毕业证如何办理
 
how to sell pi coins effectively (from 50 - 100k pi)
how to sell pi coins effectively (from 50 - 100k  pi)how to sell pi coins effectively (from 50 - 100k  pi)
how to sell pi coins effectively (from 50 - 100k pi)
 
can I really make money with pi network.
can I really make money with pi network.can I really make money with pi network.
can I really make money with pi network.
 
How Non-Banking Financial Companies Empower Startups With Venture Debt Financing
How Non-Banking Financial Companies Empower Startups With Venture Debt FinancingHow Non-Banking Financial Companies Empower Startups With Venture Debt Financing
How Non-Banking Financial Companies Empower Startups With Venture Debt Financing
 
An Overview of the Prosocial dHEDGE Vault works
An Overview of the Prosocial dHEDGE Vault worksAn Overview of the Prosocial dHEDGE Vault works
An Overview of the Prosocial dHEDGE Vault works
 
Financial Assets: Debit vs Equity Securities.pptx
Financial Assets: Debit vs Equity Securities.pptxFinancial Assets: Debit vs Equity Securities.pptx
Financial Assets: Debit vs Equity Securities.pptx
 
一比一原版(UoB毕业证)伯明翰大学毕业证如何办理
一比一原版(UoB毕业证)伯明翰大学毕业证如何办理一比一原版(UoB毕业证)伯明翰大学毕业证如何办理
一比一原版(UoB毕业证)伯明翰大学毕业证如何办理
 

PEO Risk Management Advisor - August 2011

  • 1. PEO ADVISOR RISK MANAGEMENT © Praxiom Risk Management August 2011 Features The Importance of Transparency in Medical Bill Review - Jason Beans, CEO, Rising Medical Solutions Medical bill review can be a powerful tool in the claims management arsenal, if used properly. The savings achieved through a well run program directly impacts the bottom line, reducing claims costs and increasing surplus. The process is much more technical and complex than most people realize and, due to that, I see up to a 20% difference in overall program savings in many states. That difference makes a huge impact on whether your program is performing or underperforming. Data analytics can also dramatically impact your results, and this should be part of any good bill review program. Nowhere else can such a wide array of data be produced that allows for comprehensive claims analysis and alerts. The capabilities of data analytics are infinite and underutilized. Companies need to start doing a better job of flagging claims that need intervention, setting reserves with predictive models, recognizing fraud and identifying the best treatment patterns. The problem is that the optimal performance of a bill review program requires one critical component: “transparency.” However, instant access to clear data is too often the exception, not the rule. One area that frequently lacks transparency is the reporting of results. I often see data broken into micro-bites that hide or mislead the client about their program’s overall results. The most important number to judge your bill review program by is not ROI, or PPO penetration, or even the bill review program fee – it is the net savings (total savings less the bill review fees). Let me give two scenarios: Would you rather have a $20 to $1 ROI or a $6.67 to $1 ROI? Sounds like a simple question, but the out- comes are actually not what you’d expect. In scenario A: Imagine a bill with $1,000 in charges, $200 in fee schedule discounts and a $10 bill processing fee (20 to 1 ROI). The resulting bill cost is $810, with a net savings of 19%. In scenario B: You get an additional $200 discount over fee schedule (e.g. PPO, nego- tiations) at a 25% of savings rate, bringing the total savings to $400 for $60 in fees ($6.67 to $1 ROI). The resulting bill cost is $660, with a net savings of 34% – demon- strating why it’s net savings that is really the key metric to give you the best indica- tion of program performance. Continue Reading... Avoiding Heat Illnesses - John Conrad Whether you are a worker or weekend warrior, hot and humid conditions can cause heat illnesses. Each year, workers, home owners and athletes experience heat re- lated illnesses that in some cases result in deaths. Confirmed heat related death sta- tistics for workers average about twelve per year. During an eleven day period of 100 Professional Employer 2011 Conference degree temperatures, July 16 through 27, 2006, heat was September 12-14, 2011 attributed to 86 deaths in California. JW Marriott Orlando Grande Lakes 4040 Central Florida Parkway Those most affected are workers exposed to hot and humid Orlando, FL 32837 conditions, especially those performing heavy work tasks or using bulky protective clothing and equipment. Some work- www.napeo.org/PEM2011 ers might be at greater risk than others if they have not built up a tolerance to hot conditions, are in poor physical condition, are older, or if they have heart disease, high blood pressure, or are taking certain medications. So, what are heat illnesses? There are three major forms of heat illnesses: heat cramps, heat exhaustion, and heat stroke, with heat stroke being a life threatening condition. Continue Reading... © 2011 P rax iom Risk Management LLC www.prax iom-rm. com Prax iom Risk Management is a Certified Risk Management and Safety P rofessional firm. 08/11
  • 2. PEO RISK MANAGEMENT ADVISOR © Praxiom Risk Management Free Webinar Schedule The Certification Institute’s PEO WC Risk Management Webinar Series www.certificationinstitute.org The Certification Institute’s free webinar series returns in August with another full schedule. Participa- tion in June and July was very high, with over 300 individuals representing 75+ PEOs. The webinars are short, 1-hour courses that cover important tactical topics for PEO operators. The webinars also provide access to resource material and industry operational statistics that won’t be found elsewhere. While sponsored by the CI, the webinars are being hosted by Certified Risk Managers from the PEO consulting firm of Praxiom Risk management. New Webinar in August: Underwriting Profitable PEO Clients Tuesday, August 9th and 23rd: 2:00 to 3:00 (ET) http://peounderwriting.eventbrite.com At the conclusion of the webinar you will have an understanding of: Obtaining the right underwriting data Hazard Groupings and client classifications When to pre-inspect Loss Ratio and EMR impact on renewal pricing Retention and Rate Level objectives Returning Webinars Workers Compensation Experience Mod for PEOs – Understanding the EMR Worksheet Thursday, August 4th and 18th: 2:00 PM to 3:00 PM (ET) The key components of the NCCI experience mod and calculation Interpretation of codes and abbreviations Recommendations for influencing a reduction in the EMR Workers Compensation Experience Mod for PEOs – True Cost of Client Claims Thursday, August 11th and 25th: 2:00 PM to 3:00 PM (ET) Minimum and controllable EMR Premium associated with controllable EMR The ‘true” cost of a claim A single client’s impact on EMR and premium Measuring PEO WC Performance Tuesday, August 16th and 30th: 2:00 to 3:00 (ET) Requirements for data analysis Ideal Risk Management Information System (RMIS) capabilities Key WC metrics to monitor and timing Best client level reports Best PEO level reports To view all the current webinars and register, follow the link below: www.peoriskmanagement.eventbrite.com © 2011 P rax iom Risk Management LLC www.prax iom-rm. com Prax iom Risk Management is a Certified Risk Management and Safety P rofessional firm. 08/11
  • 3. PEO RISK MANAGEMENT ADVISOR © Praxiom Risk Management Measuring PEO Performance Evaluate your PEO’s practices vs CI This section is dedicated to those PEOs that manage their Workers certification guidelines... Compensation program through a Large Deductible or captive ar- As we review the CI’s best practices for PEO risk management in each rangement, and utilize positive results as a profit center. of their 5 categories, evaluate how your PEO stacks up by answering Premium these questions: There are many definitions of WC premium that can be confusing and are often times mixed up erroneously. Here is a good list of Risk Control Assessment the most common premium definitions. Manual Premium = (payroll/$100)/ manual rates Compliance with Risk Control Requirements—Have you established written procedures for requiring the Client to comply with “critical” Subject Premium = manual premium * increased limit charge (this recommendations? Do your procedures should include: is also the premium that is “subject to” the EMR Communication requirements to the client Standard Premium = Subject premium * EMR (also called Modified Target dates for compliance Premium) Taking appropriate action if Client fails to comply Deductible Premium = Standard premium * deductible factor Documenting the action(s) taken Discounted Premium = Standard premium * discount factor New Client Needs Assessment— Has the PEO established written procedures for conducting a “needs assessment” of each new client? Estimated Premium = Discounted premium + Taxes + assessments Do you produce a service plan that is consistent with the needs as- Final Premium = Premium determined after audit sessment? Do the Needs Assessment and Service Plan consider Cli- Other forms of Premium used in Retrospective Plans include: ent requests for specific services and requirements included in the CSA? Do the procedures include how the Service Plan will be docu- Basic Premium = Standard premium * Basic factor (this is the por- mented and used? tion of the retro plan that covers admin costs, overhead, profit, and insurance charges) Providing Appropriate Risk Control Services— Has the PEO estab- lished written procedures for delivering Risk Control services to Cli- Minimum Premium = Standard premium * minimum factor (this ents consistent with Service Plans? represents the least amount you potentially pay on a retro plan) Accident Investigation— Have you established poli- Maximum Premium = Standard premium * maximum factor (this cies requiring investigation of employee accidents represents the most you potentially pay on a retro plan) when they result in a work related injury and subse- quently reported as a claim? Do the policies describe which accidents will be investigated (med only, lost Workers Compensation Highlights time, specific injuries, etc)? Have you identified what method will be used for investigation (telephone vs on-site) and the The WC Benchmarking Analysis format of documenting the investigation results? By John Keller, CRM ARM CIC AAI Certificate Tracking Confirmation - Do you have a tracking process in A Benchmarking Analysis is one of the most beneficial tools for place for clients with material contingent workers’ compensation evaluating operational efficiencies, yet it is significantly underuti- exposure? lized. Background Investigations—Has the PEO required as part of the When a Benchmarking Analysis is completed for a company’s service plan and CSA that the clients cooperate with the PEO in con- Workers’ Compensation program, there are three primary areas of ducting pre-employment and/or post-employment background inves- focus: Accident, Post-Injury Cost Management, and Organizational tigations? Is an MVR review, where applicable, a part of the back- Procedures. Each of these three components can have numerous ground investigations? ratios and statistics that can be used for comparison. Which ratios Claims Review— Does the PEO review and document, at least are used typically depends on the industry and the type of work monthly, the claims experience and resulting recommendations for being performed. Below is an outline of the most common statis- clients with claims frequency or severity issues? Do you use the re- tics used in each component of a Benchmark Analysis with a brief sults of these reviews to implement client-specific corrective actions description. such as placement on the watch-list, providing risk control services, The Accident Component and/or terminating the client? Frequency Rate – is a measure of the number of claims (anything >$0 paid) divided by a predetermined measure. Insurance compa- nies most commonly express this as… Continue Reading For more on CI requirements visit: www.certificationinstitute.org © 2011 P rax iom Risk Management LLC www.prax iom-rm. com Prax iom Risk Management is a Certified Risk Management and Safety P rofessional firm. 08/11
  • 4. PEO RISK MANAGEMENT ADVISOR © Praxiom Risk Management Benchmarking The Benchmarking section is used to outline various industries in terms of their Workers Compensation risk factors, historical claims statistics, and key loss sources. Benchmarking statistics are obtained from a variety of credible sources including the largest WC insurance companies in the U.S. and The Bureau of Labor and Statistics. The statistics used are aggregated from all states and averaged over a 5 year rolling period. All stats below are from claims incurred between 1/1/06—12/31/10. This month we continue our look at hospitality services, with a review of SIC 5461—Retail Bakeries. Bakeries SIC 5461 - Top 5 Loss Sources % Total Incurred Industry SIC: 5461 - Retail Bakeries Machine All Other As of: 4/30/2011 7% 17% Material Handling Period: 1/1/06 - 12/31/2010 31% Average Incurred $2,298 Struck Average Paid $1,615 By/Against 8% % claims > $10,000 5.3% Slip/Fall - Same Slip/Fall - % Incurred >$10,000 75.3% Elevated Level 28% % claims >$25,000 2.3% 9% % Incurred >$25,000 56.2% 0 -3 4 - 10 11+ First Report Mean Median Days Days days Timeliness 7.61 1.0 76.4% 13.2% 10.4% Key Metrics - SIC 54xx Loss Sources Average Inc. % Inc % Claims Frequency Rate 2.3 Material Handling $ 5,855 31.1% 12.2% Loss Rate $0.88 Slip/Fall - Same Level $ 3,158 28.1% 20.4% Slip/Fall - Elevated $ 8,603 9.6% 2.6% NAIC 311811 Struck By/Against $ 821 8.0% 22.3% BLS Stat 2006 2007 2008 2009 Machine $ 9,869 6.7% 1.6% Recordable 1.8 2.9 2.8 1.6 All Other 16.7% 41.0% DART 1.2 1.8 2.1 0.9 Rate Definitions: Frequency Rate = # non $0 claims / payroll per $1M Recordable = # OSHA recordable incidents / 200,000 hours1 Loss Rate = Total Incurred $ / payroll per $100 DART = incidents w/ Days Away, Restricted duty or job Transfer / 200,000 hours1 1—200,000 hours represents the amount of time worked by 100 WSE in one year © 2011 P rax iom Risk Management LLC www.prax iom-rm. com Prax iom Risk Management is a Certified Risk Management and Safety P rofessional firm. 08/11
  • 5. PEO RISK MANAGEMENT ADVISOR © Praxiom Risk Management Benchmarking The Benchmarking section is used to outline various industries in terms of their Workers Compensation risk factors, historical claims statistics, and key loss sources. Benchmarking statistics are obtained from a variety of credible sources including the largest WC insurance companies in the U.S. and The Bureau of Labor and Statistics. The statistics used are aggregated from all states and averaged over a 5 year rolling period. All stats below are from claims incurred between 1/1/06—12/31/10. This month we continue our look at hospitality services, with a review of SIC 5421—Meat and Fish Markets. Meat and Fish Markets SIC 5421 - Top 5 Loss Sources % Total Miscellaneous Incurred Industry SIC: 5421 - Meat Markets 5% All Other As of: 4/30/2011 Vehicles 5% Period: 1/1/06 - 12/31/2010 12% Workplace Violence Average Incurred $7,351 36% Average Paid $4,367 % claims > $10,000 7.6% % Incurred >$10,000 91.4% Slip/Fall - Elevated % claims >$25,000 4.7% 29% % Incurred >$25,000 84.2% Slip/Fall - Same Level 13% 0 -3 4 - 10 11+ First Report Mean Median Days Days days Timeliness 6.03 1.0 75.4% 14.0% 10.5% Key Metrics - SIC 54xx Loss Sources Average Inc. % Inc % Claims Frequency Rate 2.3 Workplace Violence $ 226,578 36.1% 1.2% Loss Rate $0.88 Slip/Fall - Elevated $ 27,865 28.8% 7.6% NAIC 445210 Slip/Fall - Same Level $ 4,605 13.2% 21.1% BLS Stat 2006 2007 2008 2009 Vehicles $ 30,412 12.1% 2.9% Recordable 2.9 4.3 2.8 3.6 Miscellaneous $ 9,327 4.5% 3.5% DART 1.3 2.6 1.9 1.2 All Other 5.4% 63.8% Rate Definitions: Frequency Rate = # non $0 claims / payroll per $1M Recordable = # OSHA recordable incidents / 200,000 hours1 Loss Rate = Total Incurred $ / payroll per $100 DART = incidents w/ Days Away, Restricted duty or job Transfer / 200,000 hours1 1—200,000 hours represents the amount of time worked by 100 WSE in one year © 2011 P rax iom Risk Management LLC www.prax iom-rm. com Prax iom Risk Management is a Certified Risk Management and Safety P rofessional firm. 08/11
  • 6. PEO RISK MANAGEMENT ADVISOR © Praxiom Risk Management Stay Connected... If you haven’t already joined, there is now a group on LinkedIn dedicated to PEO Risk Management. All PEO operators and Risk Managers are encouraged to join and participate in the online discussions. Or, you can simply follow the news posts that relate to PEO, Risk Management, and Workers Compensation. Click here to go to the PEO Risk Management group on LinkedIn and join. With PEO Risk Management professionals averaging 20 years of experience and encompassing a broad range of industry expertise, Praxiom Risk Management is committed to providing a wide range of resources to help PEOs mitigate risk and grow their Workers Compensation profit center. This PEO RM Advisor is a monthly e-newsletter designed to keep PEO executives and Risk Manage- ment professionals informed of relevant topics in the area of PEO risk management. Sharing infor- mation and best practice through e-newsletters is one of the many ways we help support PEO or- ganizations' risk management efforts. If you would like to contribute industry specific content or articles for publication in the areas be- low, you may submit them to the Editor at: RiskAdvisor@praxiom-rm.com. Loss Control Claims Management Performance Metrics RM Information Systems Policy Administration Carrier Relationships Industry Certifications Up Next… We’ll continue benchmarking the hospitality industry with an in depth look into the WC results of: 5511—New/Used Car Dealers 5571—Motorcycle Dealers © 2011 P rax iom Risk Management LLC www.prax iom-rm. com Prax iom Risk Management is a Certified Risk Management and Safety P rofessional firm. 08/11