1. Patterns of Iron Use in Societal
Evolution§
D A N I E L B . M Ü L L E R , * , † , ‡
T A O W A N G , † , ‡
A N D B E N J A M I N D U V A L †
Center for Industrial Ecology, School of Forestry and Environmental
Studies, Yale University, 205 Prospect Street, New Haven,
Connecticut 06511, United States and Department of Hydraulic and
Environmental Engineering, Norwegian University of Science and
Technology, S.P. Andersens veg 5, 7491 Trondheim, Norway
Received July 6, 2010. Revised manuscript received October
30, 2010. Accepted November 3, 2010.
A dynamic material flow model was used to analyze the
patterns of iron stocks in use for six industrialized countries.
The contemporary iron stock in the remaining countries was
estimatedassumingthattheyfollowasimilarpatternofironstock
per economic activity. Iron stocks have reached a plateau of
about 8-12 tons per capita in the United States, France, and the
United Kingdom, but not yet in Japan, Canada, and Australia.
The global average iron stock was determined to be 2.7 tons per
capita. An increase to a level of 10 tons over the next
decades would deplete about the currently identified reserves.
A subsequent saturation would open a long-term potential to
dramaticallyshiftresourceusefromprimarytosecondarysources.
The observed saturation pattern implies that developing
countries with rapidly growing stocks have a lower potential
for recycling domestic scrap and hence for greenhouse
gas emissions saving than industrialized countries, a fact that
has not been addressed sufficiently in the climate change
debate.
Introduction
The massive growth of global material use over the past years,
particularly due to the rise of emerging market economies,
has revived questions about the long-term prospects and
sustainability of resource use (1) and the possibilities to
reduce energy use and to mitigate greenhouse gas emissions
associated with their production (2, 3). The iron and steel
industry, for example, accounts for about 6% of global final
energy use and about 6-7% of global anthropogenic carbon
dioxide emissions (2, 4). An effective way to reduce resource
depletion, waste generation, energy use, and environmental
impacts associated with resource use is to reuse products or
components or to recycle scrap. Efforts to reduce these
impacts in the medium- and long-term should therefore be
informed by models that are capable of explaining and
anticipating resource use and scrap availability.
Traditional resource models and are often based on the
EnvironmentalKuznetscurve(EKC),whichhypothesizesthat
the relationship between per-capita income and environ-
mental indicators has an inverted U-shape. Applied to
resources,thehypothesisimpliesthattheintensityofresource
use (IU)sdefined as the ratio of physical material use per
incomesgrows rapidly in initial stages of industrialization,
buteventuallyfallsasincomerisesfurther(5,6).Thedeclining
IU is generally explained by structural change toward
information-intensive industries and services that are as-
sumed to be less material-intensive than the manufacturing
sector, increasing environmental awareness, enforcement
of environmental regulations, better technology, and higher
environmental expenditures.
The limitations of EKC-based resource models have been
discussed widely (7-10) and include the following: (i) EKC
models are based on statistical correlation, lacking a systems
perspective capable of explaining the mechanisms that shape
the IU and other important variables in resource cycles, such
as scrap flows or mine production; (ii) they implicitly assume
that resource cycles are driven by production (flow from
process 7 to process 8 in Figure 1) and tend to neglect the
stocks of different service-providing product categories; (iii)
they lack robustness, because IU is an abstract ratio of two
flow variables that tends to fluctuate, resulting in a weak
foundation for estimating its future trend when used for
scenario purposes.
IU approaches are essentially based on observed patterns
of specific flows or relationships between flows. We propose
here an alternative based on patterns of in-use stock
evolution. Observing stocks in use has several advantages:
(i) stocks in use form the missing link of traditional models
to explain the relationship between end use (flow into the
stocks) and obsolete scrap generation (generated from
products exiting in-use stocks); (ii) they have a physical
meaning as they provide services to people and define their
lifestyles; and (iii) they have a more robust behavior due to
their inertia and are therefore better suited for long-term
analyses.
Iron is by far the most important metal used by man in
terms of quantity and environmental impact (11). The trend
inrawsteelproductionoverthepastdecades(Figure2)shows
two important phenomena: (i) industrialized countries
experienced a similar patternsa strong growth, followed by
a slack (with different distinctness) and stabilization on a
high level; (ii) the current level of steel production per capita
varies by a factor of 4-5 among the countries shown here
(U.K. ca. 200 kg/a, Japan ca. 900 kg/a).
In 1954, during the boom of American industrialization,
geochemist Harrison Brown speculated that the iron stock
incorporated in products in use might eventually reach
saturation (12). His reasoning was that iron, unlike many
other metals, is mainly used for bulk applications such as
buildings, infrastructures, or transport vehicles, for which
there is not an endless increase in demand. A recent study
demonstrates that the per-capita iron stock in use in the U.S.
indeed reached a plateau around 1980 (13).
This observation led us to ask whether this apparent
saturation is a transient phenomenon limited to the U.S., or
whether it reveals a more fundamental pattern of iron use
in the path of a country’s development. This implies the
hypothesis that per-capita iron stocks in use indicate the
level of industrialization: they are negligible in agrarian
societies, they increase with industrialization, and they
remain on constant, high levels during transitions from
industrialized to information or service-based economies.
Should this iron saturation hypothesis be supported by
further research, patterns of iron stock evolution observed
in industrialized countries could be used as benchmarks for
§
ThismanuscriptispartoftheEnvironmentalPolicy:Past,Present,
and Future Special Issue.
* Corresponding author address: Department of Hydraulic and
Environmental Engineering, Norwegian University of Science and
Technology, S.P. Andersens veg 5, 7491 Trondheim, Norway; phone:
+47-73594754; fax: +47 73591298; e-mail: Daniel.Mueller@ntnu.no.
†
Yale University.
‡
Norwegian University of Science and Technology.
Environ. Sci. Technol. 2011, 45, 182–188
182 9 ENVIRONMENTAL SCIENCE & TECHNOLOGY / VOL. 45, NO. 1, 2011 10.1021/es102273t 2011 American Chemical Society
Published on Web 12/01/2010
2. emerging market economies and thereby provide a more
solid basis to inform policies on long-term steel demand,
scrap generation, and energy demand and emissions related
to their production.
Several studies have been conducted that assume stock
saturation to estimate future obsolete scrap generation, e.g.,
for buildings (14-16), vehicles (17), aluminum (18), and steel
(19), however, there is a lack of literature that analyzes the
evidence for this assumption.
In this paper, we first analyze the patterns of per-capita
iron stocks in use over time for six industrialized countries
using a top-down approach. Of interest is how the growth
ratechangesovertime,whetherthesecountrieshavereached
saturation, and if they dohave what the potential saturation
levels for different product categories are. Subsequently, the
iron stocks in use are plotted against economic activity as
an explanatory variable to develop crude first estimates of
contemporary iron stocks in use for all countries and the
globe.
Methods
The historic iron stocks in use for Australia, Canada, France,
Japan, the U.K., and the U.S. were calculated using a system
definition described in Figure 1 and a dynamic material flow
model described in ref 13 and the Supporting Information.
Startingpointswerehistoricaldataforcrudesteelandcastings
production and information about the sectors to which the
material was delivered. Historic trade statistics for about 200
product categories were used to account for imports and
exports of iron embedded in semis, parts, and final products,
and to compute the amount of iron entering use in different
product categories. For each product category, assumptions
abouttheproductlifetimeweremadetocalculatetheamount
of iron leaving use and the stock accumulation rate.
Stock data are most sensitive to the parameters of the
distribution of finished steel and castings among different
manufacturing sectors, the import and export of iron
embedded in parts and final products (“indirect iron trade”),
and the lifetime of the final products.
Lifetime data may vary among products within a product
category, among countries, and over time while data sources
arescarce(20).Asensitivityanalysiswasconductedtoanalyze
the impact of different shapes of lifetime distribution
functions(normal,log-normal,Weibull)anddifferentaverage
lifetimes (see Supporting Information). Results in the main
paper are shown only for normal distribution with high,
medium, and low estimates for the average lifetimes. Given
thelackofcountry-specificlifetimedata,theparameterswere
chosen to be identical for all countries to improve transpar-
ency and comparability. Medium lifetime assumptions are
used in subsequent analysis for all countries with exception
of Japan, where studies have indicated significantly shorter
lifetimes for buildings (21, 22), and often shorter lifetimes
for infrastructures, vehicles, and machinery are used (23).
Therefore, short lifetime assumptions are subsequently
assumed for Japan.
FIGURE 1. System definition of the iron cycle used to determine the in-use stocks. Transformation processes designated in blue,
market processes are shown in pink.
FIGURE 2. Crude steel production in various countries, ca.
1900-2008: total production (top) and production per capita
(bottom). ACFB ) sum of Australia, Canada, France, and the
United Kingdom; 1 Mt/a ) 1 million metric tons per annum.
VOL. 45, NO. 1, 2011 / ENVIRONMENTAL SCIENCE & TECHNOLOGY 9 183
3. The contemporary iron stocks in the remaining 222
countries were calculated based on the level of economic
activity,assumingthatthesecountriesfollowasimilarpattern
of iron stock per economic activity as observed in the six
countries analyzed in more detail. Economic activity was
measured in GDP based on purchasing power parity (PPP)
in 1990 international dollars (24), because physical invest-
ments into capital stocks are thought to be better reflected
by PPP, and because time series reaching long back in time
areavailable.Theaverageintensityofironstockpereconomic
activity (Figure 3) was derived by curve fitting assuming a
logistic growth function with a predefined saturation of 10
t/cap and 0 t/cap for GDP below 1800 USD. See Supporting
Information for a comparison with a Gompertz approach.
Results
The simulation results (Figure 4) show that in 2005, the total
per-capita iron stocks in industrialized countries varied
between 8 (France and U.K.) and 12 t (Canada) (assuming
shorter lifetimes for Japan), thus a much lower range than
could have been expected from the wide range of per-capita
steel production. The relative similarity in the employment
of iron in various industrialized societies indicates that stocks
behave more robustly than flows.
The decomposition of the total iron stock indicates further
similarities: all of the investigated countries employ most of
the iron in Construction, followed by Machinery and Ap-
pliances, Transportation, and Others. Furthermore, the per-
capita iron stocks are fairly similar for Machinery and
Appliances (from 2 tons in France to 3 tons in Canada),
Transportation (from 1 ton in U.K. to 2 tons in U.S.), and
Others (from 0.3 to 0.6). However, there are large differences
in the amount of iron employed in Construction (from 2.5
tons in France to 9-10 tons in Japan).
For all countries observed, the stock growth rate tends to
be relatively small in early stages of industrialization. The
peak in both growth speed and iron and steel demand is
reached only after a level of about 2 tons per person has
been passed. This might be explained by the fact that an
initialcapitalstockofiron-intensiveplantsandinfrastructures
to produce, transport, and manufacture steel iron and steel
into different products needs to be established prior to peak
growth. A recent top-down study (25) and the subsequent
estimation show that China has just reached this threshold
level.
The observed countries strongly differ in terms of their
growth speed during industrialization: for example, to
increase the iron stock from 2 to 7 t/cap, France needed
about 60 years, while Japan achieved the same in about 20
years. Newly industrialized countries tend to built up their
iron stocks faster than the front runners did, supposedly
because the followers can benefit from the major inventions
and innovations in iron and steel containing products and
structures made earlier (for example railways, automobiles,
construction technologies).
The U.S., France, and the U.K. have reached a plateau in
overall per-capita iron stocks. More importantly, saturation
can be observed independent of the lifetime assumptions
(bands in Figure 4). The levels of saturation, however, differ
with the assumed lifetimes. The saturation levels for France
and the U.K. (both about 8 t/cap for medium lifetime) are
lower than that found for the U.S. (ca. 10-11 t/cap). Due to
improvements in the indirect trade analysis, the saturation
level for the U.S. identified here is slightly lower than that
found previously (13). The U.K. reached saturation, like the
U.S., at the end of the 1970s, whereas France had a delay of
about one decade. Both economies use roughly the same
amount of iron in Construction (ca. 4 t/cap), but the U.K.
economy uses more iron in Machinery and Appliances, and
France has larger iron stocks in Transportation and Others.
Japan’s per-capita iron stock is still growing, although its
growth rate has declined over the past two decades. This
slowdown is more pronounced if shorter lifetimes are
assumed. Given the current trend, Japan could reach
saturation at about 12-13 t/cap within a decade or two. The
per-capita stocks in Transportation, Machinery and Appli-
ances, and Others have reached saturation. In contrast, the
iron reservoir in Construction (9 tons for lower lifetimes) is
about double that of other countries analyzed, and is still
growing. Several factors might explain this. Due to the high
population density, Japan tends to build higher and thus
employs more steel-intensive construction technologies
(concrete and steel) than less densely populated countries,
which tend to use more wood or brick. It can be assumed
that the steel-intensive construction technology more than
compensates the smaller per-capita floor area. In addition,
Japan’s high level of exposure to earthquakes, combined with
its hot and humid and thus corrosive climatic conditions,
has not only triggered higher building replacement rates
(resulting in reduced lifetimes), but has also led to stricter
design regulations for new buildings and seismic retrofit of
existing vulnerable buildings (26), thereby further increasing
the iron density of the building and infrastructure stock due
to steel reinforcements. The finding of a declining growth
rate confirms a recent study by Hirato et al. (27), however,
the absolute values vary by about 30%, probably due to
different assumptions for lifetimes and initial conditions.
Australia’sandCanada’spercapitaironstocks,incontrast,
shownosignsofsaturation.Constructionstocksarerelatively
large (about 6 t/cap) but smaller than in Japan, and account
for most of the total growth. The reason for their continued
growth might be related to the fact that both countries have
largeminingsectorsandexperiencedsharplygrowingexports
of resources over the past years, which involved a growing
steel reservoir in infrastructures for mining, processing, and
transportation of ores materials.
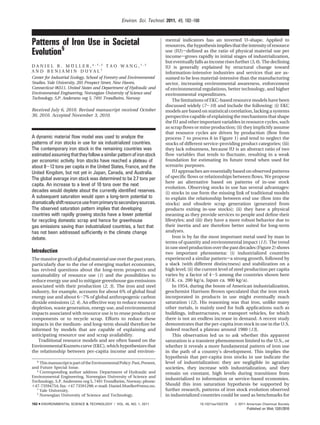
Figure 3 shows that iron stocks in use tend to start growing
at per capita incomes of 1000 $ (U.S.) to 4800 $ (Australia),
and they reach a plateausif at allsat per capita incomes
between 13,000 $ (U.K.) and 18,000$ (U.S.). The late start in
ironstockgrowthoftheAustralianeconomycanbeexplained
by its large agricultural sector and by a likely underestimation
of its iron stocks at the beginning of the 20th century, when
domestic steel production was insignificant and steel imports
in the form of metal or products were recorded poorly. As
FIGURE 3. Per capita iron stocks in use versus per capita GDP
PPP (1990 international dollars). Iron stock data are based on
medium lifetime assumptions, except for Japan, where lower
lifetime estimates were applied. The thick gray-green line is a
fitted logistic growth curve used to estimate the contemporary
iron stocks in other countries.
184 9 ENVIRONMENTAL SCIENCE & TECHNOLOGY / VOL. 45, NO. 1, 2011
4. expected, Australia, Canada, and Japan have growing iron
stocks at higher per capita incomes of 22-24,000 $.
Global iron stocks in the ground (reserves) are estimated
to be 79 Gt or 12 t/cap (28) (Figure 5 top). The largest iron
stocks in reserves are found in Brazil (16 Gt), Russia (14 Gt),
Ukraine (9 Gt), Australia (9 Gt), and China (7 Gt). In terms
of per capita iron stocks in reserves, Australia (440 t/cap)
leads before Sweden (240 t/cap), Kazakhstan (220 t/cap),
and Ukraine (190 t/cap). Although China and India have
substantial iron reserves in absolute terms, their large
population leads to small per capita reserves (China 5 t/cap
and India 4 t/cap).
In contrast, the global iron stocks in use have reached
about 18 Gt or 2.7 t/cap, which is about 23% of the amount
of the global reserves (Figure 5 bottom). The largest absolute
in-use iron stocks are found in the U.S. (3.2 Gt), followed by
China (2.2 Gt), Japan (1.7 Gt), Germany (0.7 Gt), and Russia
(0.7 Gt). On a per-capita basis, Japan and Canada (12 t/cap)
FIGURE 4. Decomposition of total iron stocks (blue) into four product categories. A normal lifetime distribution function is applied to
each category with various average product lifetime τ and standard deviation σ (in years). The uncertainty of the simulation is
indicated as a band, with its upper bound, dark midline, and lower bound corresponding to the higher, medium, and lower lifetime
assumptions.
VOL. 45, NO. 1, 2011 / ENVIRONMENTAL SCIENCE & TECHNOLOGY 9 185
5. lead in front of the U.S. (11 t/cap). Although China’s per
capita iron stock (2.2 t/cap) is only about 20-25% that of
industrialized countries, due to its large population, it
constitutes the second largest iron stock in use. India, which
has a similar population multiplier, has about five times
smaller iron stocks (0.4 t/cap) than China. In comparison,
Hatayama et al. (19) estimated the global in-use iron stock
to be 12.7 Gt or about 2 t/cap, thus slightly less (probably
due to differences in the lifetime assumptions).
Primary iron resources tend to be strongly represented in
the Southern hemisphere, while secondary iron resources
are more concentrated in the Northern hemisphere. The
largest exception is Africa, which neither disposes of large
(identified) primary nor secondary iron resources. While
South America seems to be well endowed with iron ore for
its industrialization, Africa, the Middle East, and Asia are
more likely to depend on imports over the coming decades.
Discussion
The discovered patterns of iron stocks in use confirm and
complement previous studies of IU patterns. The decreasing
IU for steel observed for many industrialized countries (29)
is in line with and could be explained by a tendency for
per-capita iron stocks to flatten off at a certain point while
GDP remains growing. Speculations about an absolute
decoupling in steel demand, however, cannot be supported
by this study: none of the analyzed countries shows a
shrinkingper-capitaironstockinuse,whichwouldbeneeded
for long-term absolute decoupling of steel demand. Given
the stock patterns observed, a more plausible scenario is
thatpostindustrialsocietiesstillneedtomaintainandreplace
substantial iron stocks in use.
Severalindustrializedcountries,however,showclearsigns
of a flattening of their iron stocks at levels between 8 and 12
t/cap, which gives rise to an alternative hypothesis: that iron
stocks in use grow during industrialization, but saturate in
postindustrial societies. The saturation hypothesis is sup-
ported by the results found for the U.S., France, and the
U.K., while Japan shows signs of a flattening of per-capita
iron stocks during the past decade. However, Australia and
Canada have still growing per-capita iron stocks.
A more conclusive explanation of this behavior is not
possible on the basis of the highly aggregated data currently
available.However,itcanbehypothesizedthatthecontinuing
growth of iron stocks in Australia and Canada results from
the heavy dependence of their economies on the mining
sector. The strong growth in global minerals use over the
past years has led to substantial investments in iron-intensive
infrastructures and machinery for mining in these countries
(for example railways and harbors for ore transport or water
and electricity supply to remote mining sites). The growing
per-capitaironstocksinAustraliaandCanadamighttherefore
reflectaprolongedindustrializationprocessduetotheirfocus
on exploiting resources for export to emerging market
economies. Although the mining sector usually absorbs a
relatively small fraction of the total steel production, it might
be very large on a per-capita basis for countries with 2 orders
of magnitude smaller population than China or India
providing a large share of the giants’ resources. The hy-
pothesis that per-capita iron stocks in use relate to the degree
FIGURE 5. Density-equalizing maps of the iron stocks in 2005 in ore reserves (top) and in use (bottom). Country sizes are distorted in
proportion to their absolute iron stocks. Color scale indicates per capita iron stocks.
186 9 ENVIRONMENTAL SCIENCE & TECHNOLOGY / VOL. 45, NO. 1, 2011
6. of industrialization can therefore not be rejected on the basis
of the Australian and Canadian results.
The prospect of saturating iron stocks per person opens
upalternativemethodsforforecastingironandsteeldemand:
patternsofironstockdevelopmentinindustrializedcountries
can be used as benchmarks for emerging market economies.
Models that integrate stocks and flows have several advan-
tages compared to exclusively flow-based methods: (i) In-
use stocks reflect the ultimate demand for services more
adequately, while flows are necessary means to build up and
maintain service-providing stocks. (ii) Patterns of in-use
stocks are more robust than flows, which makes them more
robust for long-term forecasting, but also less accurate for
short-termprojections.(iii)Stockdynamicsallowsforamass-
balance-consistent explanation for material demand as well
as scrap generation from retiring products, which is not the
case for purely flow-based approaches. (iv) Flows are poor
indicators for saturation and its implications, because a
constant input flow over a longer time period is possible not
only for a saturation phase, but also for a growth phase, in
whichcasethereisnowayofanticipatingpotentialsaturation
levels or their timing. For example, the slack of iron and steel
demand during the 1970s and 1980s coincides with a period
inwhichseveralindustrializedcountriespassedtheinflection
point in their iron stock growth to slowly approach saturation
in the 1980s and 1990s. Saturation, or the passing of the
inflection point, can therefore be used as an alternative
explanation for the drop in steel demand in this period, a
phenomenon that might repeat itself in China.
The observed stock patterns demonstrate that the op-
portunities for recycling and therefore for reducing resource
depletion and GHG emissions change dramatically during
a country’s evolution. The potential for recycling domestic
scrap is very low in emerging market economies where stocks
aregrowingrapidly,whileindustrializedcountriescanbenefit
from stocks (and related investments in the form of energy
use and emissions) built up earlier. Importing scrap cannot
solve the problem because of the small potential compared
to the emerging markets’ resource demand (e.g., the U.S.
generates about 55 Mt/year of traded ferrous scrap (13), while
China produced 570 Mt of steel in 2009). The concept of a
circular economy remains an illusion for emerging market
economies.
In the long term, a saturation of iron stocks in use would
open the opportunity to completely change the steel
industry’s resource base. Assuming the global population
and its iron stock in use stabilize, the amount of iron units
exiting the use phase would be as large as the amount of iron
unitsenteringuse.Itisthereforepossibletoenvisionasystem
of iron and steel management that is entirely based on
secondary resources, using the built environment as the key
mine of the future. Such a scenario would not only avoid
primary resource exploitation and mining wastes (tailings),
but it would also significantly reduce energy consumption
and greenhouse gas emissions in the iron and steel industry,
mainly because the most energy- and CO2-intensive process,
the blast furnace, could be avoided. The stock dynamics
approach has therefore a large potential to improve the
development of models and scenarios for energy and climate
change.
Although a significant absolute dematerialization seems
unlikely for steel, it is not entirely unrealistic for iron ore.
Whether such a vision becomes feasible depends on two key
factors: the stock dynamics (including an economic scrap
recovery from retiring stocks in use) and the technical
challenges for recycling (e.g., scrap sorting and refining to
achieve high-quality steels from scrap).
Notwithstanding this vision, projections into the future
need to be carried out with caution. The saturation patterns
observed result from two overlapping factors: the demand
for service-providing stocks and their iron density. For
example, demand for cars can increase, while iron density
per car declines due to substitution of iron with aluminum,
plastic, or high-strength steels in engine blocks and frames.
The model applied here cannot decouple these two drivers.
More refined models using a combination of top-down and
bottom-up approaches are needed to analyze the relative
impacts of product stock demand and evolving technology
(15, 30).
Caution needs to be exercised also with extrapolations of
thefindingsforirontoothermaterials.Materialsplaydifferent
roles in the economy according to their specific properties,
abundances, and prices. Patterns of stock evolution observed
forironarestronglylinkedwithiron’sroleinindustrialization,
which is not necessarily the case for other materials.
Models of entire resource cycles are a first step not only
to put economic analysis on a mass-balance-consistent basis
(31), but also to include the use phase, which connects
demandforresourceswithgenerationofsecondaryresources,
and thereby allows for a consistent description of circular
economies. This broadening of the system boundaries is
essential to place long-term forecasts for primary and
secondary resource use on a more robust basis and thereby
provide improved guidance for industry and government
policy on resource management, energy, pollution control,
and international trade.
Acknowledgments
We thank Nalin Srivastava and Leon Dijk for their support
in data gathering, and Hans-Jörn Weddige, T.E. Graedel, R.
Lifset, Barbara Reck, Robert Gordon, and Stefan Pauliuk for
inspiring discussions and feedback on the manuscript.
Supported by NSF grant BES-0329470, the International Iron
and Steel Institute, and ArcelorMittal.
Supporting Information Available
Models and data used, in particular the impact of different
lifetime assumptions. This information is available free of
charge via the Internet at http://pubs.acs.org/.
Literature Cited
(1) Gordon, R. B.; Bertram, M.; Graedel, T. E. Metal stocks and
sustainability. Proc. Natl. Acad. Sci. U.S.A. 2006, 103 (5), 1209–
1214.
(2) OECD/IEA. Tracking industrial energy efficiency and CO2
emissions, June 2007; OECD Publishing: Paris, 2007; p 324.
(3) McMillan, C. A.; Keoleian, G. A. Not all primary aluminium is
created equal: Life cycle greenhouse gas emissions from 1990
to 2005. Environ. Sci. Technol. 2009, 43 (5), 1571–1577.
(4) IPCC.ClimateChange2007:Mitigation;ContributionofWorking
Group III to the Fourth Assessment Report of the Intergov-
ernmental Panel on Climate Change; Cambridge University
Press: Cambridge, 2007.
(5) Malenbaum, W. World Demand for Raw Materials in 1985 and
2000; McGraw-Hill: New York, 1978; p 126.
(6) Tilton, J. E. World Metal Demand. Trends and Prospects;
Resources For The Future: Washington, DC, 1990; p 368.
(7) Cleveland, C. J.; Ruth, M. Indicators of dematerialization and
the materials intensity of use. J. Ind. Ecol. 1999, 2 (3), 15–50.
(8) Dasgupta, S.; Laplante, B.; Wang, H.; Wheeler, D. Confronting
the Environmental Kuznets Curve. J. Econ. Perspect. 2002, 16
(1), 147–168.
(9) Stern, D. I. The rise and fall of the Environmental Kuznets Curve.
World Dev. 2004, 32 (8), 1419–1439.
(10) Ausubel, J. H.; Waggoner, P. E. Dematerialization: Variety,
caution, and persistence. Proc. Natl. Acad. Sci. U.S.A. 2008, 105
(35), 12774–12779.
(11) Kesler, S. Mineral Resources, Economics, and the Environment;
McMillan College Publishing: New York, 1994.
(12) Brown, H. The Challenge of Man’s Future, 1st ed.; The Vikings
Press: New York, 1954; p 290.
(13) Müller, D. B.; Wang, T.; Duval, B.; Graedel, T. E. Exploring the
engine of anthropogenic iron cycles. Proc. Natl. Acad. Sci. U.S.A.
2006, 103 (44), 16111–16116.
VOL. 45, NO. 1, 2011 / ENVIRONMENTAL SCIENCE & TECHNOLOGY 9 187
7. (14) Müller, D. B.; Bader, H.-P.; Baccini, P. Long-term Coordination
of Timber Production and Consumption Using a Dynamic
Material and Energy Flow Analysis. J. Ind. Ecol. 2004, 8 (3),
65–87.
(15) Müller, D. B. Stock dynamics for forecasting material flows -
Case study for housing in The Netherlands. Ecol. Econ. 2006,
59 (1), 142–156.
(16) Hu, M.; Bergsdal, H.; Van der Voet, E.; Huppes, G.; Müller, D. B.
Dynamics of urban and rural housing stocks in China. Building
Res. Inf. 2010, 38 (3), 301–317.
(17) Dargay, J.; Gately, D.; Sommer, M. Vehicle ownership and
income growth, worldwide: 1960-2030. Energy J. 2007, 28,
143–170.
(18) Hatayama, H.; Daigo, I.; Matsuno, Y.; Adachi, Y. Assessment of
the recycling potential of aluminum in Japan, the United States,
Europe and China. Mater. Trans. 2009, 50 (3), 650–656.
(19) Hatayama, H.; Daigo, I.; Matsuno, Y.; Adachi, Y. Outlook of the
World Steel Cycle Based on the Stock and Flow Dynamics.
Environ. Sci. Technol. 2010, 44 (16), 6457–6463.
(20) Müller, D. B.; Cao, J.; Kongar, E.; Altonji, M.; Weiner, P.-H.;
Graedel, T. E. Service Lifetimes of Mineral End Uses; USGS
Award 06HQGR0174; Yale University: New Haven. CT, 2007; p
31.
(21) Komatsu, Y.; Kato, Y.; Yoshida, T.; Yashiro, T. Report of an
investigation of the life time distribution of Japanese houses at
1987: Estimation based on the ledgers of buildings for fixed
property taxes. J. Archit. Plan. Environ. Eng., AIJ 1992, 439, 101–
110.
(22) Komatsu, Y.; Kato, Y.; Mituhashi, H. A research on the stock and
life time of office buildings in the 4 wards of Tokyo. J. Archit.
Plan. Environ. Eng., AIJ 1994, 465, 123–132.
(23) Igarashi, Y.; Kakiuchi, E.; Daigo, I.; Matsuno, Y.; Adachi, Y.
Estimation of steel consumption and obsolete scrap generation
in Japan and Asian countries in the future. ISIJ Int. 2008, 48 (5),
696–704.
(24) Maddison, A. The World Economy: Historical Statistics; Devel-
opment Centre of the Organisation for Economic Co-operation
and Development: Paris, France, 2003; p 273.
(25) Wang, T.; Müller, D. B.; Graedel, T. E. Iron capital formation in
China and India: Historic trends, outlook, and consequences.
Environ. Sci. Technol. Submitted.
(26) Saito, T. Recent techniques and regulations on seismic retrofit
and diagnosis for buildings in Japan. In Earthquake Hazard
and Seismic Risk Reduction; Balassanian, S., Cisternas, A.,
Melkumyan, M., Eds.; Kluwer Academic Publishers: Dordrecht,
Boston, London, 2000; pp 351-358.
(27) Hirato, T.; Daigo, I.; Matsuno, Y.; Adachi, Y. In-use stock of steel
estimated by top-down approach and bottom-up approach.
ISIJ Int. 2009, 49 (12), 1967–1971.
(28) U.S. Geological Survey. Mineral Commodity Summaries; U.S.
Department of the Interior; U.S. Government Printing Office:
Pittsburgh, PA, 2007.
(29) Tilton, J. E. Atrophy in metal demand. Earth Min. Sci. 1985, 54
(2), 15–18.
(30) Hu, M.; Pauliuk, S.; Wang, T.; Huppes, G.; van der Voet, E.;
Müller, D. B. Iron and steel in Chinese residential buildings: A
dynamic analysis. Resour., Conserv. Recycl. 2010, 54 (9), 591–
600.
(31) Ayres, R. U.; Kneese, A. Production, Consumption, and Exter-
nalities. Am. Econ. Rev. 1969, 59 (3), 282–297.
ES102273T
188 9 ENVIRONMENTAL SCIENCE & TECHNOLOGY / VOL. 45, NO. 1, 2011