This document summarizes a study examining the use of biodegradable nanoparticles loaded with TGF-β and IL-2 cytokines and targeted to CD4+ cells for inducing and maintaining regulatory T cells (Tregs). The nanoparticles were able to induce CD4+ Tregs in vitro and expand their numbers in vivo. Nanoparticle-induced Tregs demonstrated enhanced stability and retained their suppressive phenotype even in inflammatory conditions, highlighting the potential of this nanoparticle approach for stabilizing Tregs to treat autoimmune disease and inflammation.
![Paracrine co-delivery of TGF-b and IL-2 using CD4-targeted
nanoparticles for induction and maintenance of regulatory T cells
Michael D. McHugh a
, Jason Park a
, Ross Uhrich a
, Wenda Gao b
, David A. Horwitz c
,
Tarek M. Fahmy a, d, *
a
Department of Biomedical Engineering, Yale University, 55 Prospect Street, 415 Malone Engineering Center, New Haven, CT 06511, USA
b
Transplant Research Center, Beth Israel Hospital, Harvard Medical School, 77 Avenue Louis Pasteur, Boston, MA 02115, USA
c
Keck School of Medicine, University of Southern California, 2011 Zonal Ave, Los Angeles, CA 90089, USA
d
Department of Immunobiology, Yale University, 55 Prospect Street, 415 Malone Engineering Center, New Haven, CT 06511, USA
a r t i c l e i n f o
Article history:
Received 24 December 2014
Received in revised form
31 March 2015
Accepted 2 April 2015
Available online
Keywords:
Autoimmunity
Drug delivery
Immunomodulation
Nanoparticles
TGF-b
Interleukin-2
a b s t r a c t
The cytokine milieu is critical for orchestration of lineage development towards effector T cell (Teff) or
regulatory T cell (Treg) subsets implicated in the progression of cancer and autoimmune disease.
Importantly, the fitness and survival of the Treg subset is dependent on the cytokines Interleukin-2 (IL-2)
and transforming growth factor beta (TGF-b). The production of these cytokines is impaired in auto-
immunity increasing the probability of Treg conversion to aggressive effector cells in a proinflammatory
microenvironment. Therapy using soluble TGF-b and IL-2 administration is hindered by the cytokines'
toxic pleiotropic effects and hence bioavailability to CD4þ
T cell targets. Thus, there is a clear need for a
strategy that rectifies the cytokine milieu in autoimmunity and inflammation leading to enhanced Treg
stability, frequency and number. Here we show that inert biodegradable nanoparticles (NP) loaded with
TGF-b and IL-2 and targeted to CD4þ
cells can induce CD4þ
Tregs in-vitro and expand their number in-
vivo. The stability of induced Tregs with cytokine-loaded NP was enhanced leading to retention of their
suppressive phenotype even in the presence of proinflammatory cytokines. Our results highlight the
importance of a nanocarrier-based approach for stabilizing and expanding Tregs essential for cell-
immunotherapy of inflammation and autoimmune disease.
© 2015 Published by Elsevier Ltd.
1. Introduction
Tregs that express the Forkhead box protein transcription factor
(Foxp3) are a critical subset of CD4þ
T cells that maintain homeo-
stasis during infection and tolerance toward self-epitopes [1e3].
Mutations in Foxp3 can lead to the wasting multi-organ autoim-
mune condition, IPEX (immune-dysregulation, poly-
endocrinopathy, enteropathy, X-linked) in humans [4]. In many
common autoimmune diseases such as multiple sclerosis and type
1 diabetes [5,6], Tregs are unable to control pathogenic CD4þ
and
CD8þ
effector cells because of defects related to their numbers or
function [7e11]. For this reason, strategies to correct these defects
and boost their stability have been garnering attention as potential
alternatives to the conventional broadly immunosuppressive
agents currently in use [12].
Foxp3þ
Tregs are now classified as one of three subsets [13]. The
majority of endogenous Tregs are derived from the thymus and
called natural Tregs (nTregs) [1]. These nTregs characteristically
display chromatin demethylation at the Foxp3 locus [14,15]. Pe-
ripheral Tregs (pTregs) can also be peripherally differentiated from
naïve T cells. Similarly, inducible Tregs (iTregs) can be generated
from naïve CD4þ
cells ex-vivo by suboptimal TCR signaling in the
presence of IL-2 and TGF-b [16e18]. Importantly, recent studies
comparing the stability of mouse and human nTregs and iTregs in
an inflammatory microenvironment have revealed that only iTregs
remain Foxp3þ
and can reverse established disease [19e21]. These
findings are supported by the recent report that Tregs induced in-
vivo can also reverse disease in animal models of multiple sclerosis
and autoimmune diabetes [22]. However, the methods used to
induce these protective iTregs are translationally challenging
Abbreviations: CD, cluster of differentiation; DMSO, dimethylsulfoxide; ELISA,
enzyme-linked immunosorbent assay; FACS, fluorescent activated cell sorting; FBS,
fetal bovine serum; GFP, green fluorescent protein; HCl, hydrochloric acid; mTOR,
mammalian target of rapamycin; NaCl, sodium chloride; PE, phycoerythrin; PFA,
paraformaldehyde; TCR, T cell receptor.
* Corresponding author. Department of Immunobiology, Yale University, 55
Prospect Street, 415 Malone Engineering Center, New Haven, CT 06511, USA.
Contents lists available at ScienceDirect
Biomaterials
journal homepage: www.elsevier.com/locate/biomaterials
http://dx.doi.org/10.1016/j.biomaterials.2015.04.003
0142-9612/© 2015 Published by Elsevier Ltd.
Biomaterials 59 (2015) 172e181](https://image.slidesharecdn.com/5375e588-81bb-49be-ba0b-0b9181b88a11-150519214403-lva1-app6891/85/Paracrine-TGF_IL2-paper-1-320.jpg)
![because of the toxicity associated with delivery of pleiotropic cy-
tokines. By designing a system able to safely provide TGF-b and IL-2
needed for stable Tregs [23,24], we aimed to generate a functionally
robust inducible CD4 Treg population in-vivo.
Prior studies have utilized nanoparticles to deliver bioactive
agents to modulate T cell activation through surface-binding
[25e27], but use of these systems to support Foxp3þ
Treg function
remains largely unexplored. Therefore, we chose to use nano-
particles composed of poly(lactic-co-glycolic) acid (PLGA), which
have been used extensively for the controlled delivery of various
proteins to many cell types [28e30]. Given the clear goal here,
directed delivery of pleiotropic cytokines to CD4þ
T cells, and its
clinical implication for autoimmune treatment, we chose to use the
simplest and most ubiquitous nanocarrier delivery system. PLGA
degradation and subsequent release of embedded agents is well
understood. It is an FDA approved polymer that degrades via hy-
drolysis, and release of encapsulated proteins can be programmed
over the course of several days to weeks depending on the
composition of the polymer matrix [31]. For example, artificial
antigen-presentation systems using PLGA particles loaded with IL-
2 enhance CD8 T cell proliferation and function due to local accu-
mulation of cytokines at the interface between particles and cells
[32,33]. PLGA micro- and nanoparticles surface-conjugated with
antibodies have been shown to facilitate attachment to different
specific cell types [26,34,35]. Given the platform's capacity to
generate and maintain tunable cytokine conditions at a target cell
surface, we therefore explored its potential for Treg induction by
delivery of TGF-b and IL-2 to CD4þ
T cells. In this study, we char-
acterized the CD4 cell-binding capacity of the particles and their
ability to generate Tregs in-vitro and in-vivo. Furthermore we show
that nanoparticle-induced Tregs are more efficacious in both their
suppressive function and phenotypic stability in comparison to
conventionally induced Tregs.
2. Materials and methods
2.1. Nanoparticle synthesis
Human recombinant TGF-b1 (mammalian-derived, Peprotech,
Rocky Hill, NJ) and human recombinant IL-2 (Proleukin) was
encapsulated in avidin-coated PLGA nanoparticles using a water/
oil/water emulsion technique as previously described [36]. Briefly,
2.5 mg of aqueous cytokine solution was added drop-wise while
vortexing to 50 mg PLGA (50:50 monomer ratio, Durect Corp) in
3 mls chloroform. The resulting emulsion was added dropwise to
3 mls of water containing 3% poly-vinyl alcohol (SigmaeAldrich)
and 0.625 mg/ml avidinepalmitate conjugate (previously described
elsewhere [36]). This double emulsion was then sonicated to create
nano-sized droplets of chloroform containing encapsulated cyto-
kine, within aqueous surfactant. Solvent was removed by magnetic
stirring at room temperature for 3 h. Hardened nanoparticles were
then washed 3 times in MilliQ water and lyophilized for long-term
storage. Nanoparticles were prepared fresh from lyophilized stocks
for each experiment. Briefly, nanoparticles were dispersed in PBS at
10 mg/ml by vortexing and 2e3 s of bath sonication. CD4-targeted
nanoparticles were formed by reacting avidin-coated nanoparticles
in PBS with 2 mg biotin-anti-CD4 (RM 4-5, eBiosciences) per mg NP
for 15 min and used immediately.
2.2. Characterization of nanoparticle size and morphology
Nanoparticle morphology was analyzed via scanning electron
microscopy (SEM). Samples were sputter-coated with gold using a
Dynavac Mini Coater and imaged with a Hitachi SU-70 SEM with an
accelerating voltage of 5 kV. Particle size was quantified using the
Nanosight particle tracking system (NanoSight, Ltd., Wiltshire, UK).
Cytokine release was measured by incubating 1.0 mg nanoparticles
in 1 ml PBS at 37 C and measuring cytokine concentration in su-
pernatant fractions over time by ELISA.
2.3. Imaging of T cell-NP interactions
10 mg of DiR-encapsulating nanoparticles conjugated to CD4 or
isotype antibodies was added to C57BL/6 splenocytes (1.0 Â 106
/ml)
and tumbled for 15 min at 37 C in 1.5 ml microcentrifuge tubes.
Cells were then stained for CD4-PE and analyzed using an Amnis
Imagestream instrument.
2.4. Cell culture
All cell culture was performed at 37 C, 5.0% CO2, 100% humidity
in RPMI-1640 (Life Technologies) supplemented with 10% FBS
(Atlanta Biologics), Pen/Strep, L-glutamine, MEM Vitamin solution,
non-essential amino acids, sodium pyruvate, and beta-
mercaptoethanol (Life Technologies).
2.5. Functional characterization of nano-encapsulated IL-2
CRL-1841 cells (ATCC, Manassas, VA) were seeded at 5.0 Â 104
cells per well of a 96-well plate and dosed with free IL-2 or IL-2
encapsulated in untargeted nanoparticles. Fold proliferation was
quantified by Coulter Counter after 4 days of culture.
2.6. Animals
C57BL/6 and BALB/c mice were purchased from Jackson Labs
and Harlan, respectively, for use at 6e12 weeks of age. Mice
expressing GFP as a reporter of Foxp3 expression (GFP-Foxp3 re-
porter mice) were generated on a C57BL/6 background as previ-
ously described [37]. All animal work was performed under
protocols approved by the Yale Institute of Animal Care and Use
Committee.
2.7. Staining, FACS, and cytokine secretion analysis
Cells were stained with CellTrace Violet (Life Technologies)
following the manufacturers suggested protocol. After red blood
cell lysis, splenocyte pellets were resuspended in 10 mM solution of
CellTrace Violet in DPBS and incubated for 15 min at 37 C. The
reaction was then quenched using 5Â volume of RPMIþ10% FBS,
and cells were pelleted once more to wash away free CellTrace
Violet dye. For the Treg suppressor assay (Fig. 4), responder cells
were labeled with CellTrace Violet after FACS purification and
plated immediately.
Fluorescent antibodies were purchased from eBiosciences and
used in dilutions of 1:200 or 1:400 in FACS buffer (PBS containing
2% FBS) for surface staining. CD4 was detected using clone RM 4-4
to avoid competitive binding with nanoparticle-conjugated RM 4-5.
Cells were incubated with antibodies for 20e30 min and washed
once in FACS buffer. For experiments requiring Foxp3 staining,
samples were treated with 250 ul of Fix/Perm buffer (Intracellular
Fixation and Permeabilization Kit, eBiosciences) after washing off
surface antibodies. After 30e60 min, samples were washed with
2.0 mls Perm buffer and incubated with Foxp3 antibody (clone FJK-
16s, eBioscience) for 30e60 min. Cells were then washed with
2.0 mls Perm buffer. After staining, cells were suspended in 1% PFA
until FACS analysis up to 24 h later. All incubations in the immu-
nostaining procedures were carried out in the dark on ice.
FACS analysis was performed on either a FACScan or LSR-II
(Becton Dickinson), and sorting was done on a FACSAria (Becton
M.D. McHugh et al. / Biomaterials 59 (2015) 172e181 173](https://image.slidesharecdn.com/5375e588-81bb-49be-ba0b-0b9181b88a11-150519214403-lva1-app6891/85/Paracrine-TGF_IL2-paper-2-320.jpg)
![responder cells. Total number of cells was calculated by gating on
each generation and accounting for number of divisions, using an
area under the curve summation formula previously reported [38]
and defined in Table 2. Initial Treg frequency, or the percentage of
Thy1.1À
Foxp3þ
Tregs in culture at the start of the suppression phase
is defined in Table 2.
2.10. In-vivo biodistribution and Treg quantification
6e8 week old female C57/Bl6 mice received coumarin-6 loaded
nanoparticles via intraperitoneal injection on day 0. On day 5, mice
were sacrificed and secondary lymphoid tissues were collected,
including the spleen, axial lymph nodes (aLN), mesenteric lymph
nodes (mLN), and inguinal lymph nodes (iLN). For analysis of
coumarin-6 loaded nanoparticle biodistribution, whole spleen or
lymph samples were homogenized and subjected to 3 freeze/thaw
cycles prior to lyophilization. Coumarin 6 was extracted by
incubation of homogenized tissues in DMSO and quantified using
standards generated in tissues from untreated mice, by fluores-
cence with excitation/emission at 460/540 nm.
For Treg quantification, tissues were processed and stained for
CD4, CD25, and Foxp3 as previously described and analyzed by
FACS. Cells were counted using a Coulter Counter.
3. Results
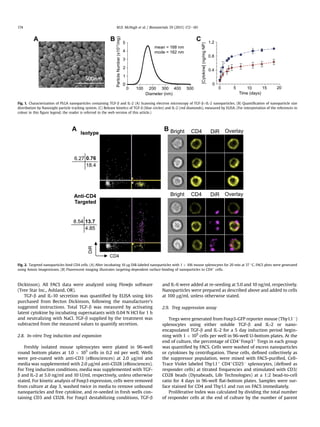
3.1. Nanoparticle fabrication and characterization
PLGA nanoparticles encapsulating TGF-b and IL-2 were visual-
ized using scanning electron microscopy (SEM, Fig. 1A). Nano-
particles are spherical in morphology and range in size from less
than 100 nme300 nm. Quantitative size analysis was performed
using the Nanosight®
particle tracking system, which confirmed
the size distribution and revealed a mean particle size of 168 nm
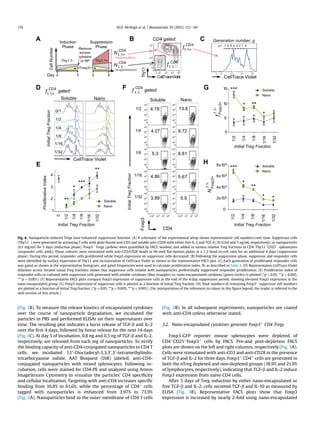
Fig. 3. Nano-encapsulated cytokines generate Foxp3þ
CD4 Tregs. (A) Naïve or nTreg-depleted splenocytes were incubated with 5 ng/ml TGF-b and 50 U/ml IL-2 for 4 days and
resulting Treg induction was analyzed by FACS. (B) In a separate experiment, mixed splenocytes were cultured with TGF-b and IL-2 in soluble (5 ng/ml and 10 U/ml, respectively) or
nano-encapsulated form (0.1 mg nanoparticle/ml) to induce CD25þ
Foxp3þ
Tregs. TGF-b and IL-10 concentrations in the supernatant were measure by ELISA. (C) Representative FACS
plots showing Foxp3 induction are gated on CD4þ
lymphocytes. (D) Results from 4 independent experiments are plotted (***P 0.001). (E) Dose responses of nano-encapsulated
(green), and soluble (blue) cytokine. Values are percentages of CD4þ
lymphocytes. (F) IL-2 dependent CTRL-1842 cells were dosed with nano-encapsulated vs. free IL-2 and
proliferation was quantified after 4 days by Coulter Counter. (For interpretation of the references to colour in this figure legend, the reader is referred to the web version of this
article.)
M.D. McHugh et al. / Biomaterials 59 (2015) 172e181 175](https://image.slidesharecdn.com/5375e588-81bb-49be-ba0b-0b9181b88a11-150519214403-lva1-app6891/85/Paracrine-TGF_IL2-paper-4-320.jpg)
![nanoparticles. Mice received a dose of 2.0 mgs of nanoparticles
administered via intraperitoneal injection. After 5 days, animals
were sacrificed and secondary lymphoid organs were collected for
analysis. Extraction of C6 from the tissues showed the highest
accumulation in the spleen and draining (mesenteric) lymph nodes
(Fig. 6A). To assess the ability of nanoparticles to expand Tregs in-
vivo, mice were injected with 2.0 mg CD4-targeted nanoparticles.
After 5 days, lymph nodes were collected and Treg induction was
assessed by FACS. In comparison to naïve animals (black),
nanoparticle-treated animals (pink) had a significantly higher fre-
quency of Tregs in the mesenteric lymph node and spleen as
measured by their frequency within the CD4 T cell compartment
(Fig. 6B) (n ¼ 5 mice, *p 0.05). Total numbers of Tregs were not
significantly enhanced (Fig. 6C). Representative FACS plots are
gated on CD4þ
lymphocytes and identify CD25þ
Foxp3þ
Tregs for
each tissue analyzed (Fig. 6D). Values on the lower left of the gate
show Tregs as a percentage of CD4þ
cells and represent data in
Fig. 6B, whereas values to the right show Tregs as a percentage of all
lymphocytes, used to calculate absolute numbers plotted in Fig. 6C.
4. Discussion
Cytokine and cell-based immunotherapies have promising
therapeutic in the treatment of both pathologic tolerance and im-
munity, but there are significant obstacles to overcome. Foxp3þ
Tregs in clinical trials for certain chronic immune-mediated in-
flammatory diseases [39,40] must be expanded from very small
numbers. Because of their rapid turnover, they will need help for
long-term maintenance in-vivo. Moreover, these Tregs can become
unstable and even autoaggressive in the inflammatory environ-
ment characteristic of these diseases [41].
Low-dose recombinant IL-2 can reverse type 1 diabetes in NOD
mice [42] and has achieved clinical benefit in a small number of
patients with graft-versus-host disease or vasculitis [43,44]. How-
ever, IL-2 has a short half-life in circulation, requiring frequent
doses to maintain its affect while minimizing off-target signaling
[45].
In this manuscript, we have shown that directed delivery of the
cytokines TGF-b and IL-2 via nanocarriers can enhance the gener-
ation of stable, functional Tregs. This strategy therefore offers a new
approach to directly improve the efficacy of clinically-relevant cell-
based therapies. Nanoparticles loaded with an optimized ratio (1:2)
of IL-2:TGF-b targeted to CD4 cells signal cooperatively at the cell
surface. TGF-b, a regulatory cytokine widely recognized as a Treg
inducer, is commonly used in conjunction with IL-2 to generate CD4
Tregs in-vitro [46e48]. The efficiency of Treg induction after
incubation with TGF-b and IL-2 was maintained after prior deple-
tion of nTregs, showing that the cytokine combination can induce
the differentiation of naïve Foxp3À
CD4 T cells. Sustained release of
both cytokines was comparable due to physiochemical similarities
between both proteins. Both cytokines have individually been
encapsulated in PLGA matrices previously [30,32], but they have
not been co-encapsulated in the same particle. To verify preserva-
tion of each cytokine's structure following PLGA encapsulation and
particle synthesis, we assayed for bioactivity during particle-
mediated release. Interestingly, encapsulated cytokines displayed
greater bioactivity compared to soluble counterparts. Enhanced
bioactivity may be due to increased local concentration gradients,
and this has been previously observed with encapsulated IL-2 [32].
Strikingly, with encapsulated TGF-b, not only was the signaling
threshold reduced, but the Foxp3 induction plateau was increased,
highlighting the impact of high local concentration gradients. Thus,
the nanoparticle-mediated paracrine-delivery of IL-2 and TGF-b
may be more effective at driving naïve CD4 cells to become Tregs.
Although this phenomenon has yet to be investigated, mathemat-
ical modeling of paracrine signaling reveals that diffusive cytokine
transfer may trigger unexpected signaling outcomes through
reorganization of membrane receptors [49]. TGF-b signaling re-
quires surface dimerization of two receptor subunits [50e52],
which may partially depend on this paracrine affect, leading to the
observed enhancement by nanoparticle-mediated delivery.
In addition to more efficient generation of Foxp3þ
Tregs, we
demonstrate here that nanoparticles induce Tregs that are more
effective suppressors on a per cell basis. When Foxp3þ
Treg cell
numbers were matched between soluble cytokine-induced sup-
pressors and nanoparticle-generated suppressors, nanoparticle-
induced suppressors showed superior ability to inhibit CD4
effector proliferation in response to TCR ligation and co-stimula-
tion. This effect was retained down to 1/32 initial Treg fraction, and
verified that nanoparticle binding to the Treg cell surface had no
detrimental impact on their functional capacity, but facilitated
enhanced function. In these experiments, nanoparticle-induced
suppressor cells retained Foxp3 expression to a greater extent
than soluble cytokine-induced suppressor cells, which showed no
correlation between initial Treg fraction and final Foxp3 expression.
This observation supports the hypothesis that nanoparticle-
mediated delivery of TGF-b and IL-2 markedly reduces the loss of
Foxp3 expression over time.
Results of our Foxp3 kinetic assays suggest that nanoparticle-
mediated delivery of TGF-b and IL-2 may also help overcome T
cell plasticity in the context of inflammation and typically observed
with Treg cell therapy. Although adoptive transfer of ex-vivo
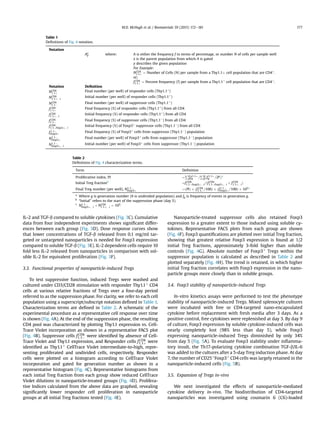
Fig. 5. Nano-encapsulated cytokines enhance Treg stability. (A) Mixed splenocytes were treated with soluble (blue triangles) or nano-encapsulated (green circles) TGF-b and IL-2 for
a 3 day induction phased before washing the cells and replating, and Foxp3 expression was monitored over time. Control cells (black circles) were replenished with soluble cytokine
after washing. (*p 0.05 between nano-encapsulated and soluble using a 2-tailed T test on day 9 Foxp3 expression). (B) After a 5 day induction phase, cells were washed and re-
seeded in the presence of TGF-b (5 nm/ml) and IL-6 (10 ng/ml) for Th17 polarization. FACS plots show CD4 phenotype at day 7. (For interpretation of the references to colour in this
figure legend, the reader is referred to the web version of this article.)
M.D. McHugh et al. / Biomaterials 59 (2015) 172e181178](https://image.slidesharecdn.com/5375e588-81bb-49be-ba0b-0b9181b88a11-150519214403-lva1-app6891/85/Paracrine-TGF_IL2-paper-7-320.jpg)
![induced Tregs are effective at treating diabetes in NOD mice, a
growing body of work suggests that some of these cells can turn off
Foxp3 expression and even revert to an effector phenotype within
inflammatory environments [53,54]. Nanoparticle delivery can
maintain local cytokine availability to targeted cells even within
polarizing microenvironments, which is useful for maintenance of
Foxp3 expression in the absence of endogenous regulatory factors.
IP administration of nanoparticles can lead to accumulation in
secondary lymphoid tissues such as the spleen, facilitating a
localized cytokine milieu critical for T cell differentiation [55e57].
Here, systemic administration of CD4-targeted TGF-bþIL-2 nano-
particles significantly enhanced Treg frequency in these tissues as a
percentage of CD4 cells. However, statistical significance was not
achieved when measuring the absolute number of Tregs. This
suggests the possibility of off-target cytokine effects, but the in-
crease of Foxp3þ cells of the CD4 compartment is nonetheless
functionally relevant. The lesser efficacy in-vivo in comparison to
in-vitro was likely due to nonspecific uptake by phagocytic cells in
these tissues [57], decreasing the availability of encapsulated cy-
tokines for developing T cells. Particles engineered to minimize
phagocytic uptake is a possible venue for future studies. Alterna-
tively, particles directed to dendritic cells and loaded with tolero-
genic peptides or tolerogenic agents can facilitate expansion of
Tregs. Recent work has demonstrated the promise of this approach
[58]. Ultimately a combination of both strategies maybe an optimal
solution to the challenging problem of induction and expansion of
therapeutic autoantigen-specific Tregs in-vivo.
5. Conclusions
By efficiently delivering both TGF-b and IL-2 to CD4 T cells, this
platform circumvents several fundamental drawbacks of today's
leading autoimmune therapies. Paracrine cytokine delivery signif-
icantly increased Treg induction, enhanced suppressive function,
and Foxp3 expression was stable even in depolarizing conditions.
Future studies will establish the optimal composition of loaded
cytokines, frequency of injections, and possible synergistic effects
with other targeted nanoparticles in a strategy to induce remission
of various autoimmune diseases.
Footnotes
M.D.M. designed research, performed experiments, analyzed
data, and wrote paper. J.P. designed and performed experiments
and analyzed data. R.U. performed experiments. W.G. supplied
Fig. 6. Nanoparticles enhance Tregs in-vivo. (A) 2.0 mg coumarin-6 labeled nanoparticles were injected I.P. and tissues were harvested after 5 days. Coumarin-6 was measured by
fluorescence microscopy. (BeD) 2.0 mg TGF-b IL-2 CD4-targeted nanoparticles were injected I.P. and mice were sacrificed after 5 days for FACS analysis. (B) Tregs are plotted as
percentages of CD4þ
T cells (*p 0.05 vs. untreated controls). (C) Treg numbers per tissue are plotted. (D) Representative FACS plots are gated on CD4þ
lymphocytes. Values on the
lower left of the gate show Tregs as a percentage of CD4þ
cells. Values to the right show Tregs as a percentage of all lymphocytes.
M.D. McHugh et al. / Biomaterials 59 (2015) 172e181 179](https://image.slidesharecdn.com/5375e588-81bb-49be-ba0b-0b9181b88a11-150519214403-lva1-app6891/85/Paracrine-TGF_IL2-paper-8-320.jpg)
![reagents. D.H. designed experiments. T.M.F. designed research and
wrote paper.
Acknowledgments
We thank Kevan Herold and Richard Flavell for intellectual
input. This work was also supported in part by NIH Autoimmunity
Center of Excellent Pilot Award U19 AI056363. It was also sup-
ported in part by a Pfizer Grant to T.M.F. We thank Dr. Micah Ben-
son, John Douhan and Dr. Karim Dabbagh for intellectual input and
discussion regarding this study.
References
[1] Sakaguchi S, Yamaguchi T, Nomura T, Ono M. Regulatory T cells and immune
tolerance. Cell 2008;133(5):775e87.
[2] Chaudhry A, Rudensky AY. Control of inflammation by integration of envi-
ronmental cues by regulatory T cells. J Clin Invest 2013;123(3):939e44.
[3] Maloy KJ, Powrie F. Regulatory T cells in the control of immune pathology. Nat
Immunol 2001;2(9):816e22.
[4] Wildin RS, Ramsdell F, Peake J, Faravelli F, Casanova JL, Buist N, et al. X-linked
neonatal diabetes mellitus, enteropathy and endocrinopathy syndrome is the
human equivalent of mouse scurfy. Nat Genet 2001;27(1):18e20.
[5] Roep BO, Peakman M. Antigen targets of type 1 diabetes autoimmunity. Cold
Spring Harb Perspect Med 2012;2(4). a007781.
[6] Jager A, Dardalhon V, Sobel RA, Bettelli E, Kuchroo VK. Th1, Th17, and Th9
effector cells induce experimental autoimmune encephalomyelitis with
different pathological phenotypes. J Immunol 2009;183(11):7169e77.
[7] Cao D, Malmstrom V, Baecher-Allan C, Hafler D, Klareskog L, Trollmo C.
Isolation and functional characterization of regulatory CD25brightCD4þ T
cells from the target organ of patients with rheumatoid arthritis. Eur J
Immunol 2003;33(1):215e23.
[8] Viglietta V, Baecher-Allan C, Weiner HL, Hafler DA. Loss of functional sup-
pression by CD4þCD25þ regulatory T cells in patients with multiple sclerosis.
J Exp Med 2004;199(7):971e9.
[9] Sugiyama H, Gyulai R, Toichi E, Garaczi E, Shimada S, Stevens SR, et al.
Dysfunctional blood and target tissue CD4þCD25high regulatory T cells in
psoriasis: mechanism underlying unrestrained pathogenic effector T cell
proliferation. J Immunol 2005;174(1):164e73.
[10] Lindley S, Dayan CM, Bishop A, Roep BO, Peakman M, Tree TI. Defective
suppressor function in CD4(þ)CD25(þ) T-cells from patients with type 1
diabetes. Diabetes 2005;54(1):92e9.
[11] Balandina A, Saoudi A, Dartevelle P, Berrih-Aknin S. Analysis of CD4þCD25þ
cell population in the thymus from myasthenia gravis patients. Ann N Y Acad
Sci 2003;998:275e7.
[12] Zhou X, Kong N, Zou H, Brand D, Li X, Liu Z, et al. Therapeutic potential of TGF-
beta-induced CD4(þ) Foxp3(þ) regulatory T cells in autoimmune diseases.
Autoimmunity 2011;44(1):43e50.
[13] Abbas AK, Benoist C, Bluestone JA, Campbell DJ, Ghosh S, Hori S, et al. Regu-
latory T cells: recommendations to simplify the nomenclature. Nat Immunol
2013;14(4):307e8.
[14] Sakaguchi S, Sakaguchi N, Shimizu J, Yamazaki S, Sakihama T, Itoh M, et al.
Immunologic tolerance maintained by CD25þ CD4þ regulatory T cells: their
common role in controlling autoimmunity, tumor immunity, and trans-
plantation tolerance. Immunol Rev 2001;182:18e32.
[15] Floess S, Freyer J, Siewert C, Baron U, Olek S, Polansky J, et al. Epigenetic
control of the foxp3 locus in regulatory T cells. PLoS Biol 2007;5(2):e38.
[16] Chen Y, Kuchroo VK, Inobe J, Hafler DA, Weiner HL. Regulatory T cell clones
induced by oral tolerance: suppression of autoimmune encephalomyelitis.
Science 1994;265(5176):1237e40.
[17] Nakamura K, Kitani A, Strober W. Cell contact-dependent immunosuppression
by CD4(þ)CD25(þ) regulatory T cells is mediated by cell surface-bound
transforming growth factor beta. J Exp Med 2001;194(5):629e44.
[18] Kingsley CI, Karim M, Bushell AR, Wood KJ. CD25þCD4þ regulatory T cells
prevent graft rejection: CTLA-4- and IL-10-dependent immunoregulation of
alloresponses. J Immunol 2002;168(3):1080e6.
[19] Lu L, Wang J, Zhang F, Chai Y, Brand D, Wang X, et al. Role of SMAD and non-
SMAD signals in the development of Th17 and regulatory T cells. J Immunol
2010;184(8):4295e306.
[20] Zheng SG, Wang J, Horwitz DA. Cutting edge: foxp3þCD4þCD25þ regulatory
T cells induced by IL-2 and TGF-beta are resistant to Th17 conversion by IL-6.
J Immunol 2008;180(11):7112e6.
[21] Kong N, Lan Q, Chen M, Wang J, Shi W, Horwitz DA, et al. Antigen-specific
transforming growth factor beta-induced Treg cells, but not natural Treg cells,
ameliorate autoimmune arthritis in mice by shifting the Th17/Treg cell bal-
ance from Th17 predominance to Treg cell predominance. Arthritis Rheum
2012;64(8):2548e58.
[22] Kasagi S, Zhang P, Che L, Abbatiello B, Maruyama T, Nakatsukasa H, et al.
In vivo-generated antigen-specific regulatory T cells treat autoimmunity
without compromising antibacterial immune response. Sci Transl Med
2014;6(241). 241ra78.
[23] Fontenot JD, Rasmussen JP, Gavin MA, Rudensky AY. A function for interleukin
2 in Foxp3-expressing regulatory T cells. Nat Immunol 2005;6(11):1142e51.
[24] Li MO, Wan YY, Flavell RA. T cell-produced transforming growth factor-beta1
controls T cell tolerance and regulates Th1- and Th17-cell differentiation.
Immunity 2007;26(5):579e91.
[25] Fahmy TM, Schneck JP, Saltzman WM. A nanoscopic multivalent antigen-
presenting carrier for sensitive detection and drug delivery to T cells.
Nanomed Nanotechnol Biol Med 2007;3(1):75e85.
[26] Park J, Gao W, Whiston R, Strom TB, Metcalfe S, Fahmy TM. Modulation of
CD4þ T lymphocyte lineage outcomes with targeted, nanoparticle-mediated
cytokine delivery. Mol Pharm 2011;8(1):143e52.
[27] Stephan MT, Moon JJ, Um SH, Bershteyn A, Irvine DJ. Therapeutic cell engi-
neering with surface-conjugated synthetic nanoparticles. Nat Med
2010;16(9):1035e41.
[28] Mundargi RC, Babu VR, Rangaswamy V, Patel P, Aminabhavi TM. Nano/micro
technologies for delivering macromolecular therapeutics using poly(D,L-
lactide-co-glycolide) and its derivatives. J Control Release: Off J Control
Release Soc 2008;125(3):193e209.
[29] Demento SL, Cui W, Criscione JM, Stern E, Tulipan J, Kaech SM, et al. Role of
sustained antigen release from nanoparticle vaccines in shaping the T cell
memory phenotype. Biomaterials 2012;33(19):4957e64.
[30] Jhunjhunwala S, Balmert SC, Raimondi G, Dons E, Nichols EE, Thomson AW,
et al. Controlled release formulations of IL-2, TGF-beta1 and rapamycin for the
induction of regulatory T cells. J Control Release: Off J Control Release Soc
2012;159(1):78e84.
[31] Mahapatro A, Singh DK. Biodegradable nanoparticles are excellent vehicle for
site directed in-vivo delivery of drugs and vaccines. J Nanobiotechnol 2011;9:
55.
[32] Steenblock ER, Fadel T, Labowsky M, Pober JS, Fahmy TM. An artificial antigen-
presenting cell with paracrine delivery of IL-2 impacts the magnitude and
direction of the T cell response. J Biol Chem 2011;286(40):34883e92.
[33] Steenblock ER, Fahmy TM. A comprehensive platform for ex vivo T-cell
expansion based on biodegradable polymeric artificial antigen-presenting
cells. Mol Ther: J Am Soc Gene Ther 2008;16(4):765e72.
[34] Keegan ME, Royce SM, Fahmy T, Saltzman WM. In vitro evaluation of biode-
gradable microspheres with surface-bound ligands. J Control Release: Off J
Control Release Soc 2006;110(3):574e80.
[35] Park J, Mattessich T, Jay SM, Agawu A, Saltzman WM, Fahmy TM. Enhance-
ment of surface ligand display on PLGA nanoparticles with amphiphilic ligand
conjugates. J Control Release: Off J Control Release Soc 2011;156(1):109e15.
[36] Fahmy TM, Samstein RM, Harness CC, Mark Saltzman W. Surface modification
of biodegradable polyesters with fatty acid conjugates for improved drug
targeting. Biomaterials 2005;26(28):5727e36.
[37] Bettelli E, Carrier Y, Gao W, Korn T, Strom TB, Oukka M, et al. Reciprocal
developmental pathways for the generation of pathogenic effector TH17 and
regulatory T cells. Nature 2006;441(7090):235e8.
[38] Roederer M. Interpretation of cellular proliferation data: avoid the
panglossian. Cytometry Part A: J Int Soc Anal Cytol 2011;79(2):95e101.
[39] Brunstein CG, Miller JS, Cao Q, McKenna DH, Hippen KL, Curtsinger J, et al.
Infusion of ex vivo expanded T regulatory cells in adults transplanted with
umbilical cord blood: safety profile and detection kinetics. Blood 2011;117(3):
1061e70.
[40] Marek-Trzonkowska N, Mysliwiec M, Dobyszuk A, Grabowska M,
Derkowska I, Juscinska J, et al. Therapy of type 1 diabetes with CD4(þ)
CD25(high)CD127-regulatory T cells prolongs survival of pancreatic islets e
results of one year follow-up. Clin Immunol 2014;153(1):23e30.
[41] Riley JL, June CH, Blazar BR. Human T regulatory cell therapy: take a billion or
so and call me in the morning. Immunity 2009;30(5):656e65.
[42] Grinberg-Bleyer Y, Baeyens A, You S, Elhage R, Fourcade G, Gregoire S, et al. IL-
2 reverses established type 1 diabetes in NOD mice by a local effect on
pancreatic regulatory T cells. J Exp Med 2010;207(9):1871e8.
[43] Koreth J, Matsuoka K, Kim HT, McDonough SM, Bindra B, Alyea 3rd EP, et al.
Interleukin-2 and regulatory T cells in graft-versus-host disease. N Engl J Med
2011;365(22):2055e66.
[44] Saadoun D, Rosenzwajg M, Joly F, Six A, Carrat F, Thibault V, et al. Regulatory
T-cell responses to low-dose interleukin-2 in HCV-induced vasculitis. N Engl J
Med 2011;365(22):2067e77.
[45] Long SA, Buckner JH, Greenbaum CJ. IL-2 therapy in type 1 diabetes: “Trials”
tribulations. Clin Immunol 2013;149(3):324e31.
[46] Fantini MC, Becker C, Tubbe I, Nikolaev A, Lehr HA, Galle P, et al. Transforming
growth factor beta induced FoxP3þ regulatory T cells suppress Th1 mediated
experimental colitis. Gut 2006;55(5):671e80.
[47] Chen W, Jin W, Hardegen N, Lei KJ, Li L, Marinos N, et al. Conversion of pe-
ripheral CD4þCD25- naive T cells to CD4þCD25þ regulatory T cells by TGF-
beta induction of transcription factor Foxp3. J Exp Med 2003;198(12):
1875e86.
[48] Fantini MC, Dominitzki S, Rizzo A, Neurath MF, Becker C. In vitro generation of
CD4þ CD25þ regulatory cells from murine naive T cells. Nat Protoc 2007;2(7):
1789e94.
[49] Labowsky M, Fahmy TM. Diffusive transfer between two intensely interacting
cells with limited surface kinetics. Chem Eng Sci 2012;74:114e23.
[50] Wrana JL, Attisano L, Wieser R, Ventura F, Massague J. Mechanism of activa-
tion of the TGF-beta receptor. Nature 1994;370(6488):341e7.
M.D. McHugh et al. / Biomaterials 59 (2015) 172e181180](https://image.slidesharecdn.com/5375e588-81bb-49be-ba0b-0b9181b88a11-150519214403-lva1-app6891/85/Paracrine-TGF_IL2-paper-9-320.jpg)
![[51] Moustakas A, Lin HY, Henis YI, Plamondon J, O'Connor-McCourt MD,
Lodish HF. The transforming growth factor beta receptors types I, II, and III
form hetero-oligomeric complexes in the presence of ligand. J Biol Chem
1993;268(30):22215e8.
[52] Letourneur O, Goetschy JF, Horisberger M, Grutter MG. Ligand-induced
dimerization of the extracellular domain of the TGF-beta receptor type II.
Biochem Biophys Res Commun 1996;224(3):709e16.
[53] Komatsu N, Mariotti-Ferrandiz ME, Wang Y, Malissen B, Waldmann H, Hori S.
Heterogeneity of natural Foxp3þ T cells: a committed regulatory T-cell line-
age and an uncommitted minor population retaining plasticity. Proc Natl Acad
Sci U S A 2009;106(6):1903e8.
[54] Zhou X, Bailey-Bucktrout SL, Jeker LT, Penaranda C, Martinez-Llordella M,
Ashby M, et al. Instability of the transcription factor Foxp3 leads to the gen-
eration of pathogenic memory T cells in vivo. Nat Immunol 2009;10(9):
1000e7.
[55] Maincent P, Thouvenot P, Amicabile C, Hoffman M, Kreuter J, Couvreur P, et al.
Lymphatic targeting of polymeric nanoparticles after intraperitoneal admin-
istration in rats. Pharm Res 1992;9(12):1534e9.
[56] Shirali AC, Look M, Du W, Kassis E, Stout-Delgado HW, Fahmy TM, et al.
Nanoparticle delivery of mycophenolic acid upregulates PD-L1 on dendritic
cells to prolong murine allograft survival. Am J Transpl: Off J Am Soc Transpl
Am Soc Transpl Surg 2011;11(12):2582e92.
[57] Look M, Stern E, Wang QA, DiPlacido LD, Kashgarian M, Craft J, et al. Nanogel-
based delivery of mycophenolic acid ameliorates systemic lupus erythema-
tosus in mice. J Clin Invest 2013;123(4):1741e9.
[58] Maldonado RA, LaMothe RA, Ferrari JD, Zhang AH, Rossi RJ, Kolte PN, et al.
Polymeric synthetic nanoparticles for the induction of antigen-specific
immunological tolerance. Proc Natl Acad Sci U S A 2015;112(2):E156e65.
M.D. McHugh et al. / Biomaterials 59 (2015) 172e181 181](https://image.slidesharecdn.com/5375e588-81bb-49be-ba0b-0b9181b88a11-150519214403-lva1-app6891/85/Paracrine-TGF_IL2-paper-10-320.jpg)


