Oxygen-hemoglobin Dissociation Curve
By Dipalee Parikh
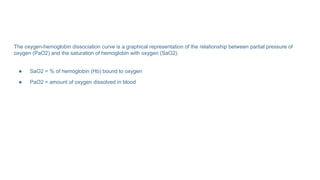
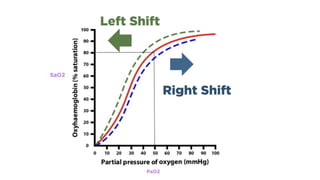
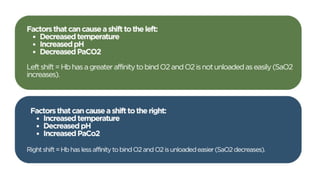
The oxygen-hemoglobin dissociation curve is a graphical representation of the relationship between partial pressure of
oxygen (PaO2) and the saturation of hemoglobin with oxygen (SaO2).
â—Ź SaO2 = % of hemoglobin (Hb) bound to oxygen
â—Ź PaO2 = amount of oxygen dissolved in blood
For example, at the same partial pressure of oxygen (e.g., 50mmHg), the blue curve (which has shifted to the right) has a
lower SaO2 level than the green curve (which has shifted to the left).
Remember...
â—Ź External factors that have caused a shift to the right cause Hb to have less affinity to bind O2 and O2 is unloaded
easier (SaO2 decreases).
â—Ź External factors that have caused a shift to the left cause Hb to have more affinity to bind O2 and O2 is not unloaded
as easily (SaO2 increases).
Please post your questions on dipaleeparikh@gmail.com
Thank you!

Oxygen-hemoglobin Dissociation Curve.pdf

  • 1.
  • 2.
    The oxygen-hemoglobin dissociationcurve is a graphical representation of the relationship between partial pressure of oxygen (PaO2) and the saturation of hemoglobin with oxygen (SaO2). â—Ź SaO2 = % of hemoglobin (Hb) bound to oxygen â—Ź PaO2 = amount of oxygen dissolved in blood
  • 5.
    For example, atthe same partial pressure of oxygen (e.g., 50mmHg), the blue curve (which has shifted to the right) has a lower SaO2 level than the green curve (which has shifted to the left). Remember... â—Ź External factors that have caused a shift to the right cause Hb to have less affinity to bind O2 and O2 is unloaded easier (SaO2 decreases). â—Ź External factors that have caused a shift to the left cause Hb to have more affinity to bind O2 and O2 is not unloaded as easily (SaO2 increases).
  • 6.
    Please post yourquestions on dipaleeparikh@gmail.com Thank you!