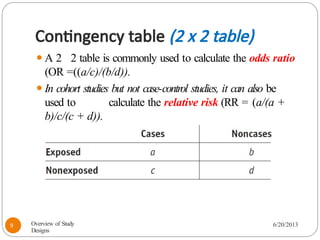
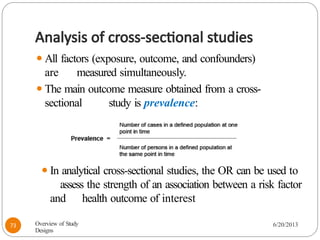
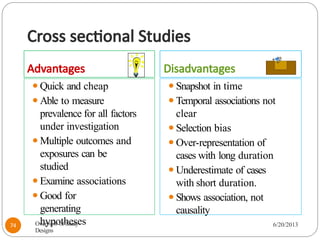
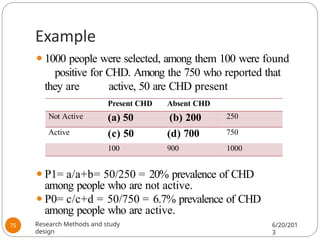
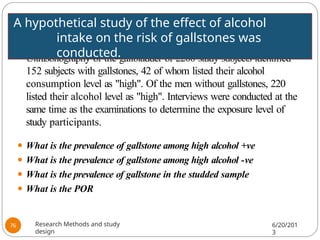
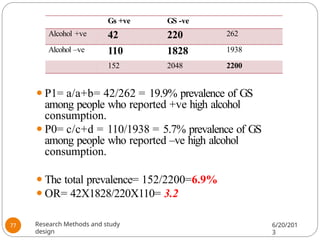
Dr. Zaher Nazzal MD, ABCM
Ass. Professor in Community
Medicine
Overview of Study Designs
Introduction
⚫Measuring the occurrence of disease or other health
related events in a population is only a beginning.
⚫Epidemiology also help in assessing whether an exposure
is associated with a particular disease (or other
outcome of interest).
⚫We may be interested in obtaining answers to the
following questions:
6/20/2013
2 Overview of Study
Designs
What is Research
⚫ It is an attempt to gain solutions to problems.
⚫ More precisely, it is the collection of data in a
rigorously controlled situation for the purpose of
prediction or explanation.
⚫ Therefore,
⚫ It is a form of systematic inquiry.
⚫ It sets out to answer questions through assessing,
summarizing and drawing conclusions from a large
amounts of information.
Research Methods and study
design
6/20/2013
3
Goals of Research
1. Describe a disease, prevalence and natural
history
2. Determine a prognosis
3. Determine cause effect relationships
4. Evaluate new therapies and diagnostics
5. Evaluate screening procedures
6. Medical Review
Research Methods and study
design
6/20/2013
4
Study Designs
⚫It is the planning of how a research project will be
conducted in order to answer a research question.
⚫All the study designs provide meaningful information
when used appropriately and their strengths and
limitations are understood.
⚫It is important to understand the temporal relationship
between when data are collected for the event versus
the outcome.
Overview of Study
Designs
6/20/2013
5
Spectrum of Study Designs
Case
Report
Case /eries
Cross-sectional study
Case-Control study
Cohort study
Randomized clinical trial
Meta-analysis
Overview of Study
Designs
6/20/2013
6
Types of study designs
1. Experimental (interventional) studies
⚫ Animal studies
⚫ Human clinical trials
2. Observational studies (descriptive &
analytical)
⚫ Case report and case series
⚫ Cross-sectional (snap shot)
⚫ Case-control
⚫ Cohort (longitudinal)
Overview of Study
Designs
6/20/2013
7
Contingency table (2 x 2 table)
⚫A table commonly used to display results of
epidemiologic studies to calculate measures of disease
frequency and association from dichotomous categorical
variables.
⚫A typical 2 x 2 table in epidemiologic studies is as
follows:
Overview of Study
Designs
6/20/2013
8
Contingency table (2 x 2 table)
⚫A 2 2 table is commonly used to calculate the odds ratio
(OR =((a/c)/(b/d)).
⚫In cohort studies but not case-control studies, it can also be
used to calculate the relative risk (RR = (a/(a +
b)/c/(c + d)).
Overview of Study
Designs
6/20/2013
9
Case Reports & Case Series
Overview of Study
Designs
6/20/2013
10
Case Reports
⚫Detailed presentation of a single case or handful of
cases
⚫Generally report a new or unique finding
⚫e.g. previous undescribed disease
⚫e.g. unexpected link between diseases
⚫e.g. unexpected new therapeutic effect
⚫e.g. adverse events
Overview of Study
Designs
6/20/2013
11
Case Series
⚫Compilation of multiple case reports
⚫Assesses prevalent disease
⚫Cases may be identified from a single or multiple
sources
⚫Generally report on new/unique condition
⚫May be only realistic design for rare disorders
⚫Cases are not compared to a control group
⚫Descriptive statistics
⚫Usually no statistical testing
Overview of Study
Designs
6/20/2013
12
Case Series & case reports
⚫The first two of these designs are employed in clinical,
rather than epidemiologic, studies,
⚫but often are precursors to epidemiologic studies
⚫Case reports and case series's are the clinical route to
definition and recognition of disease entities and to
the formulation of hypotheses.
⚫These studies are not "epidemiologic" in the sense that
they have no explicit comparison group or population
reference.
⚫Comparison with "common knowledge", "general
experience", etc., when the characteristics of cases
are striking
Overview of Study
Designs
6/20/2013
13
Case Series & case reports
Advantages Disadvantages
⚫Time efficient, less
resource
intensive
⚫Uses available
clinical data
⚫Recognizes new
diseases
⚫Rapid
hypothesis
generation
⚫Basis for
⚫Cases may not
be
representative
⚫No comparison group
or underlying
population
represented
⚫Open to systematic
errors
Overview of Study
Designs
6/20/201
3
14
Interventional Studies
Overview of Study
Designs
6/20/201
3
15
Interventional (Experimental) Studies
⚫An experimental study (trial) investigates the role of
some agent in the prevention or treatment of a
disease.
⚫In this type of study, the investigator assigns individuals to
two or more groups that either receive or do not
receive the preventive or therapeutic agent.
⚫The group that is allocated the agent under study is
generally called the treatment
(Intervention)group,
⚫The group that is not allocated the agent under study is
called the comparison (Control) group.
Overview Epidemiologic Study
Designs
6/20/2013
16
Interventional (Experimental) Studies
⚫Depending on the purpose of the trial, the comparison
group may receive no treatment at all, an inactive
treatment such as a placebo, or another active
treatment.
⚫The active manipulation of the agent by the investigator is
the hallmark that distinguishes experimental studies
from observational ones.
⚫In the latter, the investigator acts as a passive observer
merely letting nature take its course.
⚫Most epidemiologists believe that experimental
studies produce more scientifically rigorous
results than do observational studies.
Overview Epidemiologic Study
Designs
6/20/2013
17
Types of Experimental studies:
1. Preventive trials
⚫ These evaluate whether a preventive agent (e.g. Vaccine)
or procedure reduces the risk of development of a
particular disease.
⚫ We compare incidence rate among exposed and non-
exposed.
2. Therapeutic trials:
⚫ Carried out among patients with a particular disease,
⚫ to determine the ability of an agent or procedure to
diminish symptoms, prevent recurrence, or decrease
risk of death from that disease.
Overview of Study
Designs
6/20/201
3
18
Experimental (Intervention) Studies
⚫Purpose:
⚫Study of the causal association between an exposure factor
and one or more outcomes
⚫Study of efficacy of intervention
⚫Strong confirmation of hypothesis about causation
⚫Randomized vs Non-randomized trials
⚫Controlled trials vs Uncontrolled trials
Overview of Study
Designs
6/20/201
3
19
Basic study designs of clinical trials
Uncontrolle
d (pre/post
test)
Controlled
Non-
randomized
Randomized
Intervention
trial
Concurren
t
controls
Historica
l
control
s
strength of causal
inference
Overview of Study
Designs
6/20/201
3
20
Intervention
Controls
Subjects
meeting
Entry
criteria
With outcome
Without outcome
With outcome
Without outcome
Onset of
study
Time
Intervention
Overview of Study
Designs
6/20/201
3
21
Randomization: Intervention Assignment
⚫Individuals are assigned to receive one of the two or
more treatments being compared.
⚫Randomization, “an act of assigning or ordering that is
the result of a random process,” is the preferred
method
⚫Random allocation of subjects to the experiment and control
groups
⚫Each subject has an equal chance of being assigned to
any group in the study
⚫less prone to bias than other methods
⚫produces groups with very similar characteristics.
Overview Epidemiologic Study
Designs
6/20/2013
22
Randomization: Intervention Assignment
⚫Random assignment methods include
⚫flipping a coin,
⚫using a random number table (commonly found in
statistics textbooks), and
⚫using a computerized random number generator.
Overview Epidemiologic Study
Designs
6/20/2013
23
Randomization: Intervention Assignment
⚫The treatments are administered according to a
specific protocol.
⚫in a therapeutic trial participants may be asked to take either
an active drug or an inactive drug known as a placebo
⚫Placebos permit study participants and investigators to be
masked—that is, to be unaware of the participant’s
treatment assignment.
⚫Masking of subjects and investigators helps prevent biased
ascertainment of the outcome, particularly when end
points involve subjective assessments.
Overview Epidemiologic Study
Designs
6/20/2013
24
Ascertaining the Outcomes
⚫During the follow-up stage, the treatment and
comparison groups are monitored for the outcomes
under study.
⚫If the study’s goal is to prevent the occurrence of disease, the
outcomes may include the first occurrence of disease
(incidence).
⚫If the study is investigating a new treatment among patients,
the outcomes may include disease recurrence, symptom
improvement, length of survival, or side effects.
⚫The length of follow-up depends on the particular
outcome under study.
⚫It can range from a few months to a few decades.
Overview Epidemiologic Study
Designs
6/20/2013
25
Randomized Controlled Trial
According to participant exposure
⚫Parallel design:
⚫each individual is exposed to only one of the study
intervention; one to the actual intervention and the other to
either a placebo or another intervention (between participant
comparison).
⚫Cross-over design:
⚫Each participant act as his or her control.
⚫Produce within participant comparison.
⚫One of the very serious drawbacks is the carry over
effect which distorts the results.
Overview of Study
Designs
6/20/201
3
26
Randomized Controlled Trial
According to “whether investigators and
participants know which intervention is being
used”:
⚫Open RCT (e.g. surgical interventions)
⚫Single-blind RCT
⚫Double blind RCT
⚫Triple blind RCT
Overview of Study
Designs
6/20/201
3
27
Masking or (Blinding)
⚫It is a method of concealing (hiding) knowledge of
treatment assignment to reduce bias in measuring
outcome.
⚫ Single– blinding:
⚫The subject is not aware of the type of treatment he is taking.
It is important to avoid psychological effects of treatment
⚫Double-blinding:
⚫Both the subject and the investigator are not aware of the type of
treatment. Blinding of the investigator is important to avoid
observer bias in the assessment of the outcome.
⚫Triple-blinding:
⚫In addition to the above, the data analyst is also unaware of the type
of treatment to avoid bias in data analysis.
Overview of Study
Designs
6/20/201
3
28
Design of RCTs:
1. The first step is to identify the reference population
(the target population).
⚫ The reference population is the population to which
generalizations of the results of the experiment apply.
2. Second, Selection of a study population after
defining inclusion/exclusion criteria.
⚫ The inclusion criteria identify the target group or
subgroup
that will enter the study
⚫ The exclusion criteria are chosen to minimize potential
dangers (e.g. elderly patients, pregnant women,
children)
3. Getting ‘informed consent’ from the participants
before they are subjected to experiments.
Overview of Study
Designs
6/20/201
3
29
Design of RCTs:
4. Random allocation of subjects to the experiment
and control groups,
5. Follow up for a specified period of time under
strict conditions
6. The outcome of the experiment is carefully
measured.
⚫ The outcome may be a cure, recurrence of the
disease, survival, relief of pain, or reduction in blood
pressure, etc.
7. The outcome measures are compared between the
groups using appropriate statistical methods.
Overview of Study
Designs
6/20/201
3
30
Non-randomized Trials
Quasi-Experiments:
⚫Quasi-experiments are very similar to true experiments
but use naturally formed or pre-existing groups.
⚫With the exception of no random assignment, the
study looks similar in form to a true experiment.
⚫As no random assignment exists in a quasi-experiment,
no causal statements can be made based on the
results of the study.
Overview of Study
Designs
6/20/201
3
31
RCT studies
Advantages
• Randomization - balance
of confounding factors
• Uniform collection of
data
• Protocol procedures
andinterventions
specified
• Blinding
Disadvantages
• Large number of
participants
• Financial costs
• Ethics
• Subjects may not comply
withinterventions
• Long time for conclusion
• Lack of generalizability
Overview of Study
Designs
6/20/201
3
32
Cohort Studies
Overview of Study
Designs
6/20/201
3
33
Cohort studies
⚫A cohort is defined as a group of people with a
common characteristic or experience.
⚫In a cohort study, healthy subjects are defined according
to their exposure status and followed over time to
determine the incidence of symptoms, disease, or
death.
⚫The common characteristic for grouping subjects is
their exposure level.
Overview Epidemiologic Study
Designs
6/20/2013
34
Cohort studies
⚫Usually two groups are compared, an “exposed”
and “unexposed” group.
⚫The unexposed group is called the referent group
or comparison group.
⚫Also called follow-up or incidence studies
⚫Begin with sample 🡒 “Healthy Cohort” (i.e.,
subjects without the outcome yet)
Overview Epidemiologic Study
Designs
6/20/2013
35
Cohort studies
⚫Start with Exposure status, then compare subsequent
disease experience in exposed vs. unexposed.
⚫Purpose: Estimate association between exposure
and disease or estimate incidence of disease.
⚫The choice of the exposed group in a cohort study
depends on the
⚫hypothesis being tested,
⚫the exposure frequency, and
⚫feasibility considerations such as the availability of records
and ease of follow-up.
Overview Epidemiologic Study
Designs
6/20/2013
36
Cohort studies
T
o studying disease incidence and risk factors:
1. Start with a population at risk
2. Measure exposures and covariates at baseline
3. Follow-up the cohort over time with
⚫ a) Surveillance for events or b) re-examination
4. Keep track of attrition, withdrawals, drop-outs
5. Measure the outcome variable during follow up
6. Compare event rates in people with and without
exposures
⚫ Relative risk
Overview of Study
Designs
6/20/201
3
37
Selection of Cohort Groups
• There are two basic ways to generate cohort groups.
 Select a cohort (defined population) BEFORE exposure
occur or before the exposures are identified.
 Select a cohort on the basis of some factor (e.g., where
they live) and take histories on the entire population to
separate into exposed and non-exposed groups.
• Regardless of which selection approach is used, we
are comparing exposed and non-exposed persons.
Overview of Study
Designs
6/20/201
3
38
Exposed or subjects
Cohort
selected
for study
Unexposed or controls
With outcome
Without outcome
Onset of
study
With outcome
Without outcome
Time
Direction of inquiry
Overview of Study
Designs
6/20/201
3
39
Relative Risk
⚫Comparing disease occurrence among exposed with
disease
occurrence among comparison group (usually unexposed)
in a ratio measure.
⚫Relative Risk=
Risk in exposed
Risk in
unexposed
Overview of Study
Designs
6/20/201
3
40
Interpreting Relative Risk (RR)
⚫If RR = 1
⚫Risk in the exposed equal to risk in unexposed (no
association)
⚫If RR > 1
⚫Risk in exposed greater than risk in unexposed
(positive association ; possibly causal)
⚫If RR < 1
⚫Risk in exposed less than risk in unexposed
(negative association; possibly protective)
Overview of Study
Designs
6/20/201
3
41
Cohort studies
Advantages
⚫T
emporal relationship clear
.
⚫Can study course of
disease development.
⚫Good for rare exposures.
⚫Decreases potential for
many biases since disease
has not occurred
at time of
classification.
Disadvantages
⚫Time-consuming, expensive.
⚫Loss to follow-up and
missing data - for example,
drop-outs, attrition,
migration.
⚫Not suitable for rare
diseases.
Overview of Study
Designs
6/20/201
3
42
Example
A cohort study was conduct to evaluate the relation
between cigarette smoking and MI.The study was
performed on 789 individuals of who 267 were cigarette
smokers. MI was diagnosed in 157 smokers compared to
209 non-smokers.
Is there is relation between myocardial infarction
and smoking? Explain your answer.
Overview of Study
Designs
6/20/201
3
43
⚫Construct a 2 x 2
table
⚫Calculate the incidence of myocardial
infarction among smokers, non-smokers
⚫I exp= 157/267= 58.8%
⚫I un-exp= 209/522= 40.0%
MI +ve MI –ve Total
Cig Smok +ve 157 267
Cig Smok -ve 209 522
Total 789
Overview of Study
Designs
6/20/201
3
44
⚫Calculate the relative risk and interpreted the
findings
⚫RR= Iexo/Iun-exp= 58.8/40.0 ≈ 1.3
⚫/mokers are 1.3 times more risky to develop
MI compared to non
smokers
Overview of Study
Designs
6/20/201
3
45
Example
⚫ A study to assess the relationship between eating a low fat diet
and development of DM. 1,000 subjects without DM were
enrolled. Subjects filled out a dietary questionnaire at the start
of the study.
⚫ Analysis of the responses showed that 400 people ate a low fat
diet (less than 30% of calories from fat), while the remaining
600 people consumed a high fat diet (>30% of calories from
fat).
⚫ At the end of the study, 50 people on the low fat diet
developed DM , while 250 of the people who ate a high fat
diet had DM.
⚫ What is the risk ratio the association between a low fat diet
and DM?
Overview of Study
Designs
6/20/201
3
46
⚫Construct a 2 x 2
table
⚫I exp= 250/600= 42%
⚫I un-exp= 50/400= 12.5%
⚫People with ligh fat diet have about 3.3 times the risk
of developing DM compared to people with low
fat diet
⚫.
DM +ve DM –ve Total
Low fat diet 50 150 400
High fat diet 250 550 600
Total 1000
Overview of Study
Designs
6/20/201
3
47
Case Control Studies
Research Methods and study
design
6/20/2013
48
Case-Control Studies
⚫Provide a relatively simple way to investigate determinants
of diseases, especially rare diseases
⚫In the traditional view, subjects are selected on the basis
of whether they have or do not have the disease.
⚫Those who have the disease are termed cases, and
⚫those who do not have the disease are termed controls.
⚫The exposure histories of cases and controls are
then obtained and compared.
Research Methods and study
design
6/20/2013
49
Case-Control Studies
⮞ Begin with sample of “Cases and Controls”
⮞ Start with Disease status, then assess and compare
Exposures in cases vs. controls.
⮞ Purpose: Estimate association between past
exposure and current case-control status.
Research Methods and study
design
6/20/2013
50
Exposed
Unexposed
Exposed
Unexposed
Cases
(people
with
disease)
Controls
(people
without
disease)
Onset
of study
Direction of inquiry
Research Methods and study
design
6/20/2013
51
6/20/2013
Overview of Study
Designs
52
Identification of Cases
⚫To conduct a case–control study, we must start by
identifying a group of people who have the disease in
question….cases.
⚫Cases could be identified through:
⚫Through hospital registries or clinic records listing all
patients having a certain disease.
⚫Through local health department disease registries.
⚫Found in a predefined group that includes medical records,
such as high schools and some industrial plants, or in a
prepaid health insurance group.
Research Methods and study
design
6/20/2013
53
Identification of Controls
⚫One of the most difficult design issues in epidemiology
⚫Difference in prior exposure of cases and controls shouldn’t
be the result of the process used to select the controls
(selection bias)
⚫Controls should be representative of the source
population from which cases were derived.
⚫ Random sample of controls from the source
population from which the cases came (Challenging &
Expensive).
⚫Special groups: friends, neighbors or relatives of the cases.
⚫Hospital- or clinic-based controls are frequently used
Research Methods and study
design
6/20/2013
54
How Many Controls ?
⚫Case-control studies are often used for
uncommon outcomes,
⚫investigators often have a limited number of cases.
⚫In this situation the statistical power of the study can be
increased somewhat by enrolling more controls than
cases.
⚫Ratios greater than 4:1 have little additional impact on
power.
⚫However, if the data on controls is easily obtained, there is
no reason to limit the number of controls.
⚫ Can be 1:1, 1:2, 1:3, 1:4
Overview of Study
Designs
6/20/2013
55
Matching
⚫The process of making a study group and a comparison
group similar or identical with respect to their distribution
of extraneous factors
⚫This can be done by
⚫by individual matching (e.g. for each case, choose a control
of the same age and gender) or
⚫by frequency matching (e.g. if there are 25 male cases in the
30- 34 age-group then choose the same number of male
controls for this age-group).
Overview Epidemiologic Study
Designs
6/20/2013
56
Sources of Exposure Information
⚫Case–control studies are used to investigate the risk
of disease in relation to a wide variety of
exposures,
⚫ lifestyle, occupation, environment, genes, diet,
reproduction, and the use of medications.
⚫Sources available for obtaining exposure data include
⚫in-person and telephone interviews;
⚫self-administered questionnaires;
⚫preexisting medical, pharmacy, registry, employment,
insurance, birth, death, and environmental records;
and
⚫biological specimens.
Overview Epidemiologic Study
Designs
6/20/2013
57
Odds Ratio
⚫The probability of occurrence of an event as compared to
the probability of nonoccurrence of an event in a
population.
⚫A measure of association typically used to quantify the
strength of association between an exposure and an
outcome.
⚫It is a measure of the relative magnitude of the odds of
exposure among cases and the odds of exposure among
controls:
Research Methods and study
design
6/20/2013
58
Odds Ratio
⚫ Compare the odds of those with a disease will have been exposed
to the risk factor, with the odds that those without the disease will
have been exposed
Cases Controls
Exposed a b
Not exposed c d
a+c b+d
Odds ratio = a/c =
b/d
ad
bc
Research Methods and study
design
6/20/2013
59
Odds Ratio
⚫OR = 1
⚫The odds of exposure among cases = the odds among the
controls.
⚫No evident association between exposure and disease.
⚫OR > 1
⚫ Larger odds of exposure among the cases than among the
controls.
⚫Cases have a higher odds of having been exposed in the past.
⚫This situation illustrates a risk factor.With the same reasoning
⚫OR < 1
⚫Smaller odds of exposure among cases as compared to controls,
⚫Controls have a higher odds of having been exposed.
⚫This situation illustrates a protective factor.
Research Methods and study
design
6/20/2013
60
Case-Control Studies
⚫Issues
⚫Definition and selection of cases
⚫ Incident versus prevalent cases
⚫Source of controls:
⚫ hospital, general population, special series
⚫Number of control groups
⚫Case : control ratio
⚫Ascertainment of disease and exposure
status
Research Methods and study
design
6/20/2013
61
Case-Control Studies
Advantages Disadvantages
• Short study time.
• Less expensive than
cohort study.
• Good for rare diseases.
• Selective recall (Recall
bias)
• Mortality bias if prevalent
rather than incident cases.
• Temporal relationship unclear.
• Difficulty in defining
control group.
• Not optimal for rare
exposures.
Overview of Study
Designs
6/20/2013
62
Example
⚫A case-control study to assess the relation between
stroke and cigarette smoking was conducted. 101
stroke patients were compared with 137 healthy
controls.
⚫71 of the stroke patients reported ever smoked compared
to 36 of the controls.
⚫Is there is relation between stroke and
cigarette smoking? Explain your answer.
Research Methods and study
design
6/20/2013
63
Construct a 2 x 2 table
Calculate the odds ratio (OR)
⚫OR= 71x101/36x30 = 7171/1080=6.6
⚫Interpretation: stroke patients are 6.6 more probable
to have ever smoked compared to controls
Stroke +ve Stroke –ve Total
Ever smoked +ve 71 36 107
Ever smoked –ve 30 101 131
Total 101 137 238
Research Methods and study
design
6/20/2013
64
Example
⚫A study was conducted in men aged 40-70 in order to
determine whether exercising for 2 or more hours per
week decreases the likelihood of heart attack.
⚫ The cases were 1,000 men who had recently had a heart
attack; of these, 236 reported that they had regularly
exercised for two or more hours per week prior to their
heart attack. 1,000 controls were also selected for the
study; of these, 379 reported that they exercised
regularly.
⚫Calculate the magnitude of association between regular
exercise and heart attack
⚫What does your calculation suggest?
6/20/2013
Overview of Study
Designs
65
Construct a 2 x 2 table
Calculate the odds ratio (OR)
⚫OR= 236x621/746x379 = 146556/289556=0.51
⚫Interpretation: People who exercise regularly have about
0.5 times the risk of having a heart attack compared to
people who don't exercise.
MI +ve MI–ve Total
Exer > 2hrs +ve 236 379 615
Exer > 2hrs –ve 764 621 1385
Total 1000 1000 2000
Research Methods and study
design
6/20/2013
66
Cross Sectional Studies
Research Methods and study
design
6/20/2013
67
Cross sectional Studies
⚫ “Prevalence study”
⚫Estimate prevalence of disease at a single time point.
⚫Estimate prevalence of risk factors at a single time point.
⚫ provide a "snapshot" of diseases and risk factors
simultaneously in a defined population
⚫Estimate association between disease and exposure at a
single time point or.
⚫Uses of Cross-Sectional studies:
⚫Burden of illness and risk factors
⚫Service needs
⚫Hypothesis generation
Overview of Study
Designs
6/20/2013
68
Cross sectional Studies
⚫Unlike populations studied in cohort and case–control
studies, cross-sectional study, populations are
commonly selected without regard to exposure or
disease status.
⚫A snapshot of a population at a single point in time and
so measure the exposure prevalence in relation to
the disease prevalence.
⚫In other words, current disease status is examined in relation
to current exposure level.
⚫(“the lay of the land”)
Overview of Study
Designs
6/20/2013
69
Subjects
selected for
the study
With outcome
Without outcome
Time
Onset
of study
No direction of
inquiry
Research Methods and study
design
6/20/2013
70
Issues in the design of C-S studies
Choosing a representative sample
⚫A C-S study should be representative of the population
⚫For example, a study of the prevalence of DM among
women aged 40-60 years in Town A should comprise a
random sample of all women aged 40-60 years in that
town.
Sample Size
⚫It sufficiently large enough to estimate the prevalence of
the conditions of interest with adequate precision.
⚫Sample size calculations can be carried out using sample
size tables or statistical packages such as Epi Info.
Overview of Study
Designs
6/20/2013
71
Potential bias in C-S studies
⚫Non-response bias
⚫ A particular problem affecting cross-sectional studies
and can result in bias of the measures of outcome.
⚫Characteristics of non-responders differ from responders.
⚫/election bias
⚫The selected sample is no representative of the
studied population
Overview of Study
Designs
6/20/2013
72
Analysis of cross-sectional studies
⚫All factors (exposure, outcome, and confounders)
are measured simultaneously.
⚫The main outcome measure obtained from a cross-
sectional study is prevalence:
⚫In analytical cross-sectional studies, the OR can be used to
assess the strength of an association between a risk factor
and health outcome of interest
Overview of Study
Designs
6/20/2013
73
Cross sectional Studies
Advantages Disadvantages
⚫Quick and cheap
⚫Able to measure
prevalence for all factors
under investigation
⚫Multiple outcomes and
exposures can be
studied
⚫Examine associations
⚫Good for
generating
hypotheses
⚫Snapshot in time
⚫Temporal associations not
clear
⚫Selection bias
⚫Over-representation of
cases with long duration
⚫Underestimate of cases
with short duration.
⚫Shows association, not
causality
Overview of Study
Designs
6/20/2013
74
Example
⚫1000 people were selected, among them 100 were found
positive for CHD. Among the 750 who reported that
they are active, 50 are CHD present
⚫P1= a/a+b= 50/250 = 20% prevalence of CHD
among people who are not active.
⚫P0= c/c+d = 50/750 = 6.7% prevalence of CHD
among people who are active.
Present CHD Absent CHD
Not Active (a) 50 (b) 200 250
Active (c) 50 (d) 700 750
100 900 1000
Research Methods and study
design
6/20/201
3
75
⚫ Ultrasonography of the gallbladder of 2200 study subjects identified
152 subjects with gallstones, 42 of whom listed their alcohol
consumption level as "high". Of the men without gallstones, 220
listed their alcohol level as "high". Interviews were conducted at the
same time as the examinations to determine the exposure level of
study participants.
⚫ What is the prevalence of gallstone among high alcohol +ve
⚫ What is the prevalence of gallstone among high alcohol -ve
⚫ What is the prevalence of gallstone in the studded sample
⚫ What is the POR
A hypothetical study of the effect of alcohol
intake on the risk of gallstones was
conducted.
Research Methods and study
design
6/20/201
3
76
⚫P1= a/a+b= 42/262 = 19.9% prevalence of GS
among people who reported +ve high alcohol
consumption.
⚫P0= c/c+d = 110/1938 = 5.7% prevalence of GS
among people who reported –ve high alcohol
consumption.
⚫The total prevalence= 152/2200=6.9%
⚫OR= 42X1828/220X110= 3.2
Gs +ve GS -ve
Alcohol +ve 42 220 262
Alcohol –ve 110 1828 1938
152 2048 2200
Research Methods and study
design
6/20/201
3
77
Research Methods and study
design
6/20/201
3
78

Overview Overview-of-Study-Designs Study-Designs

  • 1.
    Dr. Zaher NazzalMD, ABCM Ass. Professor in Community Medicine Overview of Study Designs
  • 2.
    Introduction ⚫Measuring the occurrenceof disease or other health related events in a population is only a beginning. ⚫Epidemiology also help in assessing whether an exposure is associated with a particular disease (or other outcome of interest). ⚫We may be interested in obtaining answers to the following questions: 6/20/2013 2 Overview of Study Designs
  • 3.
    What is Research ⚫It is an attempt to gain solutions to problems. ⚫ More precisely, it is the collection of data in a rigorously controlled situation for the purpose of prediction or explanation. ⚫ Therefore, ⚫ It is a form of systematic inquiry. ⚫ It sets out to answer questions through assessing, summarizing and drawing conclusions from a large amounts of information. Research Methods and study design 6/20/2013 3
  • 4.
    Goals of Research 1.Describe a disease, prevalence and natural history 2. Determine a prognosis 3. Determine cause effect relationships 4. Evaluate new therapies and diagnostics 5. Evaluate screening procedures 6. Medical Review Research Methods and study design 6/20/2013 4
  • 5.
    Study Designs ⚫It isthe planning of how a research project will be conducted in order to answer a research question. ⚫All the study designs provide meaningful information when used appropriately and their strengths and limitations are understood. ⚫It is important to understand the temporal relationship between when data are collected for the event versus the outcome. Overview of Study Designs 6/20/2013 5
  • 6.
    Spectrum of StudyDesigns Case Report Case /eries Cross-sectional study Case-Control study Cohort study Randomized clinical trial Meta-analysis Overview of Study Designs 6/20/2013 6
  • 7.
    Types of studydesigns 1. Experimental (interventional) studies ⚫ Animal studies ⚫ Human clinical trials 2. Observational studies (descriptive & analytical) ⚫ Case report and case series ⚫ Cross-sectional (snap shot) ⚫ Case-control ⚫ Cohort (longitudinal) Overview of Study Designs 6/20/2013 7
  • 8.
    Contingency table (2x 2 table) ⚫A table commonly used to display results of epidemiologic studies to calculate measures of disease frequency and association from dichotomous categorical variables. ⚫A typical 2 x 2 table in epidemiologic studies is as follows: Overview of Study Designs 6/20/2013 8
  • 9.
    Contingency table (2x 2 table) ⚫A 2 2 table is commonly used to calculate the odds ratio (OR =((a/c)/(b/d)). ⚫In cohort studies but not case-control studies, it can also be used to calculate the relative risk (RR = (a/(a + b)/c/(c + d)). Overview of Study Designs 6/20/2013 9
  • 10.
    Case Reports &Case Series Overview of Study Designs 6/20/2013 10
  • 11.
    Case Reports ⚫Detailed presentationof a single case or handful of cases ⚫Generally report a new or unique finding ⚫e.g. previous undescribed disease ⚫e.g. unexpected link between diseases ⚫e.g. unexpected new therapeutic effect ⚫e.g. adverse events Overview of Study Designs 6/20/2013 11
  • 12.
    Case Series ⚫Compilation ofmultiple case reports ⚫Assesses prevalent disease ⚫Cases may be identified from a single or multiple sources ⚫Generally report on new/unique condition ⚫May be only realistic design for rare disorders ⚫Cases are not compared to a control group ⚫Descriptive statistics ⚫Usually no statistical testing Overview of Study Designs 6/20/2013 12
  • 13.
    Case Series &case reports ⚫The first two of these designs are employed in clinical, rather than epidemiologic, studies, ⚫but often are precursors to epidemiologic studies ⚫Case reports and case series's are the clinical route to definition and recognition of disease entities and to the formulation of hypotheses. ⚫These studies are not "epidemiologic" in the sense that they have no explicit comparison group or population reference. ⚫Comparison with "common knowledge", "general experience", etc., when the characteristics of cases are striking Overview of Study Designs 6/20/2013 13
  • 14.
    Case Series &case reports Advantages Disadvantages ⚫Time efficient, less resource intensive ⚫Uses available clinical data ⚫Recognizes new diseases ⚫Rapid hypothesis generation ⚫Basis for ⚫Cases may not be representative ⚫No comparison group or underlying population represented ⚫Open to systematic errors Overview of Study Designs 6/20/201 3 14
  • 15.
    Interventional Studies Overview ofStudy Designs 6/20/201 3 15
  • 16.
    Interventional (Experimental) Studies ⚫Anexperimental study (trial) investigates the role of some agent in the prevention or treatment of a disease. ⚫In this type of study, the investigator assigns individuals to two or more groups that either receive or do not receive the preventive or therapeutic agent. ⚫The group that is allocated the agent under study is generally called the treatment (Intervention)group, ⚫The group that is not allocated the agent under study is called the comparison (Control) group. Overview Epidemiologic Study Designs 6/20/2013 16
  • 17.
    Interventional (Experimental) Studies ⚫Dependingon the purpose of the trial, the comparison group may receive no treatment at all, an inactive treatment such as a placebo, or another active treatment. ⚫The active manipulation of the agent by the investigator is the hallmark that distinguishes experimental studies from observational ones. ⚫In the latter, the investigator acts as a passive observer merely letting nature take its course. ⚫Most epidemiologists believe that experimental studies produce more scientifically rigorous results than do observational studies. Overview Epidemiologic Study Designs 6/20/2013 17
  • 18.
    Types of Experimentalstudies: 1. Preventive trials ⚫ These evaluate whether a preventive agent (e.g. Vaccine) or procedure reduces the risk of development of a particular disease. ⚫ We compare incidence rate among exposed and non- exposed. 2. Therapeutic trials: ⚫ Carried out among patients with a particular disease, ⚫ to determine the ability of an agent or procedure to diminish symptoms, prevent recurrence, or decrease risk of death from that disease. Overview of Study Designs 6/20/201 3 18
  • 19.
    Experimental (Intervention) Studies ⚫Purpose: ⚫Studyof the causal association between an exposure factor and one or more outcomes ⚫Study of efficacy of intervention ⚫Strong confirmation of hypothesis about causation ⚫Randomized vs Non-randomized trials ⚫Controlled trials vs Uncontrolled trials Overview of Study Designs 6/20/201 3 19
  • 20.
    Basic study designsof clinical trials Uncontrolle d (pre/post test) Controlled Non- randomized Randomized Intervention trial Concurren t controls Historica l control s strength of causal inference Overview of Study Designs 6/20/201 3 20
  • 21.
    Intervention Controls Subjects meeting Entry criteria With outcome Without outcome Withoutcome Without outcome Onset of study Time Intervention Overview of Study Designs 6/20/201 3 21
  • 22.
    Randomization: Intervention Assignment ⚫Individualsare assigned to receive one of the two or more treatments being compared. ⚫Randomization, “an act of assigning or ordering that is the result of a random process,” is the preferred method ⚫Random allocation of subjects to the experiment and control groups ⚫Each subject has an equal chance of being assigned to any group in the study ⚫less prone to bias than other methods ⚫produces groups with very similar characteristics. Overview Epidemiologic Study Designs 6/20/2013 22
  • 23.
    Randomization: Intervention Assignment ⚫Randomassignment methods include ⚫flipping a coin, ⚫using a random number table (commonly found in statistics textbooks), and ⚫using a computerized random number generator. Overview Epidemiologic Study Designs 6/20/2013 23
  • 24.
    Randomization: Intervention Assignment ⚫Thetreatments are administered according to a specific protocol. ⚫in a therapeutic trial participants may be asked to take either an active drug or an inactive drug known as a placebo ⚫Placebos permit study participants and investigators to be masked—that is, to be unaware of the participant’s treatment assignment. ⚫Masking of subjects and investigators helps prevent biased ascertainment of the outcome, particularly when end points involve subjective assessments. Overview Epidemiologic Study Designs 6/20/2013 24
  • 25.
    Ascertaining the Outcomes ⚫Duringthe follow-up stage, the treatment and comparison groups are monitored for the outcomes under study. ⚫If the study’s goal is to prevent the occurrence of disease, the outcomes may include the first occurrence of disease (incidence). ⚫If the study is investigating a new treatment among patients, the outcomes may include disease recurrence, symptom improvement, length of survival, or side effects. ⚫The length of follow-up depends on the particular outcome under study. ⚫It can range from a few months to a few decades. Overview Epidemiologic Study Designs 6/20/2013 25
  • 26.
    Randomized Controlled Trial Accordingto participant exposure ⚫Parallel design: ⚫each individual is exposed to only one of the study intervention; one to the actual intervention and the other to either a placebo or another intervention (between participant comparison). ⚫Cross-over design: ⚫Each participant act as his or her control. ⚫Produce within participant comparison. ⚫One of the very serious drawbacks is the carry over effect which distorts the results. Overview of Study Designs 6/20/201 3 26
  • 27.
    Randomized Controlled Trial Accordingto “whether investigators and participants know which intervention is being used”: ⚫Open RCT (e.g. surgical interventions) ⚫Single-blind RCT ⚫Double blind RCT ⚫Triple blind RCT Overview of Study Designs 6/20/201 3 27
  • 28.
    Masking or (Blinding) ⚫Itis a method of concealing (hiding) knowledge of treatment assignment to reduce bias in measuring outcome. ⚫ Single– blinding: ⚫The subject is not aware of the type of treatment he is taking. It is important to avoid psychological effects of treatment ⚫Double-blinding: ⚫Both the subject and the investigator are not aware of the type of treatment. Blinding of the investigator is important to avoid observer bias in the assessment of the outcome. ⚫Triple-blinding: ⚫In addition to the above, the data analyst is also unaware of the type of treatment to avoid bias in data analysis. Overview of Study Designs 6/20/201 3 28
  • 29.
    Design of RCTs: 1.The first step is to identify the reference population (the target population). ⚫ The reference population is the population to which generalizations of the results of the experiment apply. 2. Second, Selection of a study population after defining inclusion/exclusion criteria. ⚫ The inclusion criteria identify the target group or subgroup that will enter the study ⚫ The exclusion criteria are chosen to minimize potential dangers (e.g. elderly patients, pregnant women, children) 3. Getting ‘informed consent’ from the participants before they are subjected to experiments. Overview of Study Designs 6/20/201 3 29
  • 30.
    Design of RCTs: 4.Random allocation of subjects to the experiment and control groups, 5. Follow up for a specified period of time under strict conditions 6. The outcome of the experiment is carefully measured. ⚫ The outcome may be a cure, recurrence of the disease, survival, relief of pain, or reduction in blood pressure, etc. 7. The outcome measures are compared between the groups using appropriate statistical methods. Overview of Study Designs 6/20/201 3 30
  • 31.
    Non-randomized Trials Quasi-Experiments: ⚫Quasi-experiments arevery similar to true experiments but use naturally formed or pre-existing groups. ⚫With the exception of no random assignment, the study looks similar in form to a true experiment. ⚫As no random assignment exists in a quasi-experiment, no causal statements can be made based on the results of the study. Overview of Study Designs 6/20/201 3 31
  • 32.
    RCT studies Advantages • Randomization- balance of confounding factors • Uniform collection of data • Protocol procedures andinterventions specified • Blinding Disadvantages • Large number of participants • Financial costs • Ethics • Subjects may not comply withinterventions • Long time for conclusion • Lack of generalizability Overview of Study Designs 6/20/201 3 32
  • 33.
    Cohort Studies Overview ofStudy Designs 6/20/201 3 33
  • 34.
    Cohort studies ⚫A cohortis defined as a group of people with a common characteristic or experience. ⚫In a cohort study, healthy subjects are defined according to their exposure status and followed over time to determine the incidence of symptoms, disease, or death. ⚫The common characteristic for grouping subjects is their exposure level. Overview Epidemiologic Study Designs 6/20/2013 34
  • 35.
    Cohort studies ⚫Usually twogroups are compared, an “exposed” and “unexposed” group. ⚫The unexposed group is called the referent group or comparison group. ⚫Also called follow-up or incidence studies ⚫Begin with sample 🡒 “Healthy Cohort” (i.e., subjects without the outcome yet) Overview Epidemiologic Study Designs 6/20/2013 35
  • 36.
    Cohort studies ⚫Start withExposure status, then compare subsequent disease experience in exposed vs. unexposed. ⚫Purpose: Estimate association between exposure and disease or estimate incidence of disease. ⚫The choice of the exposed group in a cohort study depends on the ⚫hypothesis being tested, ⚫the exposure frequency, and ⚫feasibility considerations such as the availability of records and ease of follow-up. Overview Epidemiologic Study Designs 6/20/2013 36
  • 37.
    Cohort studies T o studyingdisease incidence and risk factors: 1. Start with a population at risk 2. Measure exposures and covariates at baseline 3. Follow-up the cohort over time with ⚫ a) Surveillance for events or b) re-examination 4. Keep track of attrition, withdrawals, drop-outs 5. Measure the outcome variable during follow up 6. Compare event rates in people with and without exposures ⚫ Relative risk Overview of Study Designs 6/20/201 3 37
  • 38.
    Selection of CohortGroups • There are two basic ways to generate cohort groups.  Select a cohort (defined population) BEFORE exposure occur or before the exposures are identified.  Select a cohort on the basis of some factor (e.g., where they live) and take histories on the entire population to separate into exposed and non-exposed groups. • Regardless of which selection approach is used, we are comparing exposed and non-exposed persons. Overview of Study Designs 6/20/201 3 38
  • 39.
    Exposed or subjects Cohort selected forstudy Unexposed or controls With outcome Without outcome Onset of study With outcome Without outcome Time Direction of inquiry Overview of Study Designs 6/20/201 3 39
  • 40.
    Relative Risk ⚫Comparing diseaseoccurrence among exposed with disease occurrence among comparison group (usually unexposed) in a ratio measure. ⚫Relative Risk= Risk in exposed Risk in unexposed Overview of Study Designs 6/20/201 3 40
  • 41.
    Interpreting Relative Risk(RR) ⚫If RR = 1 ⚫Risk in the exposed equal to risk in unexposed (no association) ⚫If RR > 1 ⚫Risk in exposed greater than risk in unexposed (positive association ; possibly causal) ⚫If RR < 1 ⚫Risk in exposed less than risk in unexposed (negative association; possibly protective) Overview of Study Designs 6/20/201 3 41
  • 42.
    Cohort studies Advantages ⚫T emporal relationshipclear . ⚫Can study course of disease development. ⚫Good for rare exposures. ⚫Decreases potential for many biases since disease has not occurred at time of classification. Disadvantages ⚫Time-consuming, expensive. ⚫Loss to follow-up and missing data - for example, drop-outs, attrition, migration. ⚫Not suitable for rare diseases. Overview of Study Designs 6/20/201 3 42
  • 43.
    Example A cohort studywas conduct to evaluate the relation between cigarette smoking and MI.The study was performed on 789 individuals of who 267 were cigarette smokers. MI was diagnosed in 157 smokers compared to 209 non-smokers. Is there is relation between myocardial infarction and smoking? Explain your answer. Overview of Study Designs 6/20/201 3 43
  • 44.
    ⚫Construct a 2x 2 table ⚫Calculate the incidence of myocardial infarction among smokers, non-smokers ⚫I exp= 157/267= 58.8% ⚫I un-exp= 209/522= 40.0% MI +ve MI –ve Total Cig Smok +ve 157 267 Cig Smok -ve 209 522 Total 789 Overview of Study Designs 6/20/201 3 44
  • 45.
    ⚫Calculate the relativerisk and interpreted the findings ⚫RR= Iexo/Iun-exp= 58.8/40.0 ≈ 1.3 ⚫/mokers are 1.3 times more risky to develop MI compared to non smokers Overview of Study Designs 6/20/201 3 45
  • 46.
    Example ⚫ A studyto assess the relationship between eating a low fat diet and development of DM. 1,000 subjects without DM were enrolled. Subjects filled out a dietary questionnaire at the start of the study. ⚫ Analysis of the responses showed that 400 people ate a low fat diet (less than 30% of calories from fat), while the remaining 600 people consumed a high fat diet (>30% of calories from fat). ⚫ At the end of the study, 50 people on the low fat diet developed DM , while 250 of the people who ate a high fat diet had DM. ⚫ What is the risk ratio the association between a low fat diet and DM? Overview of Study Designs 6/20/201 3 46
  • 47.
    ⚫Construct a 2x 2 table ⚫I exp= 250/600= 42% ⚫I un-exp= 50/400= 12.5% ⚫People with ligh fat diet have about 3.3 times the risk of developing DM compared to people with low fat diet ⚫. DM +ve DM –ve Total Low fat diet 50 150 400 High fat diet 250 550 600 Total 1000 Overview of Study Designs 6/20/201 3 47
  • 48.
    Case Control Studies ResearchMethods and study design 6/20/2013 48
  • 49.
    Case-Control Studies ⚫Provide arelatively simple way to investigate determinants of diseases, especially rare diseases ⚫In the traditional view, subjects are selected on the basis of whether they have or do not have the disease. ⚫Those who have the disease are termed cases, and ⚫those who do not have the disease are termed controls. ⚫The exposure histories of cases and controls are then obtained and compared. Research Methods and study design 6/20/2013 49
  • 50.
    Case-Control Studies ⮞ Beginwith sample of “Cases and Controls” ⮞ Start with Disease status, then assess and compare Exposures in cases vs. controls. ⮞ Purpose: Estimate association between past exposure and current case-control status. Research Methods and study design 6/20/2013 50
  • 51.
  • 52.
  • 53.
    Identification of Cases ⚫Toconduct a case–control study, we must start by identifying a group of people who have the disease in question….cases. ⚫Cases could be identified through: ⚫Through hospital registries or clinic records listing all patients having a certain disease. ⚫Through local health department disease registries. ⚫Found in a predefined group that includes medical records, such as high schools and some industrial plants, or in a prepaid health insurance group. Research Methods and study design 6/20/2013 53
  • 54.
    Identification of Controls ⚫Oneof the most difficult design issues in epidemiology ⚫Difference in prior exposure of cases and controls shouldn’t be the result of the process used to select the controls (selection bias) ⚫Controls should be representative of the source population from which cases were derived. ⚫ Random sample of controls from the source population from which the cases came (Challenging & Expensive). ⚫Special groups: friends, neighbors or relatives of the cases. ⚫Hospital- or clinic-based controls are frequently used Research Methods and study design 6/20/2013 54
  • 55.
    How Many Controls? ⚫Case-control studies are often used for uncommon outcomes, ⚫investigators often have a limited number of cases. ⚫In this situation the statistical power of the study can be increased somewhat by enrolling more controls than cases. ⚫Ratios greater than 4:1 have little additional impact on power. ⚫However, if the data on controls is easily obtained, there is no reason to limit the number of controls. ⚫ Can be 1:1, 1:2, 1:3, 1:4 Overview of Study Designs 6/20/2013 55
  • 56.
    Matching ⚫The process ofmaking a study group and a comparison group similar or identical with respect to their distribution of extraneous factors ⚫This can be done by ⚫by individual matching (e.g. for each case, choose a control of the same age and gender) or ⚫by frequency matching (e.g. if there are 25 male cases in the 30- 34 age-group then choose the same number of male controls for this age-group). Overview Epidemiologic Study Designs 6/20/2013 56
  • 57.
    Sources of ExposureInformation ⚫Case–control studies are used to investigate the risk of disease in relation to a wide variety of exposures, ⚫ lifestyle, occupation, environment, genes, diet, reproduction, and the use of medications. ⚫Sources available for obtaining exposure data include ⚫in-person and telephone interviews; ⚫self-administered questionnaires; ⚫preexisting medical, pharmacy, registry, employment, insurance, birth, death, and environmental records; and ⚫biological specimens. Overview Epidemiologic Study Designs 6/20/2013 57
  • 58.
    Odds Ratio ⚫The probabilityof occurrence of an event as compared to the probability of nonoccurrence of an event in a population. ⚫A measure of association typically used to quantify the strength of association between an exposure and an outcome. ⚫It is a measure of the relative magnitude of the odds of exposure among cases and the odds of exposure among controls: Research Methods and study design 6/20/2013 58
  • 59.
    Odds Ratio ⚫ Comparethe odds of those with a disease will have been exposed to the risk factor, with the odds that those without the disease will have been exposed Cases Controls Exposed a b Not exposed c d a+c b+d Odds ratio = a/c = b/d ad bc Research Methods and study design 6/20/2013 59
  • 60.
    Odds Ratio ⚫OR =1 ⚫The odds of exposure among cases = the odds among the controls. ⚫No evident association between exposure and disease. ⚫OR > 1 ⚫ Larger odds of exposure among the cases than among the controls. ⚫Cases have a higher odds of having been exposed in the past. ⚫This situation illustrates a risk factor.With the same reasoning ⚫OR < 1 ⚫Smaller odds of exposure among cases as compared to controls, ⚫Controls have a higher odds of having been exposed. ⚫This situation illustrates a protective factor. Research Methods and study design 6/20/2013 60
  • 61.
    Case-Control Studies ⚫Issues ⚫Definition andselection of cases ⚫ Incident versus prevalent cases ⚫Source of controls: ⚫ hospital, general population, special series ⚫Number of control groups ⚫Case : control ratio ⚫Ascertainment of disease and exposure status Research Methods and study design 6/20/2013 61
  • 62.
    Case-Control Studies Advantages Disadvantages •Short study time. • Less expensive than cohort study. • Good for rare diseases. • Selective recall (Recall bias) • Mortality bias if prevalent rather than incident cases. • Temporal relationship unclear. • Difficulty in defining control group. • Not optimal for rare exposures. Overview of Study Designs 6/20/2013 62
  • 63.
    Example ⚫A case-control studyto assess the relation between stroke and cigarette smoking was conducted. 101 stroke patients were compared with 137 healthy controls. ⚫71 of the stroke patients reported ever smoked compared to 36 of the controls. ⚫Is there is relation between stroke and cigarette smoking? Explain your answer. Research Methods and study design 6/20/2013 63
  • 64.
    Construct a 2x 2 table Calculate the odds ratio (OR) ⚫OR= 71x101/36x30 = 7171/1080=6.6 ⚫Interpretation: stroke patients are 6.6 more probable to have ever smoked compared to controls Stroke +ve Stroke –ve Total Ever smoked +ve 71 36 107 Ever smoked –ve 30 101 131 Total 101 137 238 Research Methods and study design 6/20/2013 64
  • 65.
    Example ⚫A study wasconducted in men aged 40-70 in order to determine whether exercising for 2 or more hours per week decreases the likelihood of heart attack. ⚫ The cases were 1,000 men who had recently had a heart attack; of these, 236 reported that they had regularly exercised for two or more hours per week prior to their heart attack. 1,000 controls were also selected for the study; of these, 379 reported that they exercised regularly. ⚫Calculate the magnitude of association between regular exercise and heart attack ⚫What does your calculation suggest? 6/20/2013 Overview of Study Designs 65
  • 66.
    Construct a 2x 2 table Calculate the odds ratio (OR) ⚫OR= 236x621/746x379 = 146556/289556=0.51 ⚫Interpretation: People who exercise regularly have about 0.5 times the risk of having a heart attack compared to people who don't exercise. MI +ve MI–ve Total Exer > 2hrs +ve 236 379 615 Exer > 2hrs –ve 764 621 1385 Total 1000 1000 2000 Research Methods and study design 6/20/2013 66
  • 67.
    Cross Sectional Studies ResearchMethods and study design 6/20/2013 67
  • 68.
    Cross sectional Studies ⚫“Prevalence study” ⚫Estimate prevalence of disease at a single time point. ⚫Estimate prevalence of risk factors at a single time point. ⚫ provide a "snapshot" of diseases and risk factors simultaneously in a defined population ⚫Estimate association between disease and exposure at a single time point or. ⚫Uses of Cross-Sectional studies: ⚫Burden of illness and risk factors ⚫Service needs ⚫Hypothesis generation Overview of Study Designs 6/20/2013 68
  • 69.
    Cross sectional Studies ⚫Unlikepopulations studied in cohort and case–control studies, cross-sectional study, populations are commonly selected without regard to exposure or disease status. ⚫A snapshot of a population at a single point in time and so measure the exposure prevalence in relation to the disease prevalence. ⚫In other words, current disease status is examined in relation to current exposure level. ⚫(“the lay of the land”) Overview of Study Designs 6/20/2013 69
  • 70.
    Subjects selected for the study Withoutcome Without outcome Time Onset of study No direction of inquiry Research Methods and study design 6/20/2013 70
  • 71.
    Issues in thedesign of C-S studies Choosing a representative sample ⚫A C-S study should be representative of the population ⚫For example, a study of the prevalence of DM among women aged 40-60 years in Town A should comprise a random sample of all women aged 40-60 years in that town. Sample Size ⚫It sufficiently large enough to estimate the prevalence of the conditions of interest with adequate precision. ⚫Sample size calculations can be carried out using sample size tables or statistical packages such as Epi Info. Overview of Study Designs 6/20/2013 71
  • 72.
    Potential bias inC-S studies ⚫Non-response bias ⚫ A particular problem affecting cross-sectional studies and can result in bias of the measures of outcome. ⚫Characteristics of non-responders differ from responders. ⚫/election bias ⚫The selected sample is no representative of the studied population Overview of Study Designs 6/20/2013 72
  • 73.
    Analysis of cross-sectionalstudies ⚫All factors (exposure, outcome, and confounders) are measured simultaneously. ⚫The main outcome measure obtained from a cross- sectional study is prevalence: ⚫In analytical cross-sectional studies, the OR can be used to assess the strength of an association between a risk factor and health outcome of interest Overview of Study Designs 6/20/2013 73
  • 74.
    Cross sectional Studies AdvantagesDisadvantages ⚫Quick and cheap ⚫Able to measure prevalence for all factors under investigation ⚫Multiple outcomes and exposures can be studied ⚫Examine associations ⚫Good for generating hypotheses ⚫Snapshot in time ⚫Temporal associations not clear ⚫Selection bias ⚫Over-representation of cases with long duration ⚫Underestimate of cases with short duration. ⚫Shows association, not causality Overview of Study Designs 6/20/2013 74
  • 75.
    Example ⚫1000 people wereselected, among them 100 were found positive for CHD. Among the 750 who reported that they are active, 50 are CHD present ⚫P1= a/a+b= 50/250 = 20% prevalence of CHD among people who are not active. ⚫P0= c/c+d = 50/750 = 6.7% prevalence of CHD among people who are active. Present CHD Absent CHD Not Active (a) 50 (b) 200 250 Active (c) 50 (d) 700 750 100 900 1000 Research Methods and study design 6/20/201 3 75
  • 76.
    ⚫ Ultrasonography ofthe gallbladder of 2200 study subjects identified 152 subjects with gallstones, 42 of whom listed their alcohol consumption level as "high". Of the men without gallstones, 220 listed their alcohol level as "high". Interviews were conducted at the same time as the examinations to determine the exposure level of study participants. ⚫ What is the prevalence of gallstone among high alcohol +ve ⚫ What is the prevalence of gallstone among high alcohol -ve ⚫ What is the prevalence of gallstone in the studded sample ⚫ What is the POR A hypothetical study of the effect of alcohol intake on the risk of gallstones was conducted. Research Methods and study design 6/20/201 3 76
  • 77.
    ⚫P1= a/a+b= 42/262= 19.9% prevalence of GS among people who reported +ve high alcohol consumption. ⚫P0= c/c+d = 110/1938 = 5.7% prevalence of GS among people who reported –ve high alcohol consumption. ⚫The total prevalence= 152/2200=6.9% ⚫OR= 42X1828/220X110= 3.2 Gs +ve GS -ve Alcohol +ve 42 220 262 Alcohol –ve 110 1828 1938 152 2048 2200 Research Methods and study design 6/20/201 3 77
  • 78.
    Research Methods andstudy design 6/20/201 3 78