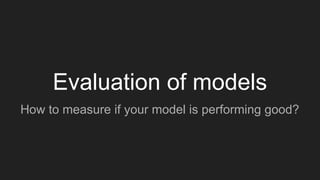
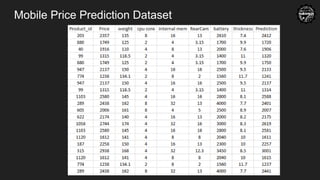
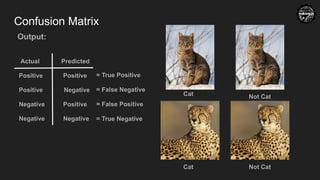
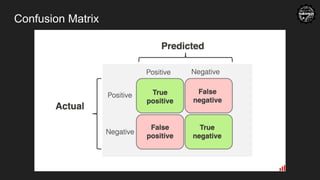
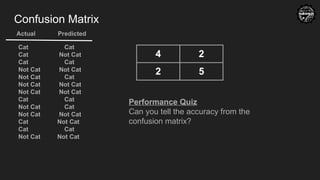
Confusion Matrix
4 2
25
Actual Predicted
Cat Cat
Cat Not Cat
Cat Cat
Not Cat Not Cat
Not Cat Cat
Not Cat Not Cat
Not Cat Not Cat
Cat Cat
Not Cat Cat
Not Cat Not Cat
Cat Not Cat
Cat Cat
Not Cat Not Cat
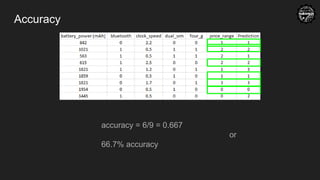
Performance Quiz
Can you tell the accuracy from the
confusion matrix?
10.
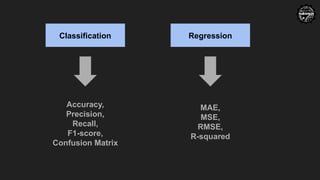
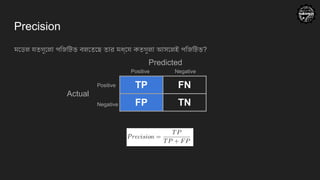
Precision
মডেল যতগুলো পজিটিভবলতেছে তার মধ্যে কতগুলা আসলেই পজিটিভ?
TP FN
FP TN
Predicted
Actual
Positive Negative
Positive
Negative
11.
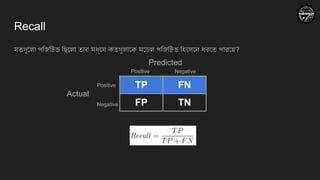
Recall
যতগুলো পজিটিভ ছিলোতার মধ্যে কতগুলাকে মডেল পজিটিভ হিসেবে ধরতে পারছে?
TP FN
FP TN
Predicted
Actual
Positive Negative
Positive
Negative
12.
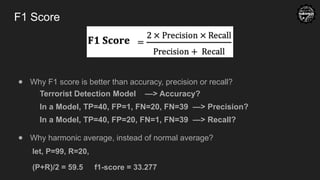
F1 Score
● WhyF1 score is better than accuracy, precision or recall?
Terrorist Detection Model —> Accuracy?
In a Model, TP=40, FP=1, FN=20, FN=39 —> Precision?
In a Model, TP=40, FP=20, FN=1, FN=39 —> Recall?
● Why harmonic average, instead of normal average?
let, P=99, R=20,
(P+R)/2 = 59.5 f1-score = 33.277
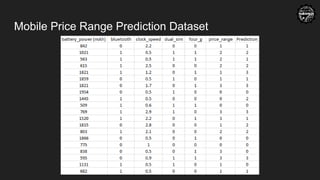
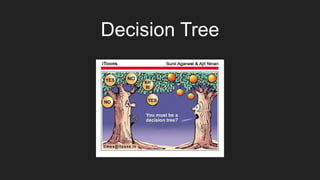
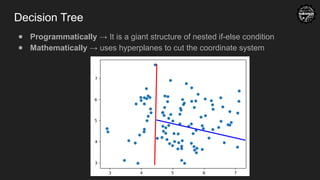
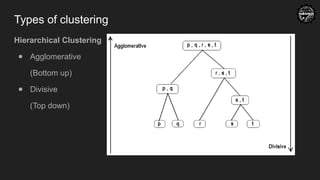
Decision Tree
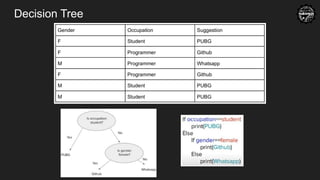
● Programmatically→ It is a giant structure of nested if-else condition
● Mathematically → uses hyperplanes to cut the coordinate system
16.
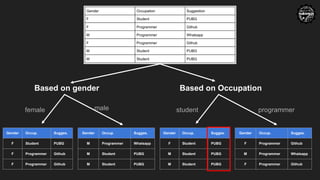
Based on gender
GenderOccup. Sugges.
F Student PUBG
F Programmer Github
F Programmer Github
Gender Occup. Sugges.
M Programmer Whatsapp
M Student PUBG
M Student PUBG
Based on Occupation
Gender Occup. Sugges.
F Student PUBG
M Student PUBG
M Student PUBG
Gender Occup. Sugges.
F Programmer Github
M Programmer Whatsapp
F Programmer Github
female male student programmer
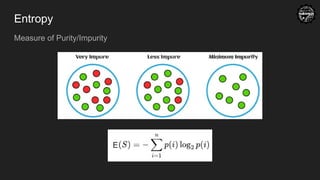
Entropy
Gender Occup. Sugges.
FStudent PUBG
F Programmer Github
F Programmer Github
Gender Occup. Sugges.
M Programmer Whatsapp
M Student PUBG
M Student PUBG
Gender Occup. Sugges.
F Student PUBG
M Student PUBG
M Student PUBG
Gender Occup. Sugges.
F Programmer Github
M Programmer Whatsapp
F Programmer Github
- ⅓ log ⅓ - ⅔ log ⅔
= 0.52
- ⅓ log ⅓ - ⅔ log ⅔
= 0.52
- 3/3 log 3/3
= 0
- ⅓ log ⅓ - ⅔ log ⅔
= 0.52
19.
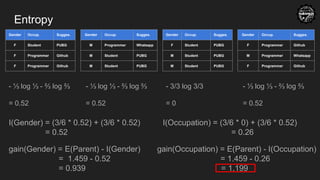
Calculating using InformationGain
Information Gain measures the quality of a split.
● Step-1: Calculate Entropy of the parent
E(Parent) = - 1/6 log 1/6 - 2/6 log 2/6 - 3/6 log 3/6 = 1.459
● Step-2: Calculate Entropy of the Children
[done in previous slide]
● Step-3: Calculate Information I of Children
20.
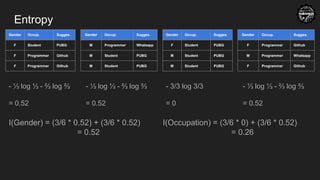
Entropy
Gender Occup. Sugges.
FStudent PUBG
F Programmer Github
F Programmer Github
Gender Occup. Sugges.
M Programmer Whatsapp
M Student PUBG
M Student PUBG
Gender Occup. Sugges.
F Student PUBG
M Student PUBG
M Student PUBG
Gender Occup. Sugges.
F Programmer Github
M Programmer Whatsapp
F Programmer Github
- ⅓ log ⅓ - ⅔ log ⅔
= 0.52
- ⅓ log ⅓ - ⅔ log ⅔
= 0.52
- 3/3 log 3/3
= 0
- ⅓ log ⅓ - ⅔ log ⅔
= 0.52
I(Gender) = (3/6 * 0.52) + (3/6 * 0.52)
= 0.52
I(Occupation) = (3/6 * 0) + (3/6 * 0.52)
= 0.26
21.
Calculating using InformationGain
Information Gain measures the quality of a split.
● Step-1: Calculate Entropy of the parent
E(Parent) = - 1/6 log 1/6 - 2/6 log 2/6 - 3/6 log 3/6 = 1.459
● Step-2: Calculate Entropy of the Children
[done in previous slide]
● Step-3: Calculate Information I of Children
● Step-4: Calculate Gain for the Children
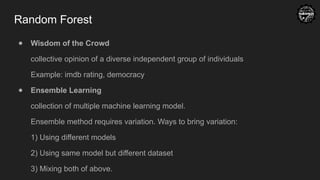
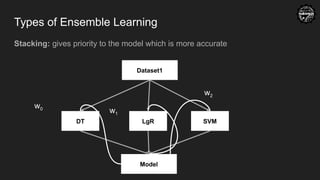
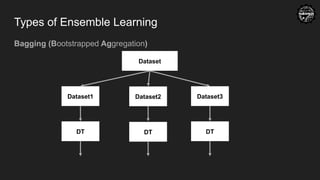
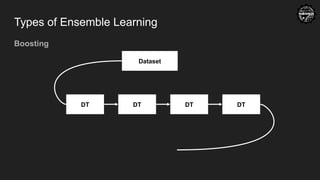
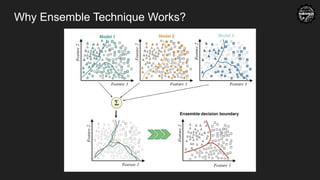
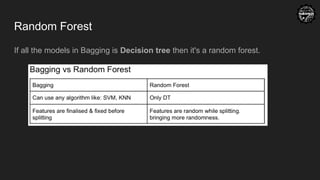
Random Forest
● Wisdomof the Crowd
collective opinion of a diverse independent group of individuals
Example: imdb rating, democracy
● Ensemble Learning
collection of multiple machine learning model.
Ensemble method requires variation. Ways to bring variation:
1) Using different models
2) Using same model but different dataset
3) Mixing both of above.
Random Forest
If allthe models in Bagging is Decision tree then it's a random forest.
32.
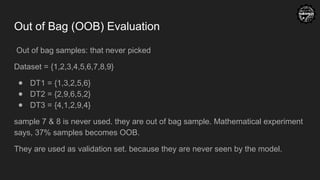
Out of Bag(OOB) Evaluation
Out of bag samples: that never picked
Dataset = {1,2,3,4,5,6,7,8,9}
● DT1 = {1,3,2,5,6}
● DT2 = {2,9,6,5,2}
● DT3 = {4,1,2,9,4}
sample 7 & 8 is never used. they are out of bag sample. Mathematical experiment
says, 37% samples becomes OOB.
They are used as validation set. because they are never seen by the model.
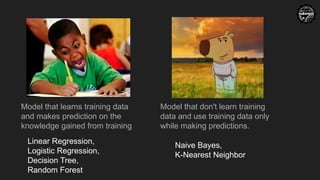
Model that learnstraining data
and makes prediction on the
knowledge gained from training
Model that don't learn training
data and use training data only
while making predictions.
Linear Regression,
Logistic Regression,
Decision Tree,
Random Forest
Naive Bayes,
K-Nearest Neighbor
35.
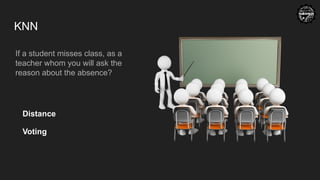
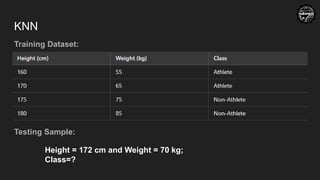
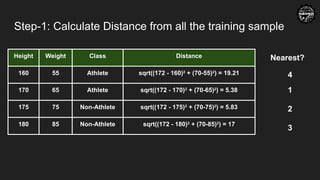
KNN
If a studentmisses class, as a
teacher whom you will ask the
reason about the absence?
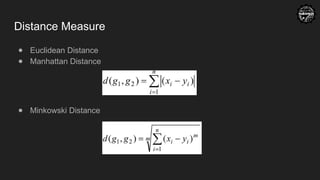
Distance
Voting
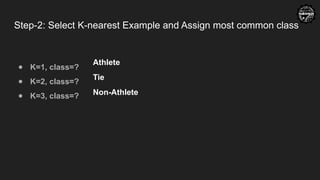
Step-2: Select K-nearestExample and Assign most common class
● K=1, class=?
● K=2, class=?
● K=3, class=?
Athlete
Tie
Non-Athlete
39.
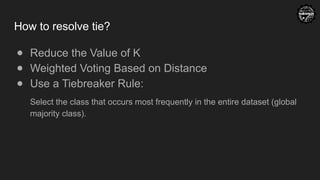
How to resolvetie?
● Reduce the Value of K
● Weighted Voting Based on Distance
● Use a Tiebreaker Rule:
Select the class that occurs most frequently in the entire dataset (global
majority class).
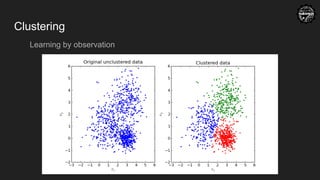
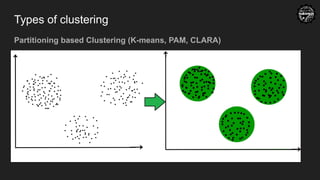
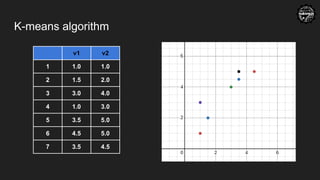
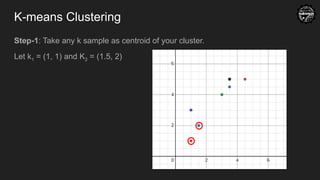
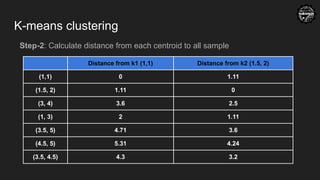
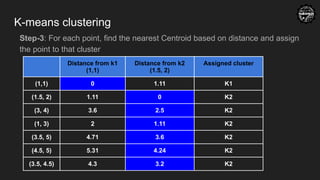
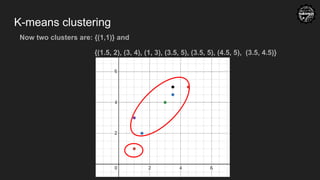
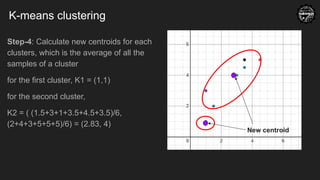
K-means clustering
Step-4: Calculatenew centroids for each
clusters, which is the average of all the
samples of a cluster
for the first cluster, K1 = (1,1)
for the second cluster,
K2 = ( (1.5+3+1+3.5+4.5+3.5)/6,
(2+4+3+5+5+5)/6) = (2.83, 4)
New centroid
53.
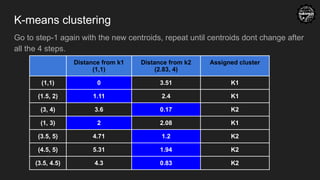
K-means clustering
Go tostep-1 again with the new centroids, repeat until centroids dont change after
all the 4 steps.
Distance from k1
(1,1)
Distance from k2
(2.83, 4)
Assigned cluster
(1,1) 0 3.51 K1
(1.5, 2) 1.11 2.4 K1
(3, 4) 3.6 0.17 K2
(1, 3) 2 2.08 K1
(3.5, 5) 4.71 1.2 K2
(4.5, 5) 5.31 1.94 K2
(3.5, 4.5) 4.3 0.83 K2
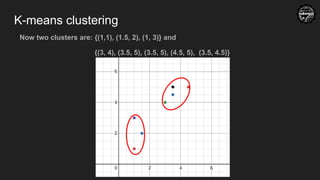
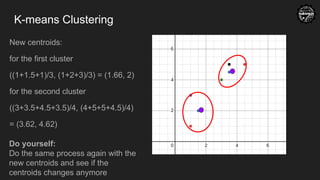
K-means Clustering
New centroids:
forthe first cluster
((1+1.5+1)/3, (1+2+3)/3) = (1.66, 2)
for the second cluster
((3+3.5+4.5+3.5)/4, (4+5+5+4.5)/4)
= (3.62, 4.62)
Do yourself:
Do the same process again with the
new centroids and see if the
centroids changes anymore

![Calculating using Information Gain
Information Gain measures the quality of a split.
● Step-1: Calculate Entropy of the parent
E(Parent) = - 1/6 log 1/6 - 2/6 log 2/6 - 3/6 log 3/6 = 1.459
● Step-2: Calculate Entropy of the Children
[done in previous slide]
● Step-3: Calculate Information I of Children](https://image.slidesharecdn.com/overviewofmachinelearningpart-2-250508192619-ad38e74e/85/Overview-of-Machine-Learning-Part-2-pptx-19-320.jpg)
![Calculating using Information Gain
Information Gain measures the quality of a split.
● Step-1: Calculate Entropy of the parent
E(Parent) = - 1/6 log 1/6 - 2/6 log 2/6 - 3/6 log 3/6 = 1.459
● Step-2: Calculate Entropy of the Children
[done in previous slide]
● Step-3: Calculate Information I of Children
● Step-4: Calculate Gain for the Children](https://image.slidesharecdn.com/overviewofmachinelearningpart-2-250508192619-ad38e74e/85/Overview-of-Machine-Learning-Part-2-pptx-21-320.jpg)


![[ppt]](https://cdn.slidesharecdn.com/ss_thumbnails/ppt2931-thumbnail.jpg?width=640&height=640&fit=bounds)
![[ppt]](https://cdn.slidesharecdn.com/ss_thumbnails/ppt3441-thumbnail.jpg?width=640&height=640&fit=bounds)


