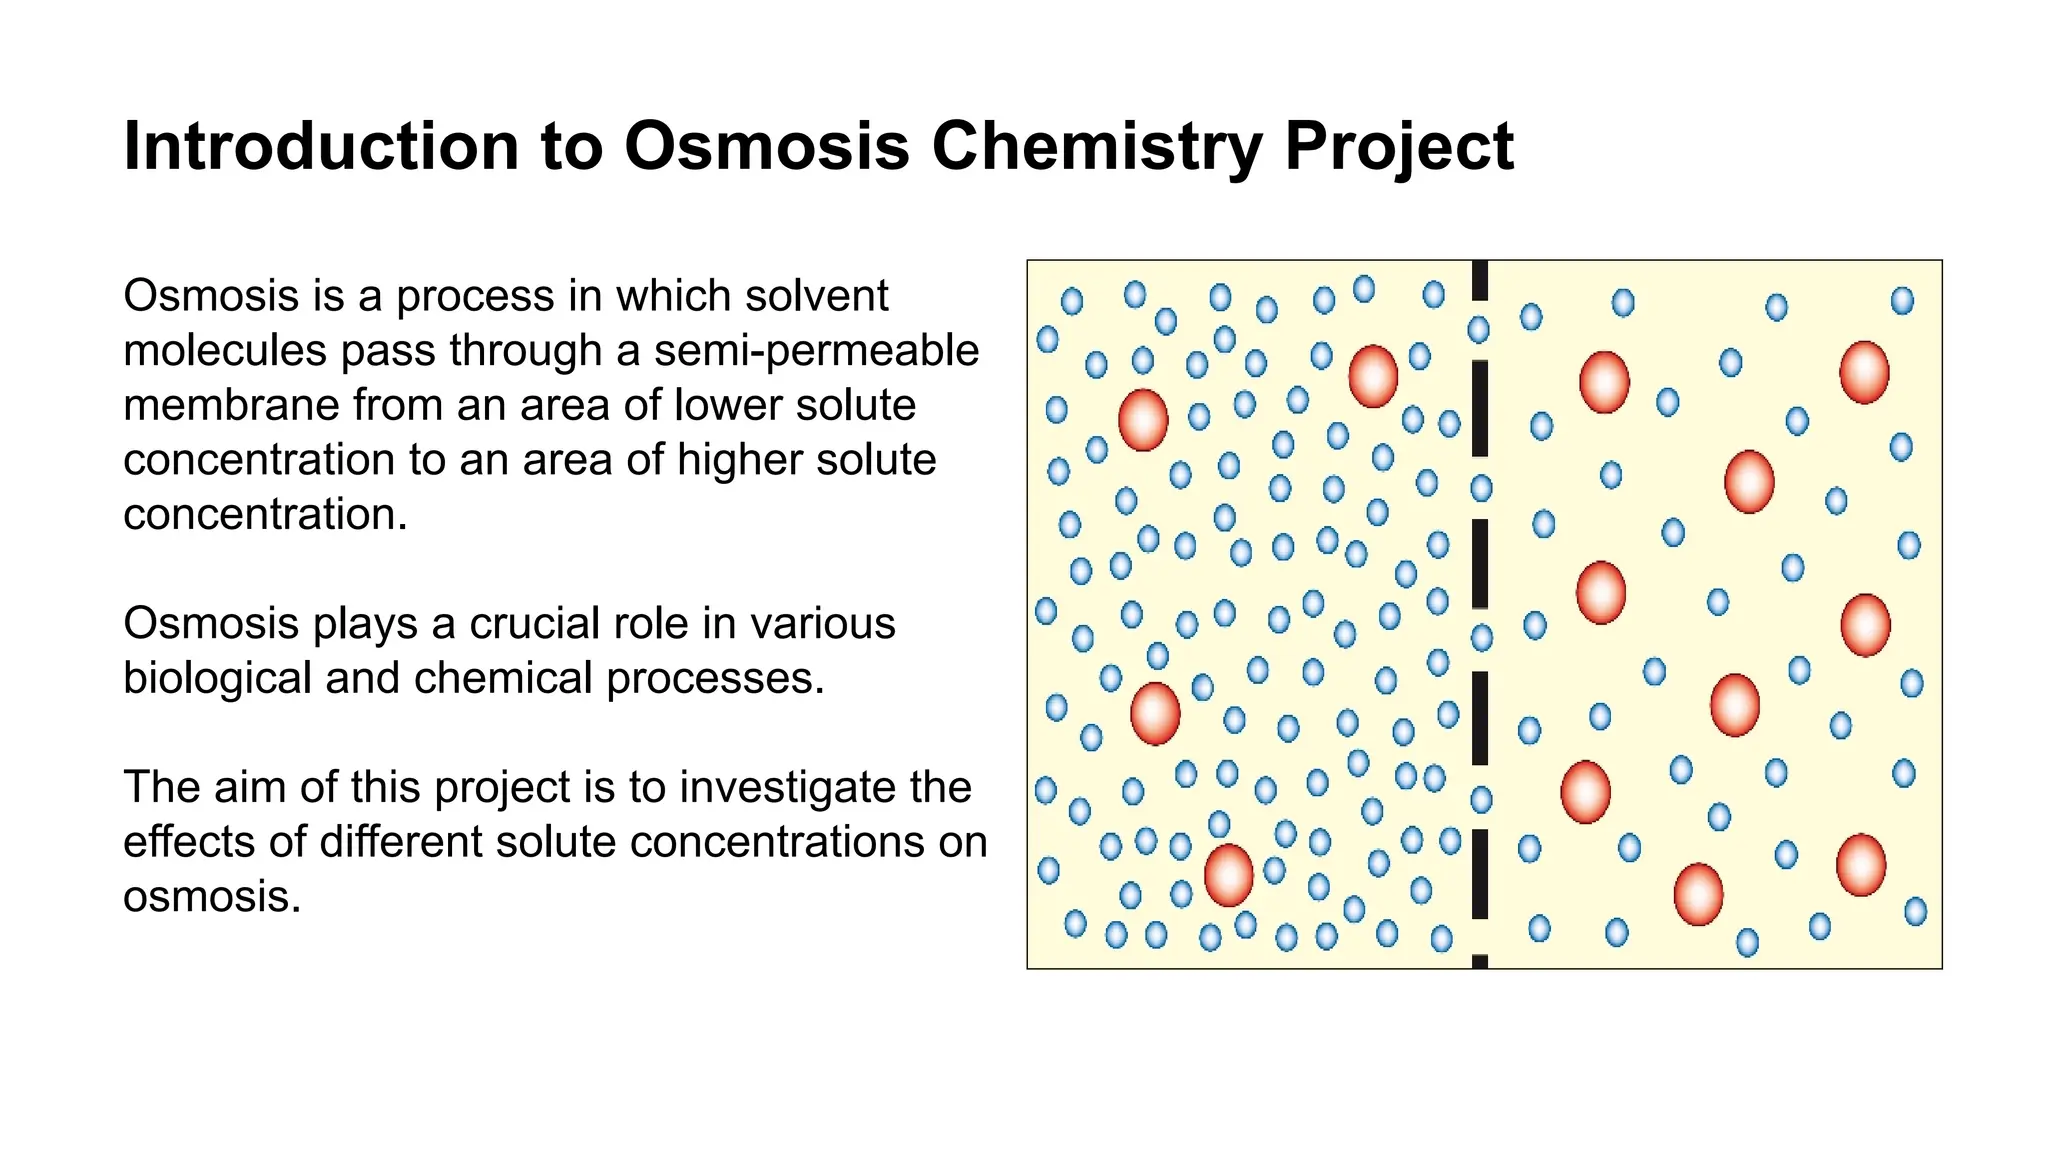
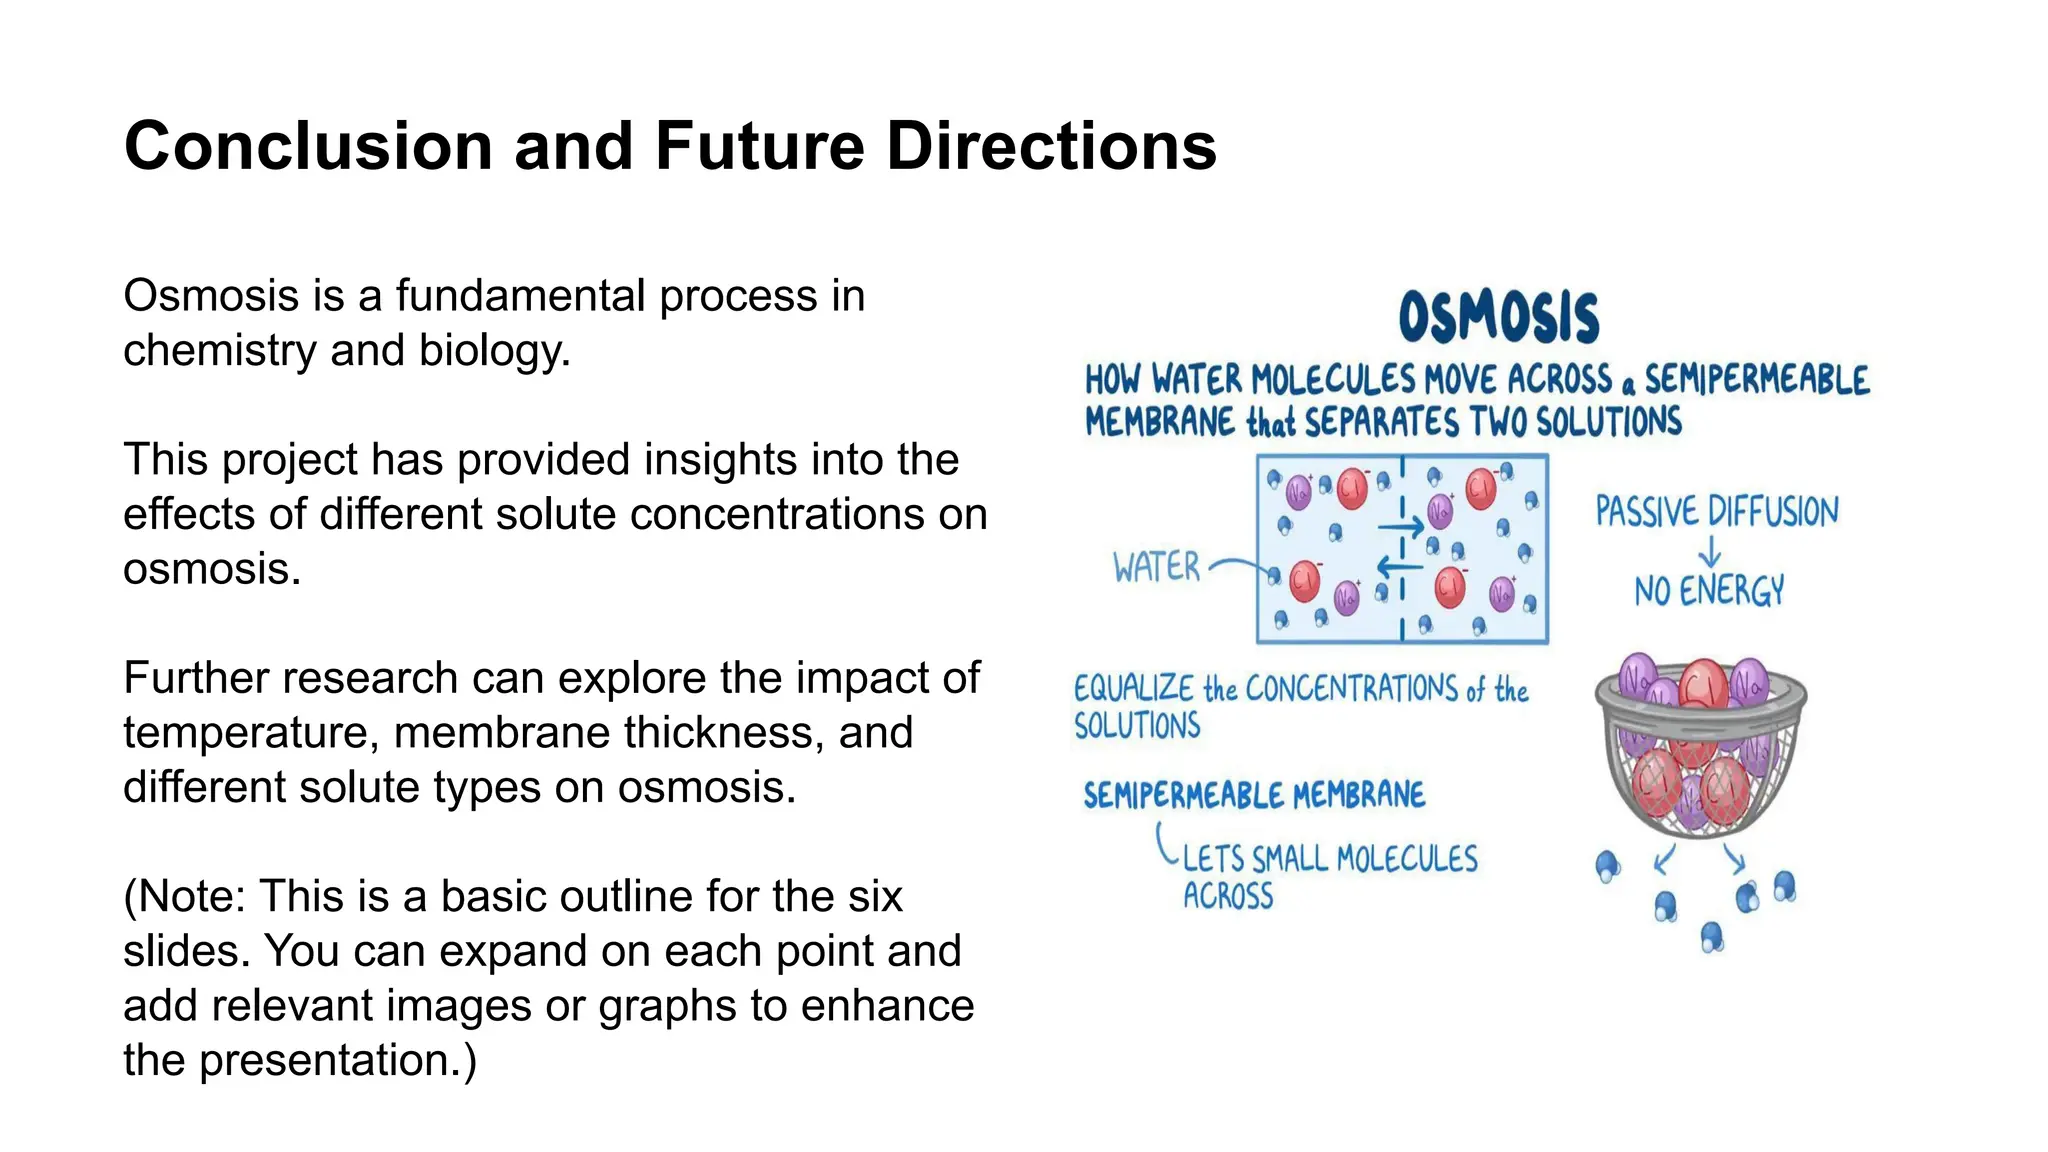
2. Introduction to Osmosis Chemistry Project
Osmosis is a process in which solvent
molecules pass through a semi-permeable
membrane from an area of lower solute
concentration to an area of higher solute
concentration.
Osmosis plays a crucial role in various
biological and chemical processes.
The aim of this project is to investigate the
effects of different solute concentrations on
osmosis.
3. Materials and Methods
Materials: Semi-permeable membrane,
beakers, solute solutions of varying
concentrations, distilled water, measuring
equipment.
Method: Set up a series of beakers with
different solute concentrations, place the
semi-permeable membrane in each beaker,
measure and record the initial and final
volumes of solvent, calculate the rate of
osmosis.
Your third bullet
4. Experimental Results
The rate of osmosis increases with an
increase in solute concentration.
The final volume of solvent decreases as
the solute concentration increases.
Distilled water shows the highest rate of
osmosis and the highest final volume of
solvent.
5. Analysis and Discussion
Osmosis is driven by the concentration
gradient between the two sides of the
membrane.
The movement of solvent molecules occurs
in order to equalize the concentration on
both sides.
The results indicate that osmosis is a
crucial process for maintaining balance in
biological systems.
6. Applications of Osmosis Chemistry
Osmosis is essential for maintaining proper
hydration in living organisms.
It is used in water purification processes to
remove impurities and contaminants.
Osmosis has applications in industries such
as food preservation and pharmaceuticals.
7. Conclusion and Future Directions
Osmosis is a fundamental process in
chemistry and biology.
This project has provided insights into the
effects of different solute concentrations on
osmosis.
Further research can explore the impact of
temperature, membrane thickness, and
different solute types on osmosis.
(Note: This is a basic outline for the six
slides. You can expand on each point and
add relevant images or graphs to enhance
the presentation.)