Download to read offline
![International Journal of Computer Science & Engineering Survey (IJCSES) Vol.8, No.2, April 2017
14
2. RELATIVE WORKS
Canny and other types of edges detection techniques are used by the researcher inside other type
of image processing detection methods in their works, as mentioned before, these methods can be
used individually or with others, the canny edge detection is an operator developed by John F.
Canny, it is used for purpose of detection, it uses a multi stage algorithm type [7]. The Sobel
technique which is mostly named the sobel filter or sobel-Feldman operator is presented by Irwin
Sobel in 1968, it is used in computer vision and also image processing detection algorithms [11],
it is really a discrete differentiation technique, it can compute the gradient of the intensity
function of the image, in this type, each point or pixel inside the image is corresponded as a
gradient vector or norm to it. The prewitt operator [12] which is presented by Judith M.S. Prewitt
is found the edges using the prewitt approximation to the derivative. In most of the works today,
many proposed methods merged between two or more methods to present new techniques with
many enhancements, other researches are done depending on a comparison between many
methods over the same material (objects). In [1], Min. C. Shin and et.al a comparison between
the edges detection techniques is done. They used the structure from motion (SMF) to do an
evaluation over the algorithms of edges detections. The obtained results suggested that the ratings
of the canny detector performance is based on the pixel level matrices and also on the SFM are
related one to each other and have high performance like canny and other detectors. In [2], Sayed
Jahanzeb Hussien Pirzada and et.al are enhanced the edges detection techniques using low pass
filter inside the canny edge detection, this algorithm is used as a features extraction, the extracted
features are not same when its captured from different directions. In this work, a study of an
orientation’s effectiveness for the detected objects is done, assumed that the objects images are
captured from many sides; many edges types are applied for these images with which are content
same shape objects with different colors. In [3], Andrew H. S Lai, and Nelson H. C. Yung are
presented a novel method for lane algorithm detection used for surveillance traffics tracking, they
tried to isolate one path from all the captured image then surrounding or mask the car needed to
be detected or tracked from the other parts, also used to notes any sudden changes or movements,
the edges techniques are used here and the orientation is detected during the detection and
tracking tackle, most of the time when the objects are detected more one time with many
orientations, the shapes and also number of pixels those extracted are not the same. Another study
for the orientation inside the colors is done by Viswanath Gopalakrishnan, Yiquan Hu, and Deepu
Rajan [4], they used the detection framework which is based on both color and orientation those
distributed in image, the orientation framework is used to detect regions in images based on
global and local behaviour of different orientations in images. In robotics field when an objects
sometime has to be gripped by the fingers of the robots, it is very important to know the
orientation of it to rotate the robot arm according to that and catch it, In [5], a study for a mobile
cleaning robot is done to measure the error in orientation, a new method is used to reduce the
error in localization. In this paper , after studied the ideas given before, a new study for the
orientation effectiveness is used to compare between many edges detection techniques when the
same regions are detected from different sides, this rule is applied for the areas of detected objects
used these many edges techniques.
2.1. Canny Edge Detection Technique
The canny edge detection is an operator or technique used for extracting the useful information
and structures details from different vision’s object, canny and the other type of edges techniques
can reduce the amount of data to be processed. The canny algorithm includes applying the
Gaussian filter which is used to smooth the image to remove the noisy parts, find the image
gradients’ intensity, applying the non-maximum type of suppression for the purpose of liquidation
for the response’s spurious to the edge detection, duplicate the normal value of threshold and
finally using the hysteresis to track the edge [7].](https://image.slidesharecdn.com/8217ijcses02-241211120841-03bb379f/75/ORIENTATION-EFFECTIVENESS-IN-THE-OBJECTS-DETECTED-AREAS-USING-DIFFERENT-TYPES-OF-EDGES-DETECTION-TECHNIQUES-2-2048.jpg)
![International Journal of Computer Science & Engineering Survey (IJCSES) Vol.8, No.2, April 2017
15
2.2. Sobel Edge Detection Technique
Sobel filter or as it is sometime called Sobel- Feldman operator, is a type of edges techniques
used in image processing and also in computer vision, this type consist of two separated
operations: the first one make a smoothing to be perpendicular to the direction that is derivative
with a triangle filter, the second one is the central simple difference in the derivative direction, the
Sobel operator can reduce the artifacts that is associated with the pure central operator’s
differences, but it does not have a perfect rotational symmetry. So this is a disadvantage of using
it [8].
2.3. Laplace Edge Detection Technique
The Laplace detector or as it is named the Laplacian operator is mostly represented as a blob
detector that is used in computer vision field for the purpose of regions detection in digital
captured images from a real or offline video (recorded video), this type of operators is used in this
paper as one of many techniques applied for the purpose of orientation effectiveness.
2.4. Prewitt Edge Detection Technique
It is a discrete differentiation technique or operator that includes computing the gradient
approximately for the image intensity function, this operator is usually based on convolving the
used image with a separable, small, and integer filter value in both horizontal and vertical
directions, it like Sobel operator in that it is inexpensive in computations relatively.
3. WORK AND RESULTS
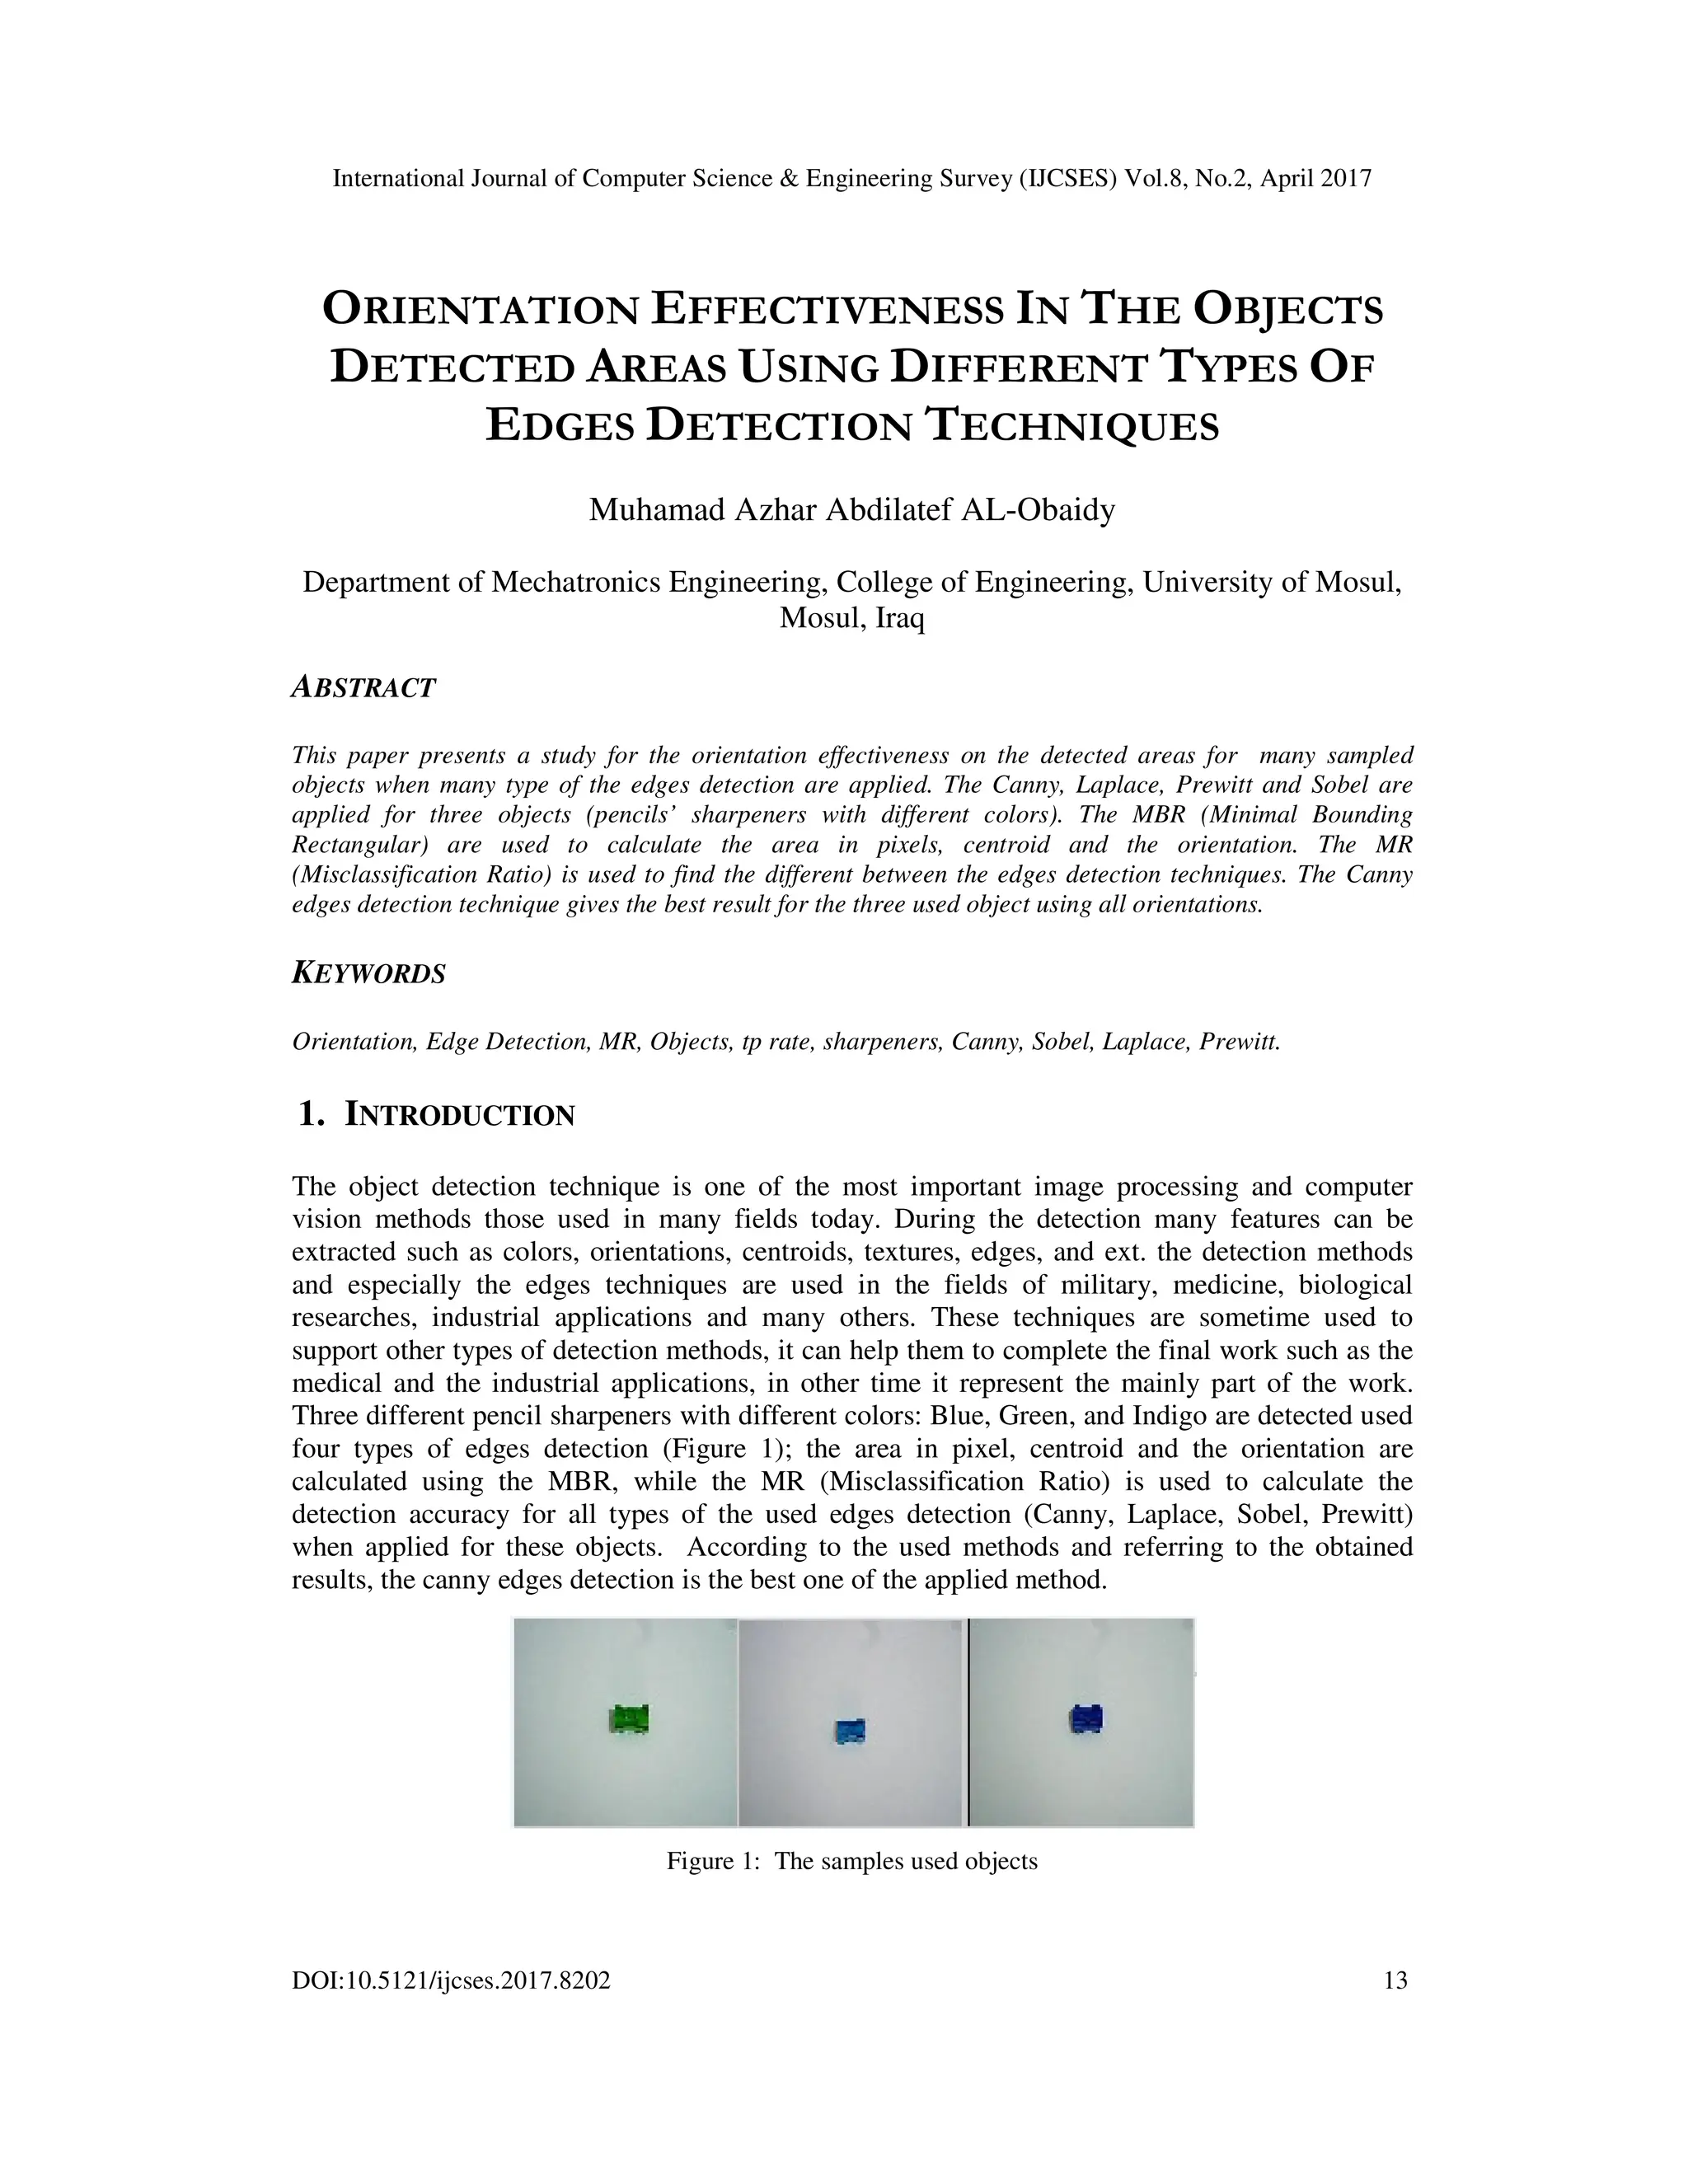
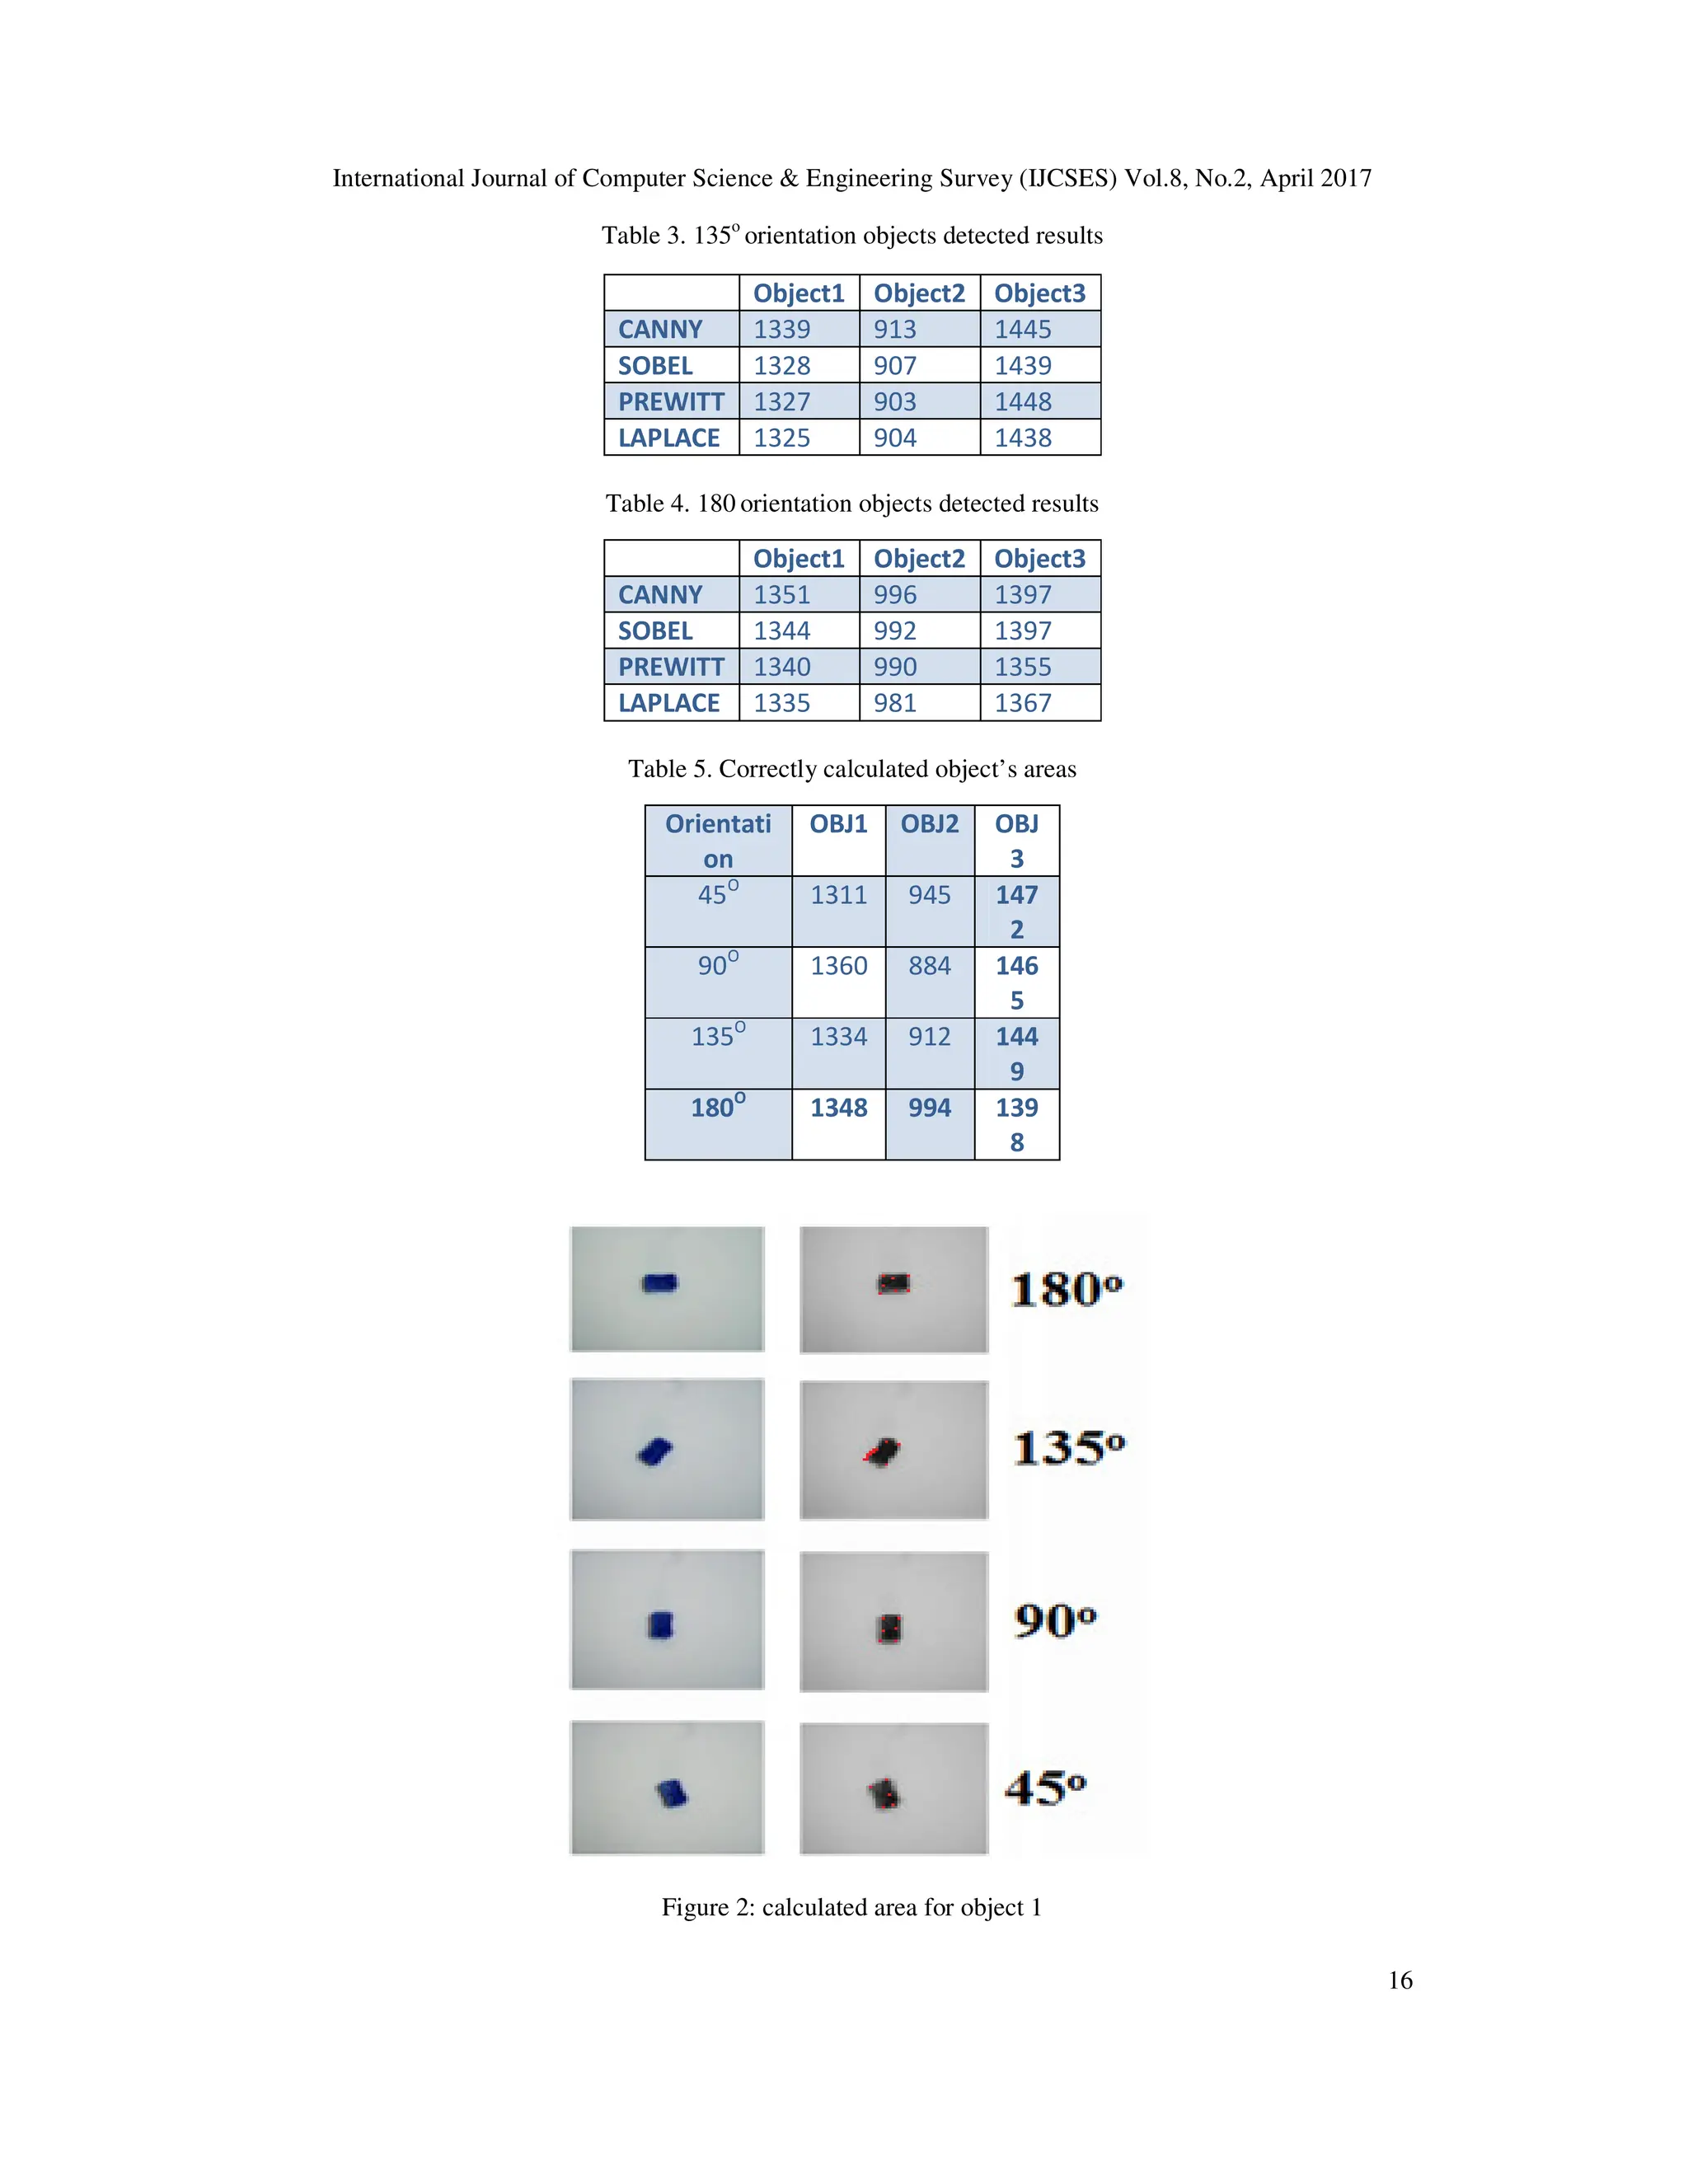
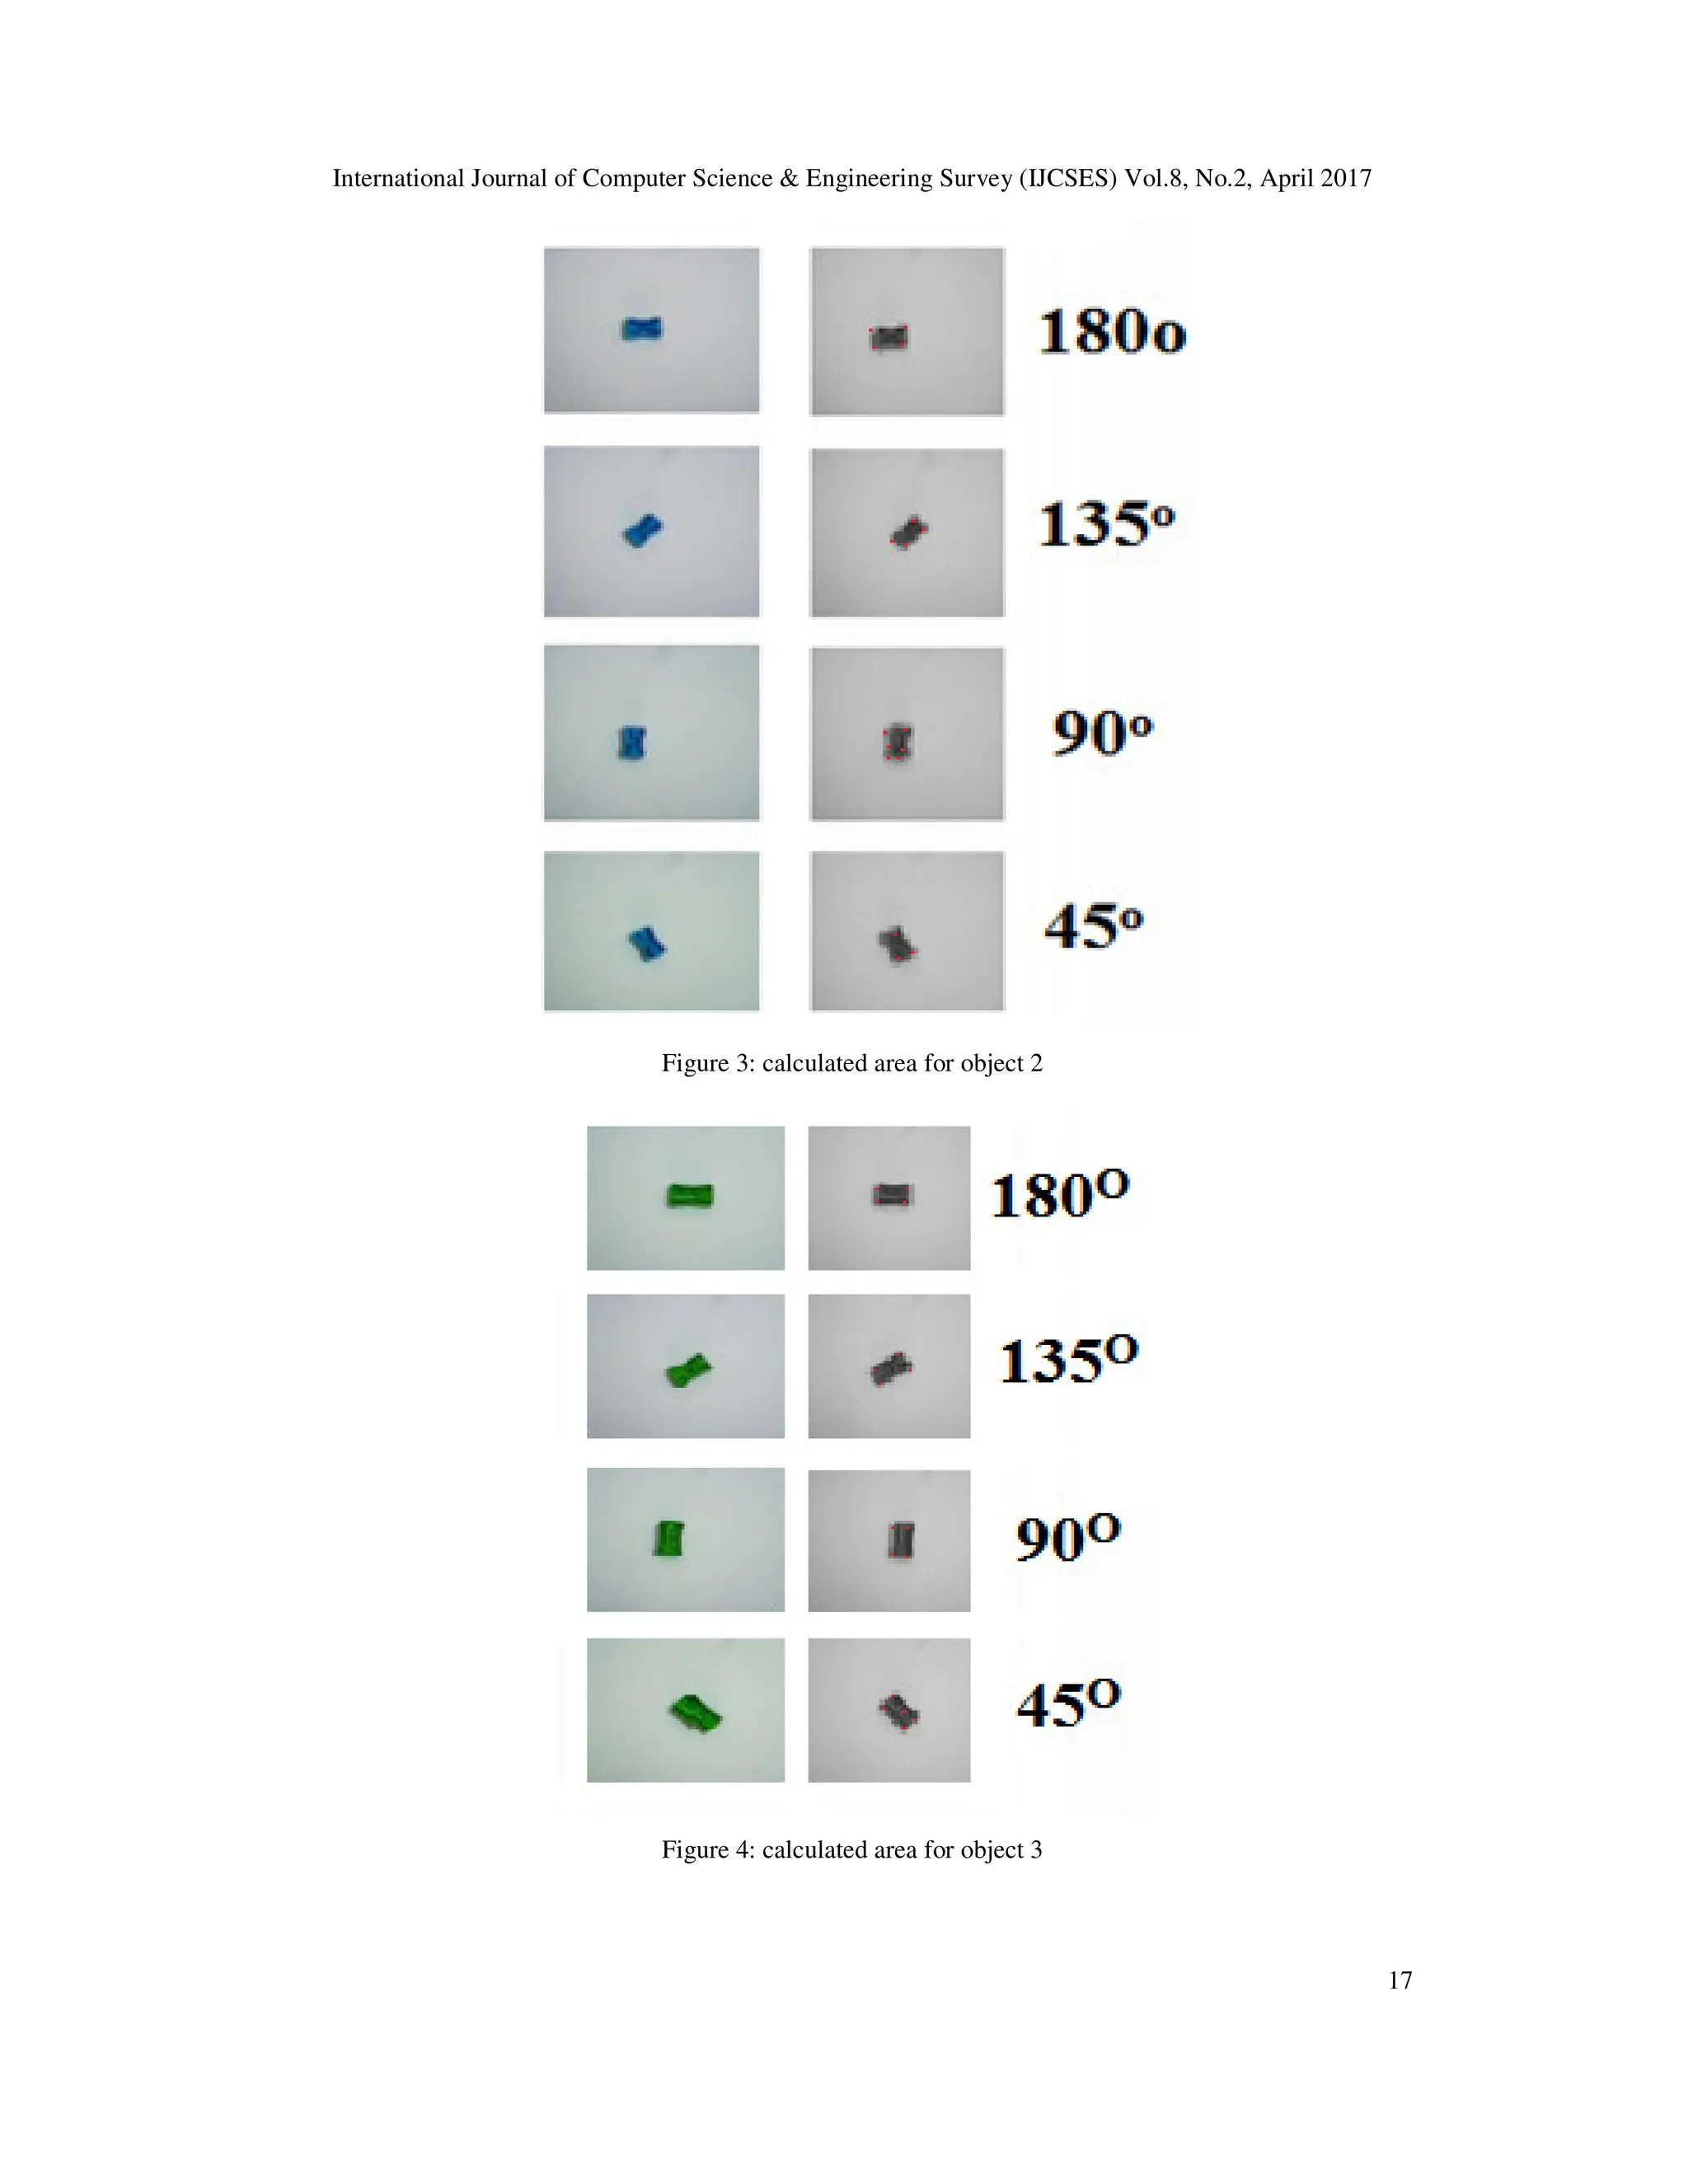
In this paper, canny, Sobel, Prewitt, and Laplace edges detection methods are applied for three
colors of a pencil sharpener (light blue - dark blue - green), each of these three sharpeners are
captured in many orientations: (45o, 90o, 135o, 180o), figures (2-4), includes the area in pixels
which are detected for three sharpeners with all the four mentioned orientations after applying the
edges. The MBR is used to get the wanted orientation exactly, The purpose of this operation is to
see if the changes in orientations may cause effects in detection (the edges techniques) or not, and
to see also which type of edges techniques has the less effectiveness when the orientation is
changed, the following tables (1 - 4) are included the areas detected using the edges detection
techniques for the sharpeners in all orientations cases, table 5 includes the correctly calculated
areas before applying the edges techniques.
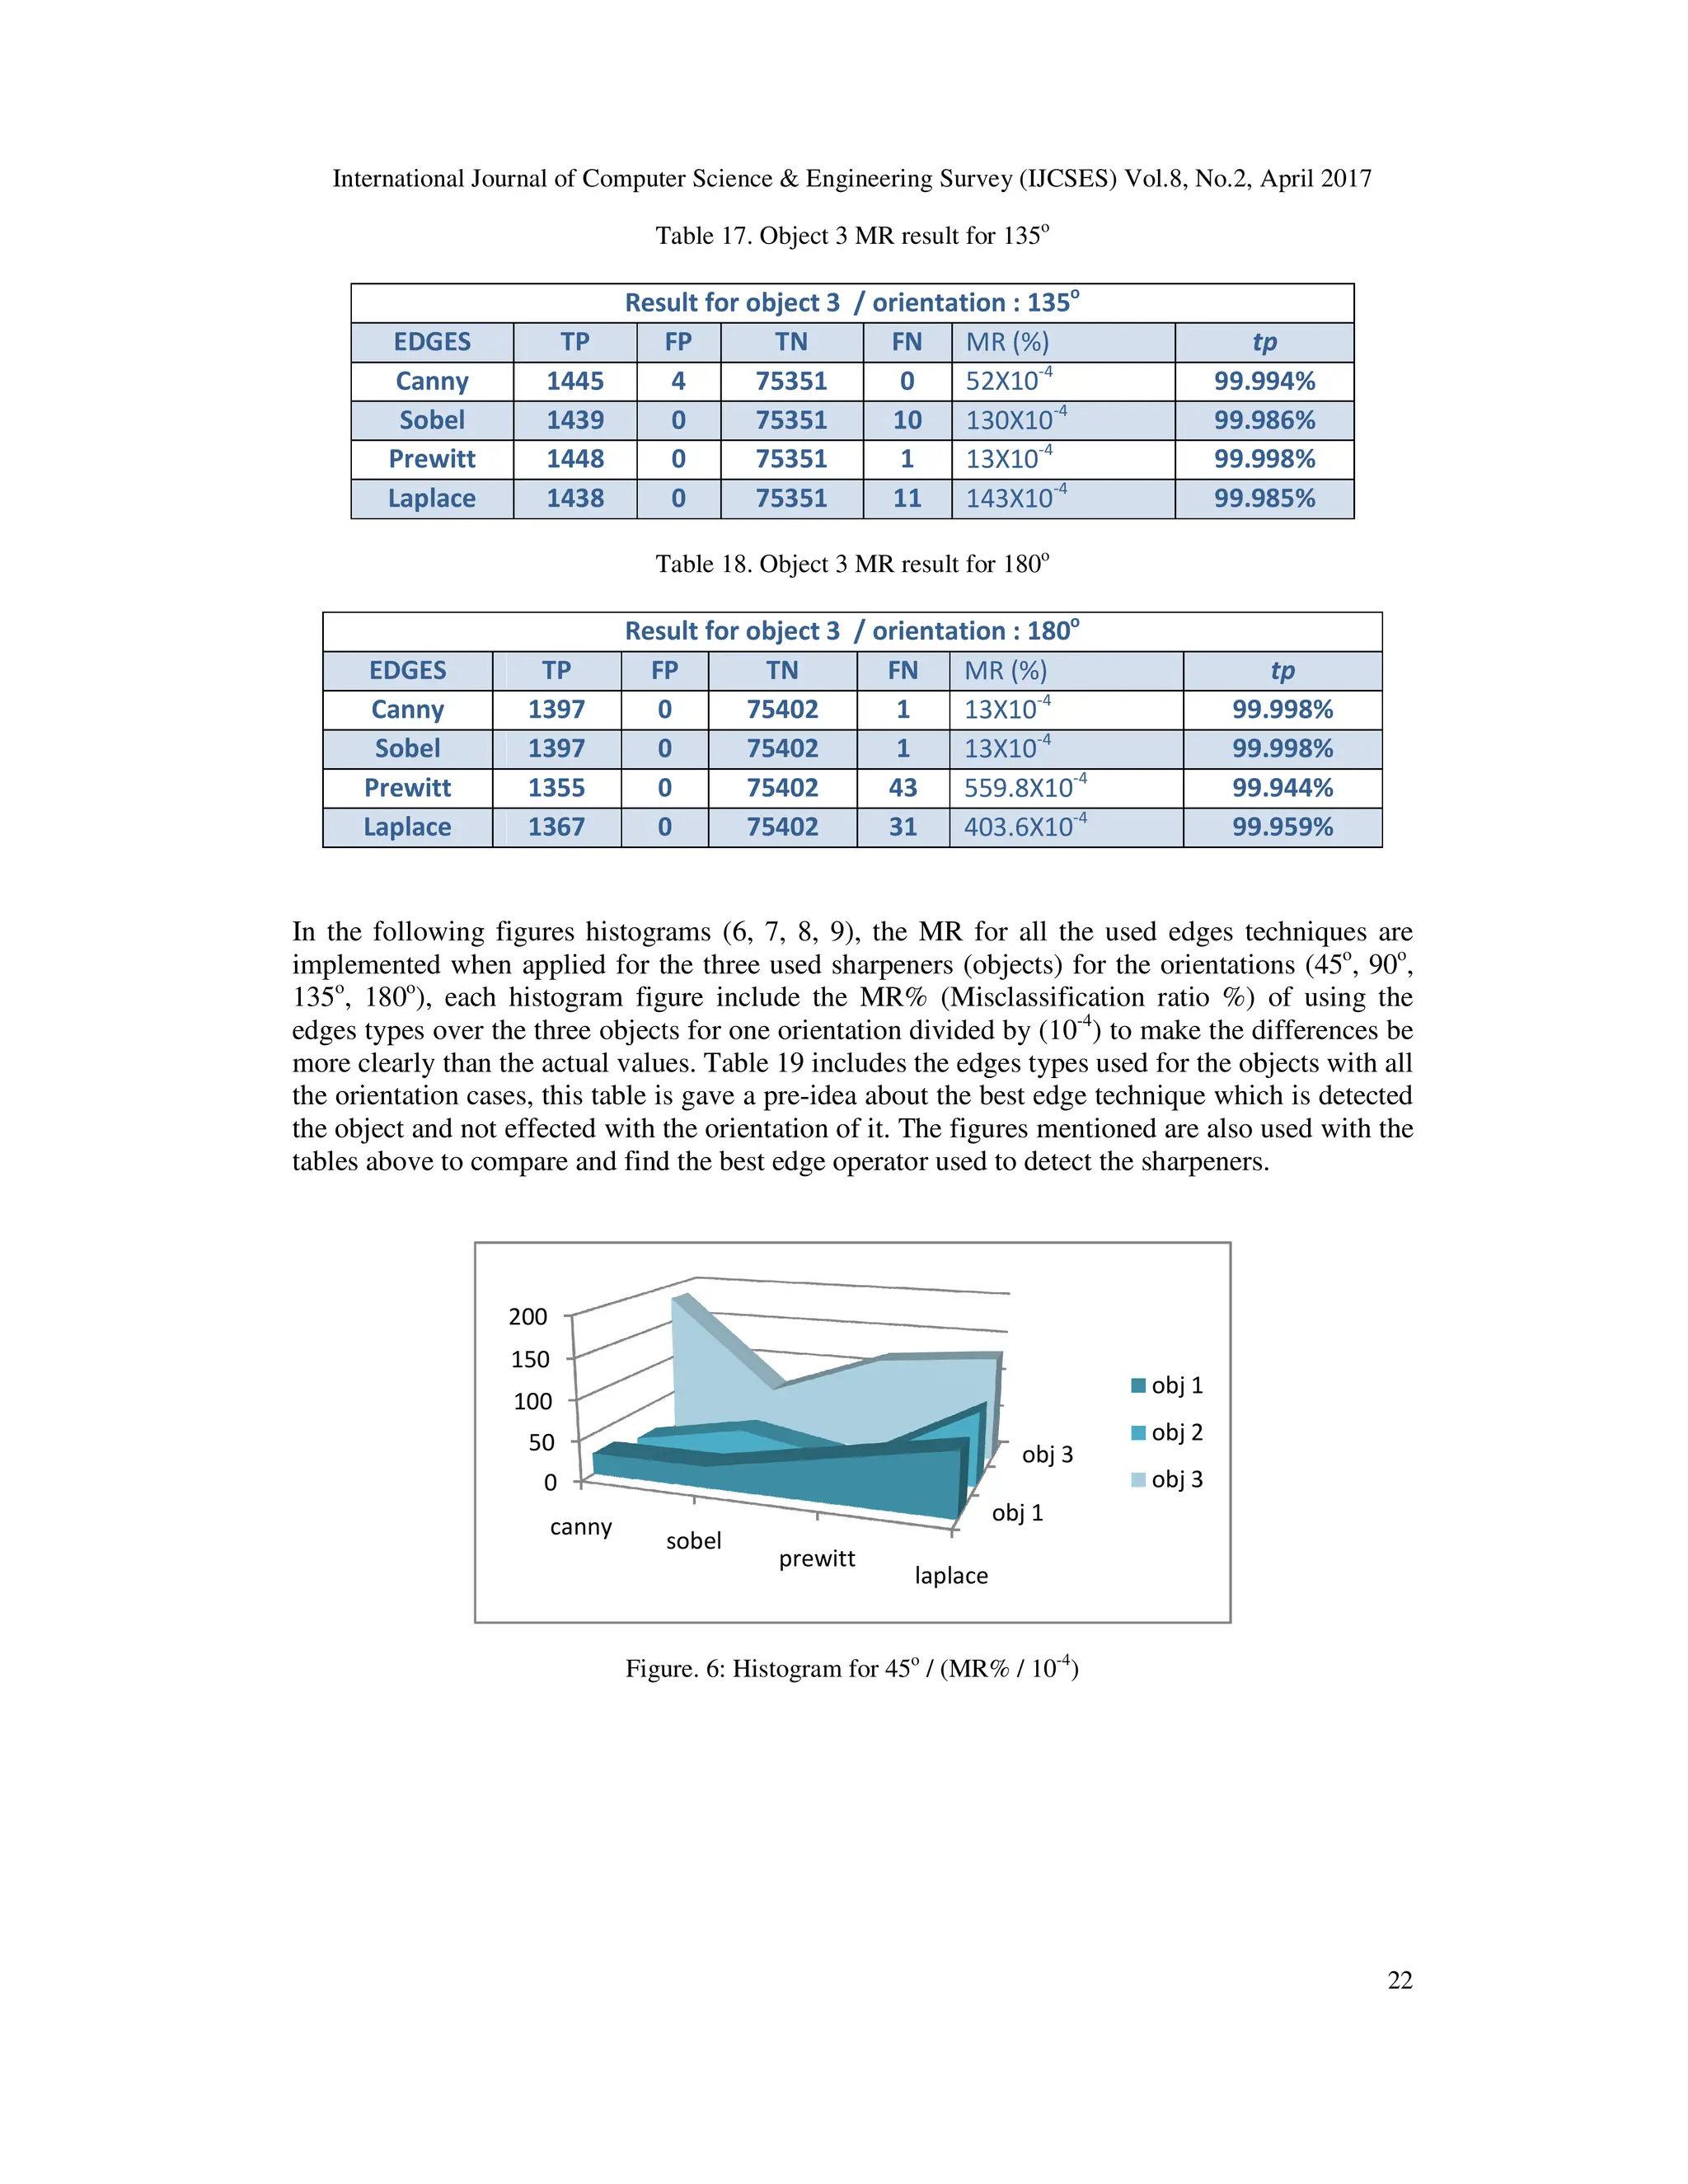
Table 1. 45o
orientation objects detected results
Object1 Object2 Object3
CANNY 1313 946 1458
SOBEL 1309 942 1466
PREWITT 1307 944 1471
LAPLACE 1305 938 1466
Table 2. 90o
orientation objects detected results
Object1 Object2 Object3
CANNY 1363 885 1451
SOBEL 1346 882 1460
PREWITT 1359 883 1456
LAPLACE 1349 871 1455](https://image.slidesharecdn.com/8217ijcses02-241211120841-03bb379f/75/ORIENTATION-EFFECTIVENESS-IN-THE-OBJECTS-DETECTED-AREAS-USING-DIFFERENT-TYPES-OF-EDGES-DETECTION-TECHNIQUES-3-2048.jpg)
![International Journal of Computer Science & Engineering Survey (IJCSES) Vol.8, No.2, April 2017
18
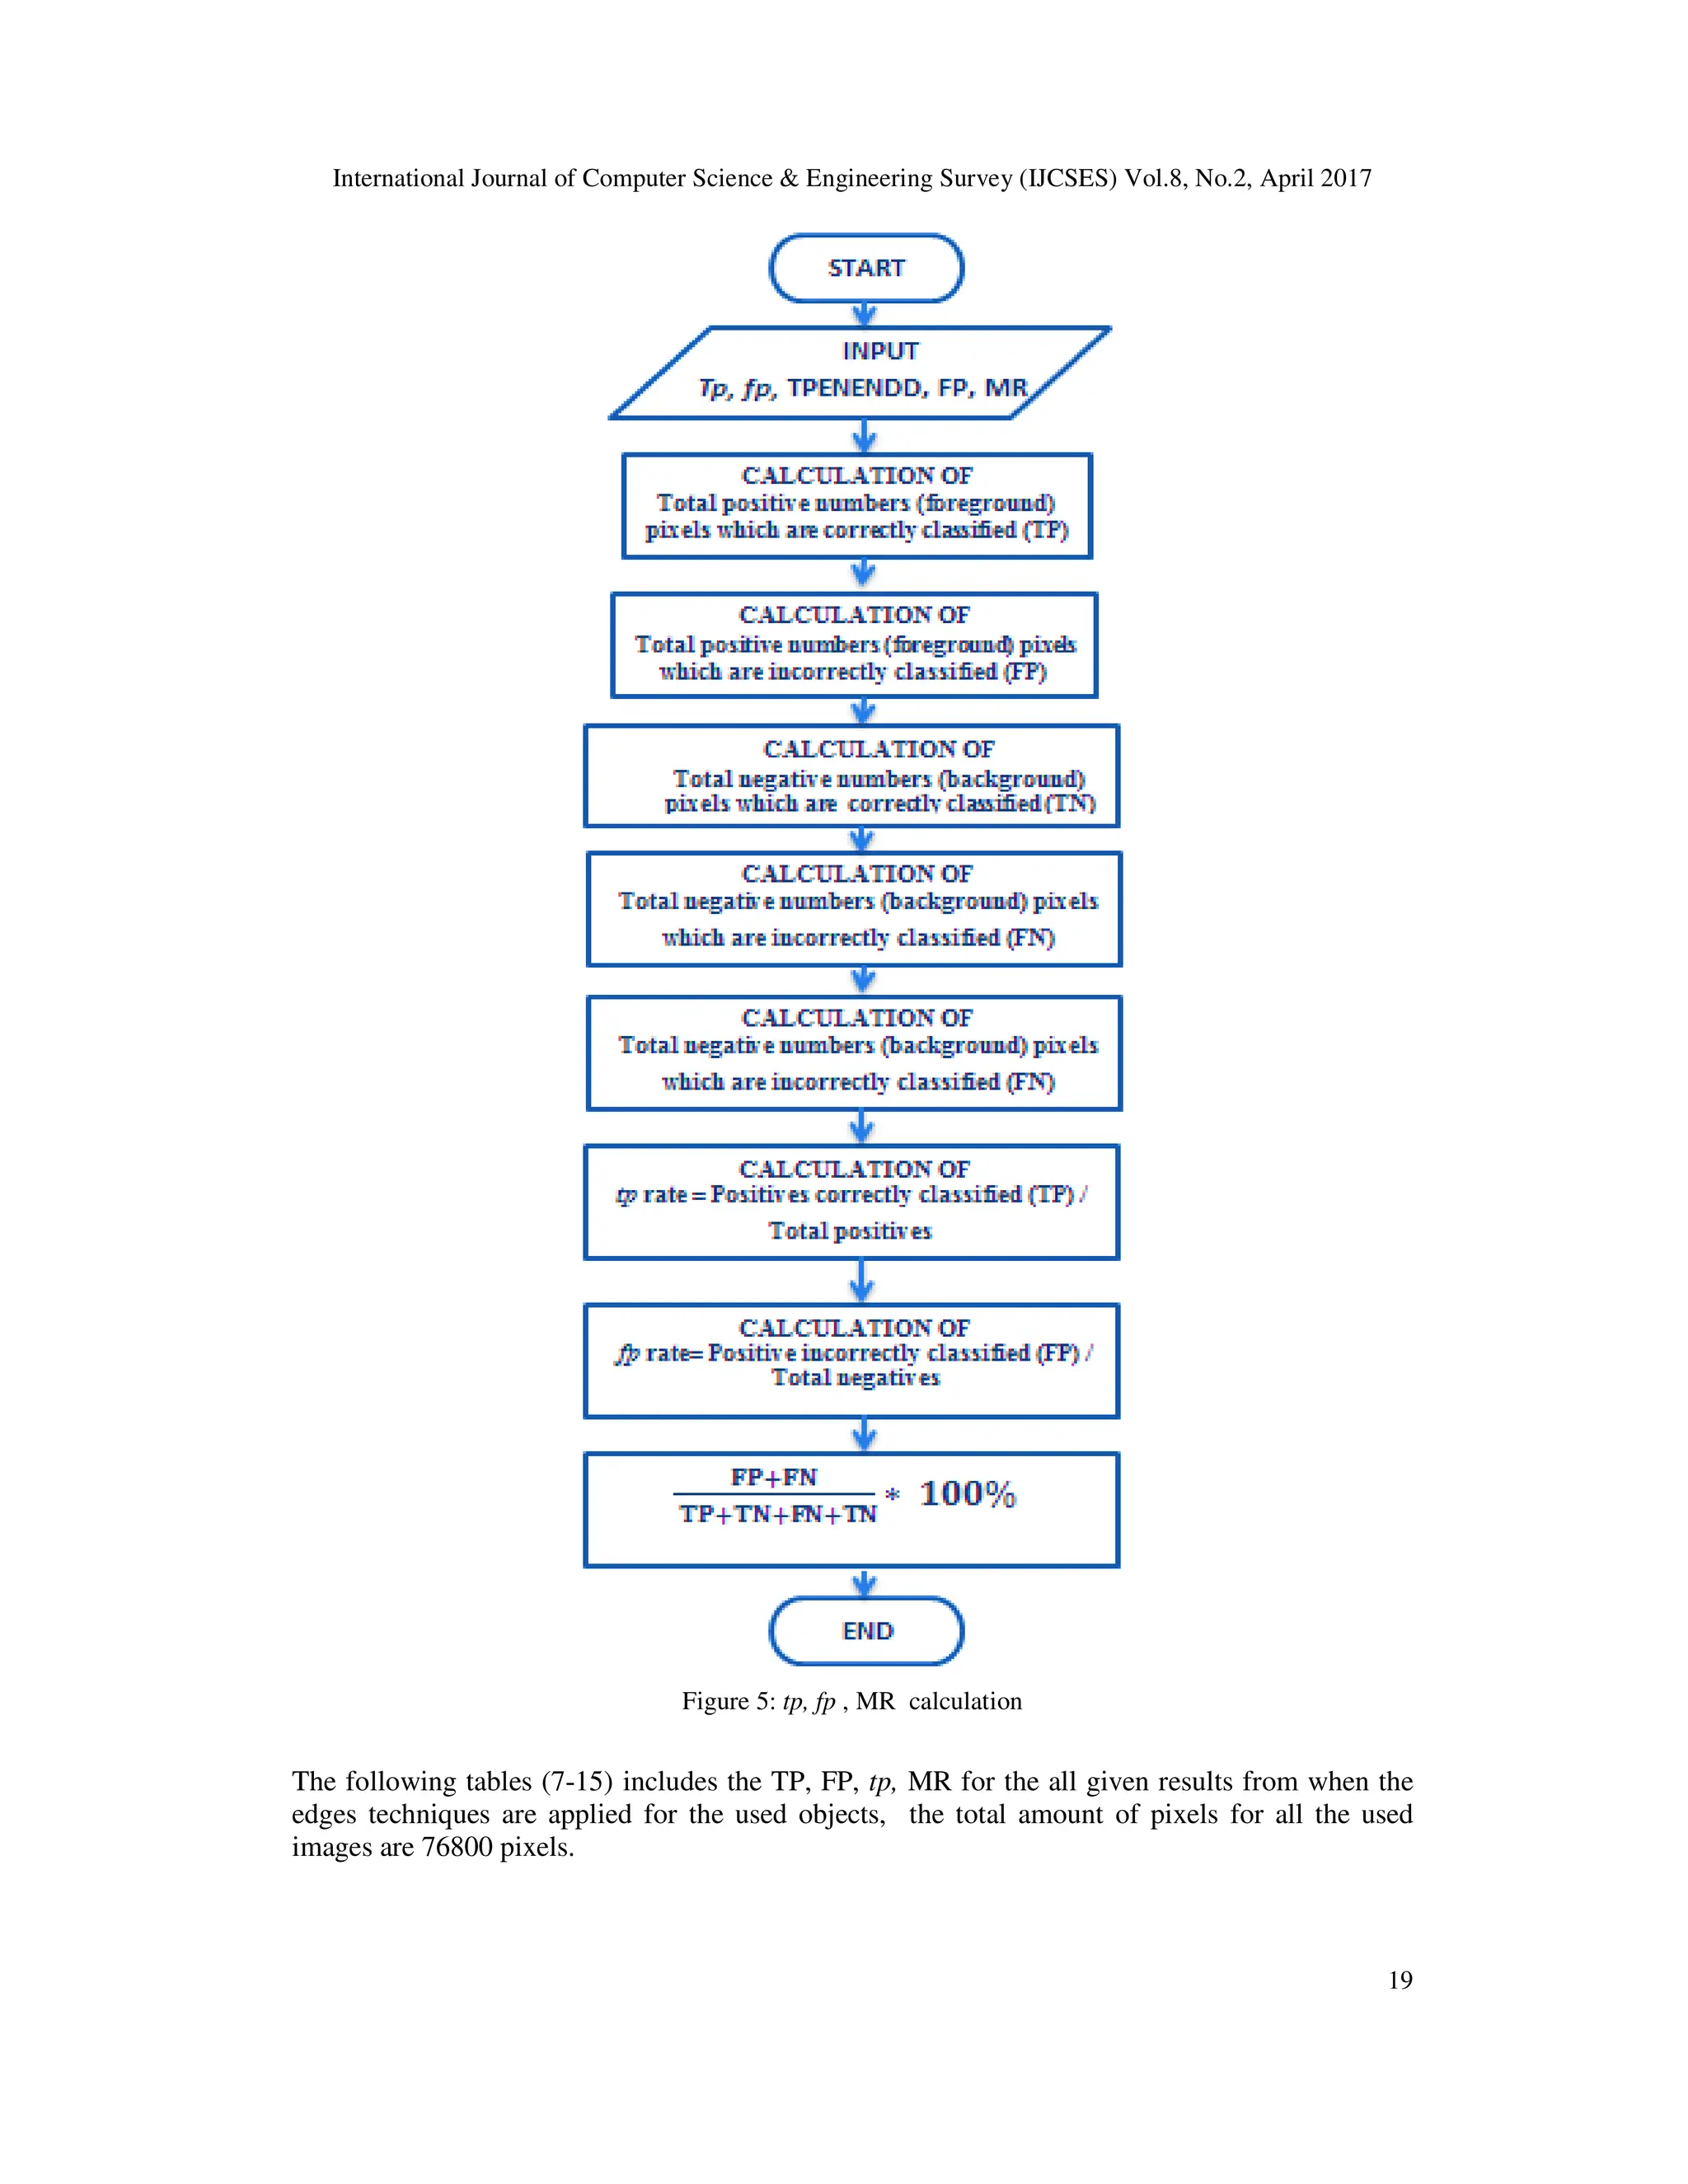
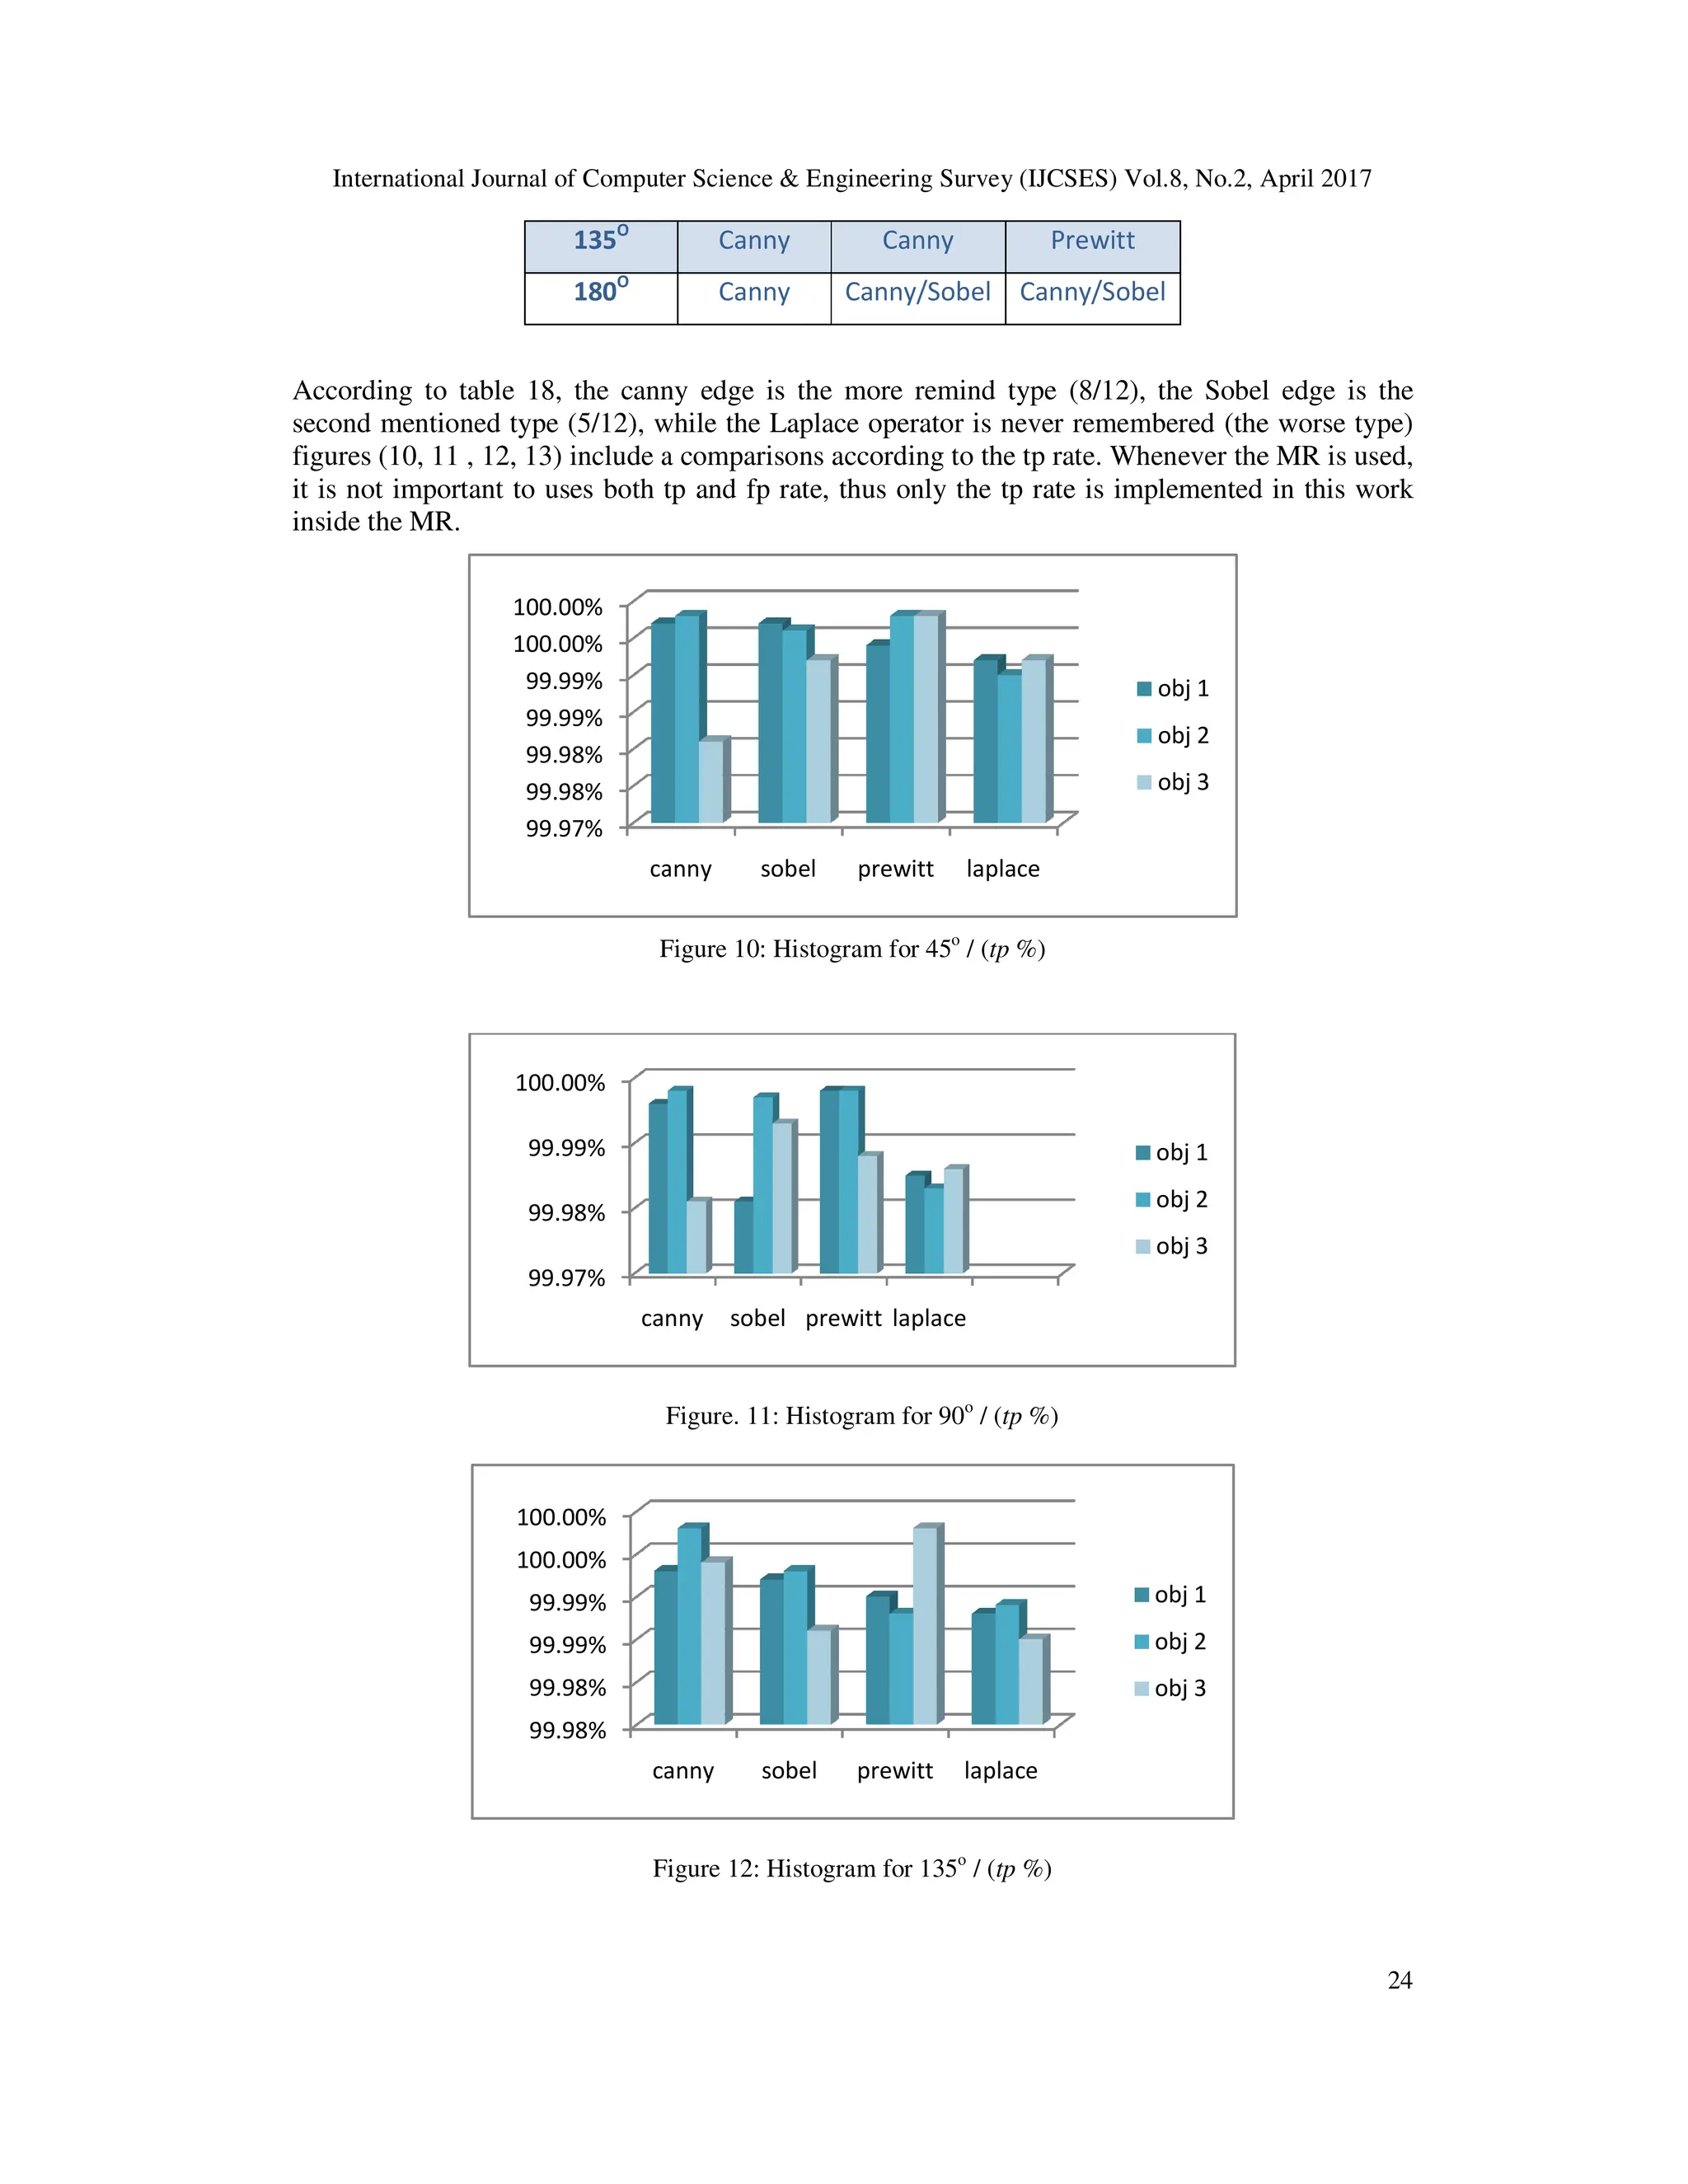
Sometime the number of detected pixels in the region of interest are not reach the actual
foreground pixel’s number thus many methods are used over the time to refer to the errors and
make many enhancement for the not well detected methods, the MR (Misclassification Ratio) [9-
10], is used to find the error in detection for each one of the three used sharpeners (objects) for
the four detected orientations (45, 90, 135, 180); to do that, the correctly area of the objects has to
be calculated firstly, this is done by assuming that the object (sharpener) is a foreground part
while the other parts are represented as a background, thus the subtraction operation is applied for
the binary images mode to calculate the correctly object’s area. The following steps and equations
are used to find the MR:
• Total positive numbers (foreground) pixels which are correctly classified (TP) are
normalized by the total positive (foreground) in order pixels to find (tp rate).
• Total positive numbers (foreground) pixels which are incorrectly classified (FP) are
normalized by the total positive (foreground) pixels in order to find (fp rate).
• Total negative numbers (background) pixels which are correctly classified (TN).
• Total negative numbers (background) pixels which are incorrectly classified (FN).
• The true positive rate [10] (also called hit rate and recall) of a classifier is estimated as:
• tp rate = Positives correctly classified (TP) / Total positives (1)
• The false positive rate [10] (also called false alarm rate) of the classifier is estimated as:
• fp rate= Positive incorrectly classified (FP) / Total negatives (2)
• Finally to calculate the MR the following equation has to be used according to the
following equation:
• MR =(FP+FN)/( TP+TN+FN+TN)* 100% (3)
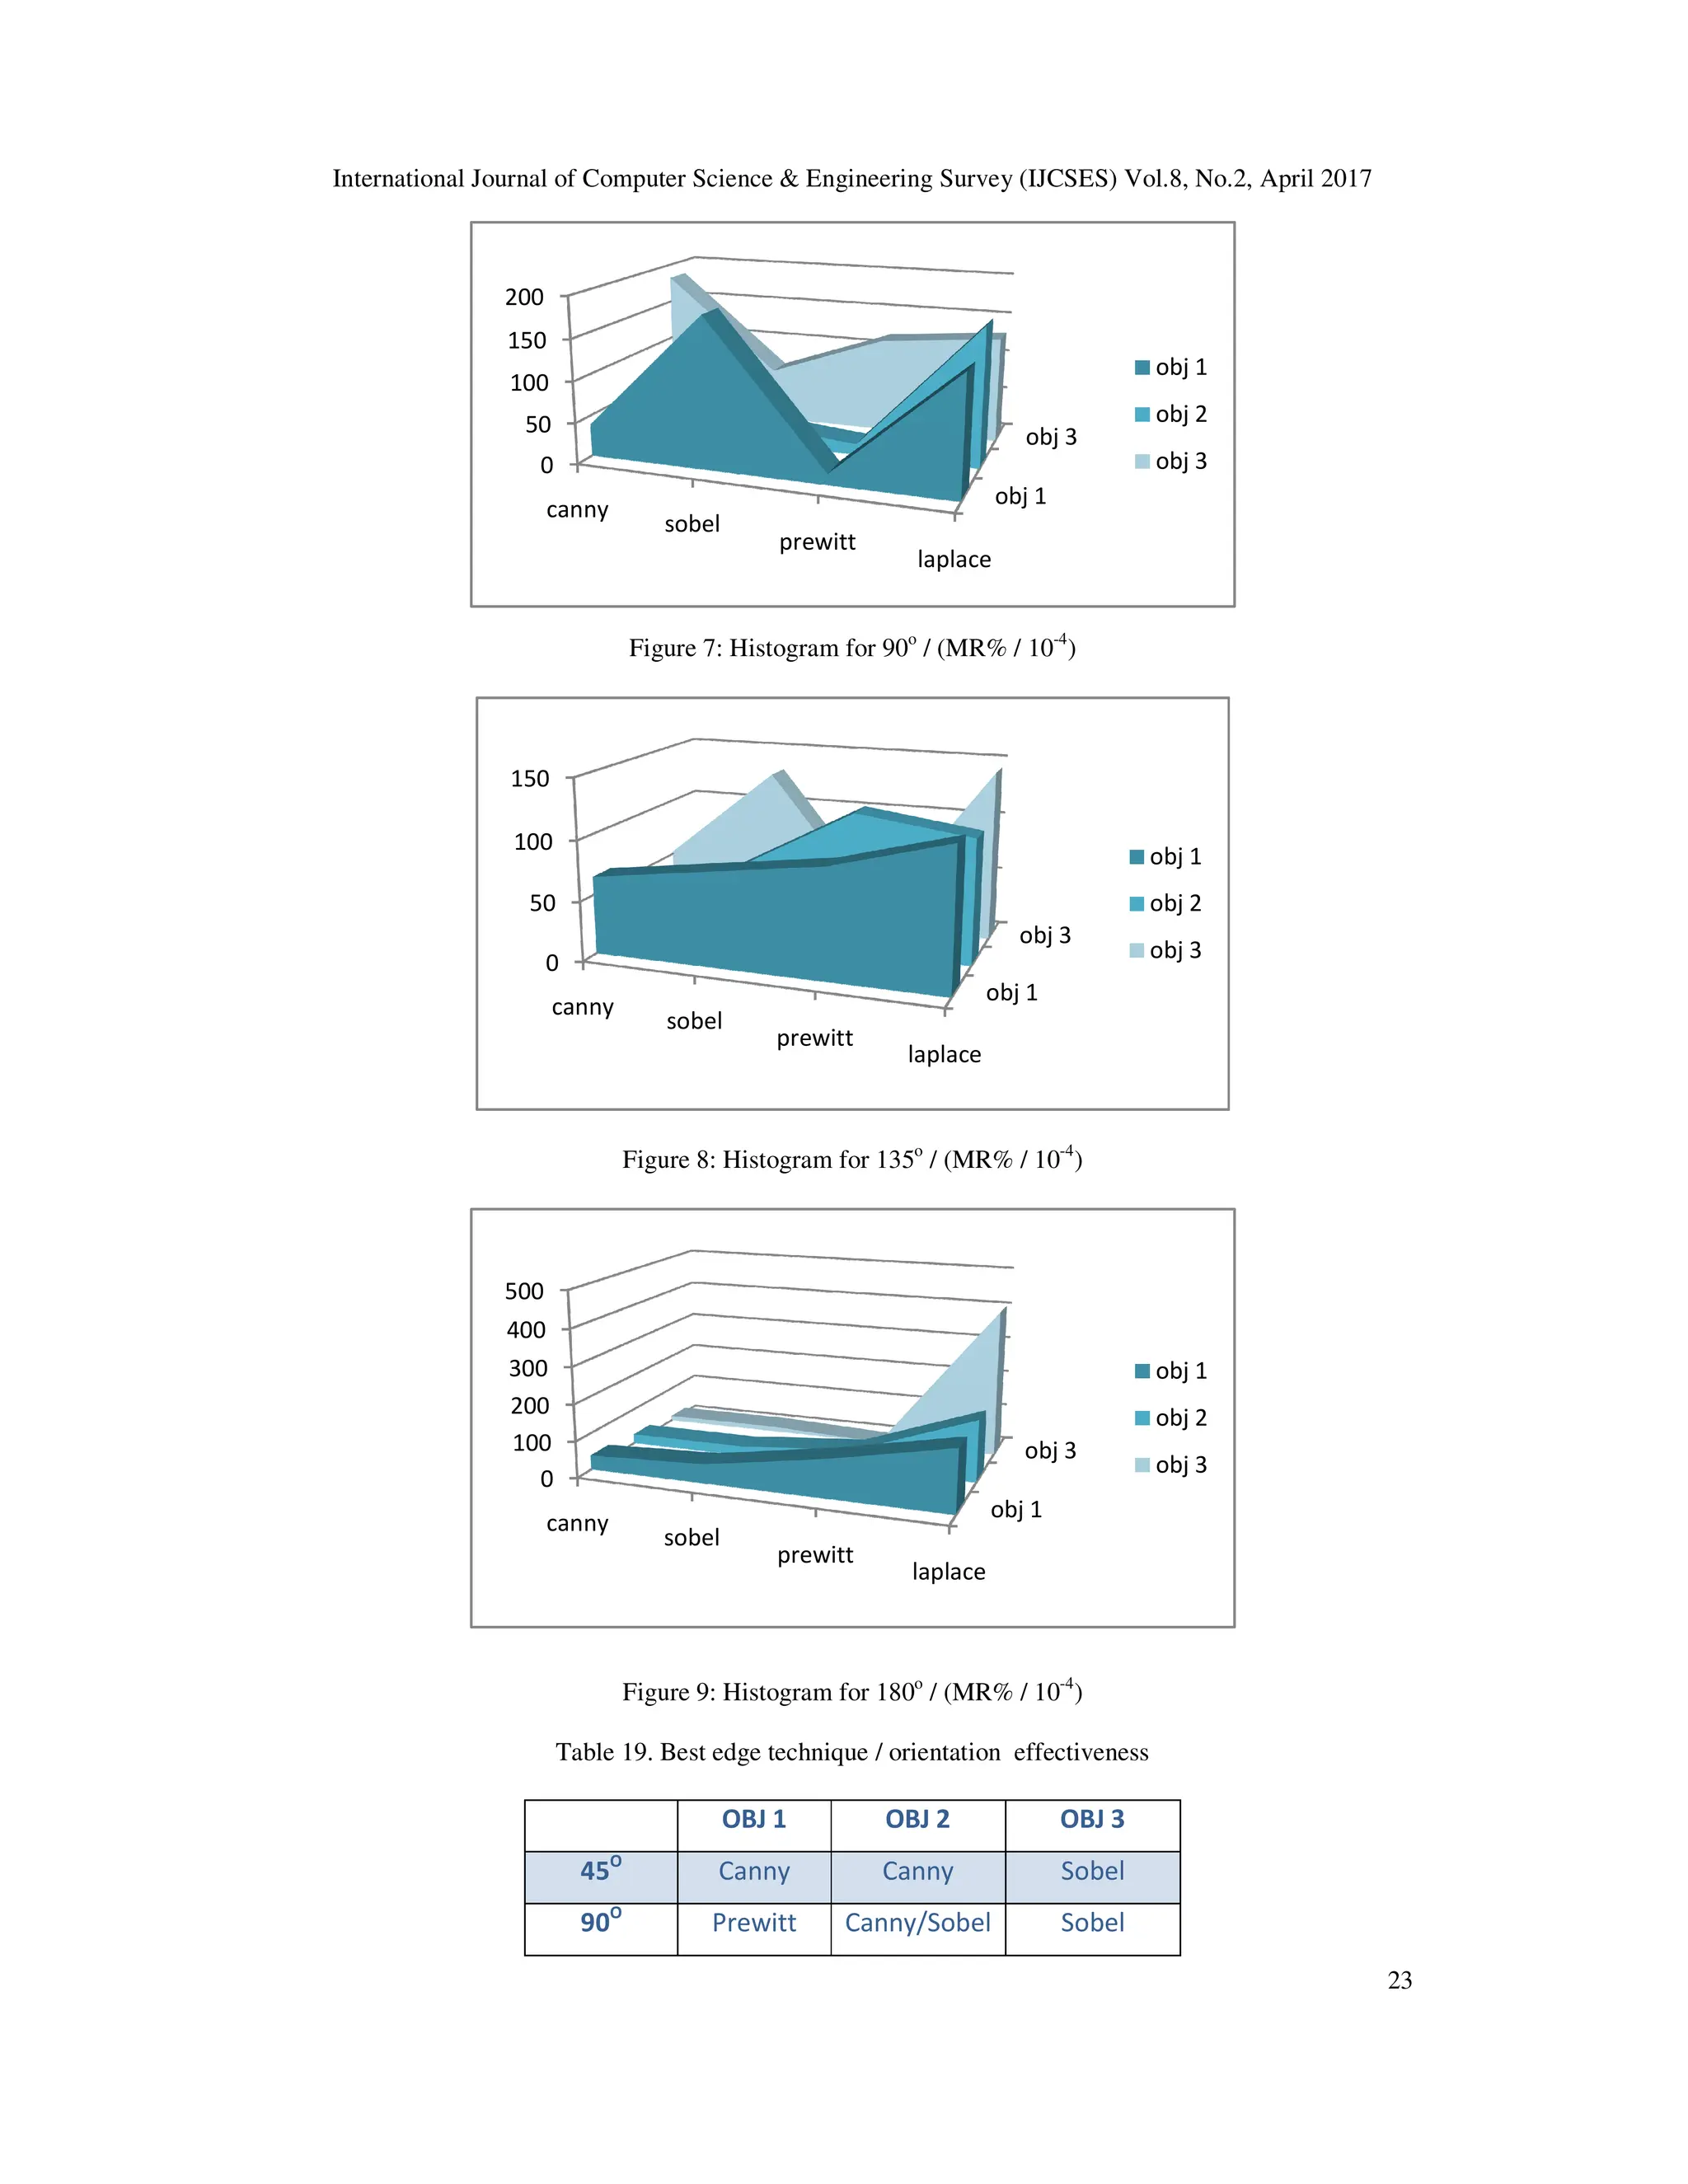
Figure 5 include a flow chard to find the tp, fp and MR factors in steps. In order find all of the
mentioned factors, it is important to record the information of the captured images for the used
objects before applying operations, these information include the directions of image to calculate
the amount of each image’s pixels, table 6 include the properties for the used images.
Table 6. Used images properties
Dimensions 320 x 240
Width 320 pixels
Height 240 pixels
Horizontal
Resolution
96 dpi
Vertical Resolution 96 dpi
Bit Depth 24](https://image.slidesharecdn.com/8217ijcses02-241211120841-03bb379f/75/ORIENTATION-EFFECTIVENESS-IN-THE-OBJECTS-DETECTED-AREAS-USING-DIFFERENT-TYPES-OF-EDGES-DETECTION-TECHNIQUES-6-2048.jpg)


![International Journal of Computer Science & Engineering Survey (IJCSES) Vol.8, No.
Fig
4. CONCLUSION
In this work, a study of orientation effectiveness is done for many edges detection techniques,
the Canny, Sobel, Prewitt, and the Laplace operators are used to detect three different colored
sharpeners, each one of these sharpeners are captured and dete
(45o, 90o, 135o, 180o), the results of detections using these detection types are compared one
with each other for the all objects (sharpeners) under the orientations used during the camera
capturing operation, in order to
misclassification ratio, are used, the tp rate are then used inside the MR to ensure the given
results, although that the Sobel is be
sharpener (light green sharpener) but the average given results shown that the canny edge type is
the best used one, the Laplace operator is the worst used technique for all the objects and the used
orientations, finally and according to the results the canny e
objects have to be detected or captured by camera under many expected orientation.
5. FUTURE WORK
Other type of complex objects ‘shapes can be used inside the sharpeners. Insides the edges
techniques, many other detection
effectiveness. Other type of methods can be used inside the MR and the tp rate to find the best or
the less effected method with the object orientation or effectiveness of the camera
for the captured images.
6. REFERENCES
[1] Min C. Shin, Dmitry B. Goldgof, Kevin W. Bowyer, and Savvas Nikiforou, 2001. Comparison of
Edge Detection Algorithms Using a Structure from Motion Task. IEEE Transactions on systems
man, and cybernetics - part B: cybernetics, Vol. 31, N
[2] Syed Jahanzeb Hussain Pirzada, Ayesha Siddiqui. 2013. Analysis of Edge Detection Algorithms
for Feature Extraction in Satellite Images IEEE International Conference on Space
Science and Communication, Melaka, Malaysia.
[3] Andrew H. S. Lai, Member, IEEE, and Nelson H. C. Yung, Senior Member, IEEE, 2000.
Detection by Orientation and Length Discrimination, IEE transactions on systems, man and
cybernetics, Vol. 30, No. 4.
[4] Viswanath Gopalakrishnan, Stud
IEEE, 2009. Salient Region Detection by Modeling Distributions of Color and Orientation
99.90%
99.92%
99.94%
99.96%
99.98%
100.00%
canny
International Journal of Computer Science & Engineering Survey (IJCSES) Vol.8, No.2,
Figure 13: Histogram for 180o
/ (tp %)
In this work, a study of orientation effectiveness is done for many edges detection techniques,
the Canny, Sobel, Prewitt, and the Laplace operators are used to detect three different colored
sharpeners, each one of these sharpeners are captured and detected in many orientation cases
(45o, 90o, 135o, 180o), the results of detections using these detection types are compared one
with each other for the all objects (sharpeners) under the orientations used during the camera
capturing operation, in order to compare between the used edges detection techniques, the
misclassification ratio, are used, the tp rate are then used inside the MR to ensure the given
obel is better than the other in two orientation used for the third
ner (light green sharpener) but the average given results shown that the canny edge type is
aplace operator is the worst used technique for all the objects and the used
orientations, finally and according to the results the canny edge is nominated to be used when an
objects have to be detected or captured by camera under many expected orientation.
Other type of complex objects ‘shapes can be used inside the sharpeners. Insides the edges
techniques, many other detection methods can be examined to check their orientations
effectiveness. Other type of methods can be used inside the MR and the tp rate to find the best or
the less effected method with the object orientation or effectiveness of the camera
Min C. Shin, Dmitry B. Goldgof, Kevin W. Bowyer, and Savvas Nikiforou, 2001. Comparison of
Edge Detection Algorithms Using a Structure from Motion Task. IEEE Transactions on systems
part B: cybernetics, Vol. 31, No. 4.
Syed Jahanzeb Hussain Pirzada, Ayesha Siddiqui. 2013. Analysis of Edge Detection Algorithms
for Feature Extraction in Satellite Images IEEE International Conference on Space
Science and Communication, Melaka, Malaysia.
Andrew H. S. Lai, Member, IEEE, and Nelson H. C. Yung, Senior Member, IEEE, 2000.
Detection by Orientation and Length Discrimination, IEE transactions on systems, man and
Viswanath Gopalakrishnan, Student Member, IEEE, Yiqun Hu, and Deepu Rajan, Member,
IEEE, 2009. Salient Region Detection by Modeling Distributions of Color and Orientation
canny sobel prewitt laplace
obj 1
obj 2
obj 3
, April 2017
25
In this work, a study of orientation effectiveness is done for many edges detection techniques,
the Canny, Sobel, Prewitt, and the Laplace operators are used to detect three different colored
cted in many orientation cases
(45o, 90o, 135o, 180o), the results of detections using these detection types are compared one
with each other for the all objects (sharpeners) under the orientations used during the camera
compare between the used edges detection techniques, the
misclassification ratio, are used, the tp rate are then used inside the MR to ensure the given
ter than the other in two orientation used for the third
ner (light green sharpener) but the average given results shown that the canny edge type is
aplace operator is the worst used technique for all the objects and the used
dge is nominated to be used when an
Other type of complex objects ‘shapes can be used inside the sharpeners. Insides the edges
methods can be examined to check their orientations
effectiveness. Other type of methods can be used inside the MR and the tp rate to find the best or
the less effected method with the object orientation or effectiveness of the camera’s orientation
Min C. Shin, Dmitry B. Goldgof, Kevin W. Bowyer, and Savvas Nikiforou, 2001. Comparison of
Edge Detection Algorithms Using a Structure from Motion Task. IEEE Transactions on systems
Syed Jahanzeb Hussain Pirzada, Ayesha Siddiqui. 2013. Analysis of Edge Detection Algorithms
for Feature Extraction in Satellite Images IEEE International Conference on Space
Andrew H. S. Lai, Member, IEEE, and Nelson H. C. Yung, Senior Member, IEEE, 2000. Lane
Detection by Orientation and Length Discrimination, IEE transactions on systems, man and
ent Member, IEEE, Yiqun Hu, and Deepu Rajan, Member,
IEEE, 2009. Salient Region Detection by Modeling Distributions of Color and Orientation](https://image.slidesharecdn.com/8217ijcses02-241211120841-03bb379f/75/ORIENTATION-EFFECTIVENESS-IN-THE-OBJECTS-DETECTED-AREAS-USING-DIFFERENT-TYPES-OF-EDGES-DETECTION-TECHNIQUES-13-2048.jpg)
![International Journal of Computer Science & Engineering Survey (IJCSES) Vol.8, No.
[5] Sherman Y. T. Lang, Member, IEEE, and Yili Fu, Member, IEEE, 2000. Visua
Measurement of Orientation Error for a Mobile Robot, IEEE transactions on industrial and
measurement, Vol. 49, No. 6.
[6] Umbaugh, Scott E 2010. Digital image processing and analysis : human and computer vision
applications with CVIP tools (2nd
[7] Canny ,J, 1986, A Computational Approach To Edge Detection, IEEE Trans. Pattern
Analysis and Machine Intelligence, 8(6):679
[8] Scharr, Hanno, 2000., Optimal Operators
for Scientific Computing, Heidelberg University, Heidelberg, Germany.
[9] Gönen M., (2013), “Receiver Operating Characteristic (ROC) Curves”, Memorial Sloan
Kettering Cancer Center, Statistical and Data Analysis, Vol. 31, No. 210, pp. 1
[10] Fawcett T., (2005), “An Introduction to ROC Analysis”, Pattern Recognition Letters, Institute for the
Study of Learning and Expertise, Vol. 27, No. 8, pp. 861
[11] Irwin Sobel, (2014), “ History and Definition of the so
named the Sobel-Feldman Operator”, www.researchgate.net/publication/239398674.
[12] J. M. S. Prewit, “Object Enhancement and Extraction” Picture and Pr
Lipkin and A Rosenfeld, EDS, New York: Academic Press, 1970, PP.. 75
ACKNOWLEDGEMENTS
I would like to thank my family for
Mothanna Osama kashmola for his support.
AUTHOR
Muhamad Azhar Abdilatef Al-Obaidy
1984, he got the M.Sc. in computer engineering from Cankaya University, Ankara
Turkey, 2014, B.Sc. in computer Engineerin
2006, Now, he is an assistant lecturer at college of engineering
mechatronics engineering department
Development Department, Presidency of University of Mos
International Journal of Computer Science & Engineering Survey (IJCSES) Vol.8, No.2,
Sherman Y. T. Lang, Member, IEEE, and Yili Fu, Member, IEEE, 2000. Visua
Measurement of Orientation Error for a Mobile Robot, IEEE transactions on industrial and
Umbaugh, Scott E 2010. Digital image processing and analysis : human and computer vision
applications with CVIP tools (2nd ed.). Boca Raton, FL: CRC Press. ISBN 978-1-4398-
Canny ,J, 1986, A Computational Approach To Edge Detection, IEEE Trans. Pattern
Analysis and Machine Intelligence, 8(6):679–698..
Scharr, Hanno, 2000., Optimal Operators in Digital Image Processing. Interdisciplinary Center
for Scientific Computing, Heidelberg University, Heidelberg, Germany.
Gönen M., (2013), “Receiver Operating Characteristic (ROC) Curves”, Memorial Sloan
Cancer Center, Statistical and Data Analysis, Vol. 31, No. 210, pp. 1-18 .
Fawcett T., (2005), “An Introduction to ROC Analysis”, Pattern Recognition Letters, Institute for the
Study of Learning and Expertise, Vol. 27, No. 8, pp. 861–874 .
Irwin Sobel, (2014), “ History and Definition of the so-called “Sobel Operator” more appropriately
Feldman Operator”, www.researchgate.net/publication/239398674.
J. M. S. Prewit, “Object Enhancement and Extraction” Picture and Processing and Psychopictorics, B
Lipkin and A Rosenfeld, EDS, New York: Academic Press, 1970, PP.. 75-149
family for their help and support, the Mosul university staff, my friend
kashmola for his support.
Obaidy, Iraqi nationality, born in London –UK in
M.Sc. in computer engineering from Cankaya University, Ankara –
Turkey, 2014, B.Sc. in computer Engineering form Mosul University, Mosul , Iraq,
Now, he is an assistant lecturer at college of engineering, university of Mosul,
mechatronics engineering department , and also the head of Research and
Development Department, Presidency of University of Mosul.
, April 2017
26
Sherman Y. T. Lang, Member, IEEE, and Yili Fu, Member, IEEE, 2000. Visual
Measurement of Orientation Error for a Mobile Robot, IEEE transactions on industrial and
Umbaugh, Scott E 2010. Digital image processing and analysis : human and computer vision
-0205-2.
Canny ,J, 1986, A Computational Approach To Edge Detection, IEEE Trans. Pattern
in Digital Image Processing. Interdisciplinary Center
Gönen M., (2013), “Receiver Operating Characteristic (ROC) Curves”, Memorial Sloan
Fawcett T., (2005), “An Introduction to ROC Analysis”, Pattern Recognition Letters, Institute for the
called “Sobel Operator” more appropriately
Feldman Operator”, www.researchgate.net/publication/239398674.
ocessing and Psychopictorics, B
iversity staff, my friend](https://image.slidesharecdn.com/8217ijcses02-241211120841-03bb379f/75/ORIENTATION-EFFECTIVENESS-IN-THE-OBJECTS-DETECTED-AREAS-USING-DIFFERENT-TYPES-OF-EDGES-DETECTION-TECHNIQUES-14-2048.jpg)

This study evaluates the effectiveness of different edge detection techniques, specifically Canny, Sobel, Prewitt, and Laplace, applied to the detection of pencil sharpeners in varying orientations. The analysis utilizes metrics such as minimal bounding rectangle (MBR) for area calculation and misclassification ratio (MR) for accuracy assessment. Results indicate that Canny edge detection consistently outperforms the other methods across all orientations tested.


![Seller Deck - Presentation [Concert L2].PPTX](https://cdn.slidesharecdn.com/ss_thumbnails/sellerdeck-presentationconcertl2-251219171156-24982daf-thumbnail.jpg?width=640&height=640&fit=bounds)


